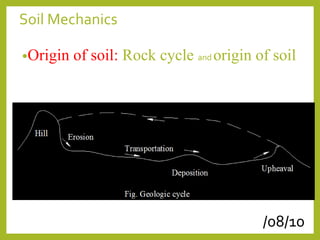
This document discusses soil mechanics and properties. It covers the origin and classification of soils, particle size distribution, indices like void ratio and specific gravity. Engineering properties like permeability, compressibility and shear strength are also mentioned. Different tests for soil classification like sieve analysis, hydrometer analysis, and Atterberg limits are described. Concepts of three phase diagrams, void ratio, porosity, degree of saturation and their relationships are explained. Engineering applications of void ratio are provided.
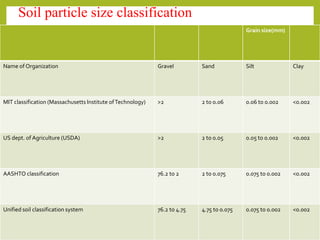
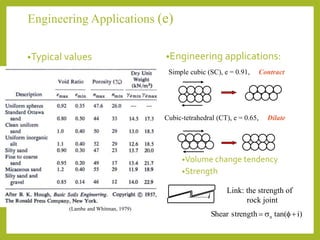
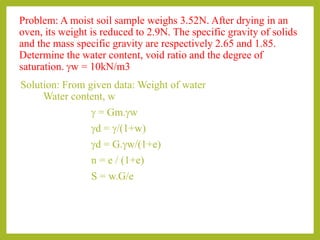
![• Various unit weight relationships: (Usefull for solveing the problem)
Moist unit weight (g) Dry unit weight(gd) Saturated unit weight(gsat)
wSnnwGs
wnwGs
S
Gsw
wGsw
e
weSGs
e
wGsw
ggg
gg
g
g
g
g
g
g
..)1(.
)1)(1(.
.
1
.).1(
1
)..(
1
.).1(
wnsatd
e
we
satd
nwGsd
e
wGs
d
w
d
ggg
g
gg
gg
g
g
g
g
.
1
.
)1(.
1
.
1
wnGsnsat
e
weGs
sat
gg
g
g
)].).1[(
1
).(
](https://image.slidesharecdn.com/civ341-180520171123/85/Soil-Mechanics-42-320.jpg)
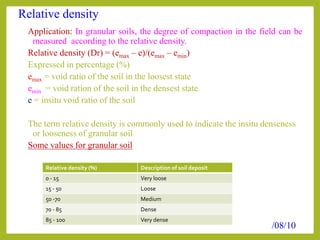

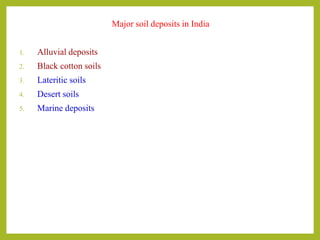
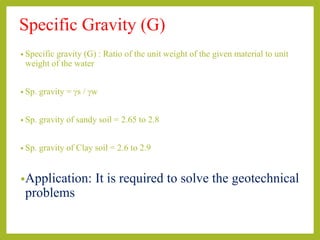
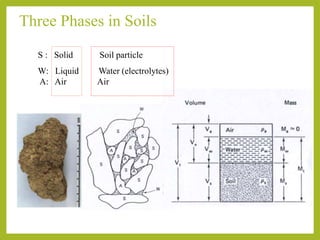
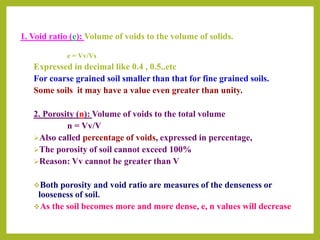
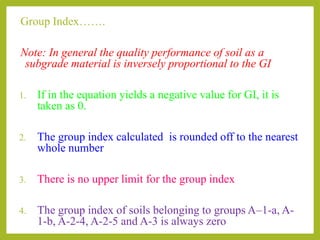
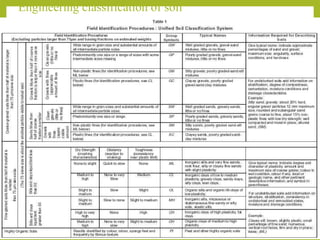
![Group Index (GI):
Significance: To evaluate the quality of soil as a
highway material.
GI = (F200 – 35)[0.2+0.005(LL – 40)]+0.01(F200 – 15)(PI -10)
Where, F200 = Percentage passing through the No. 200 sieve
LL = liquid limit
PI = Plastic limit
1st term - (F200 – 35)[0.2+0.005(LL – 40)] – Partial group index
determined from liquid limit
2nd term - 0.01(F200 – 15)(PI -10) – Partial group index
determined from plastic limit](https://image.slidesharecdn.com/civ341-180520171123/85/Soil-Mechanics-90-320.jpg)
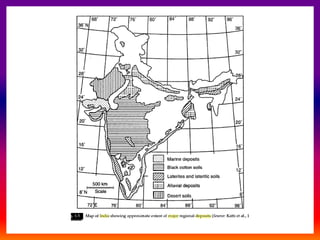
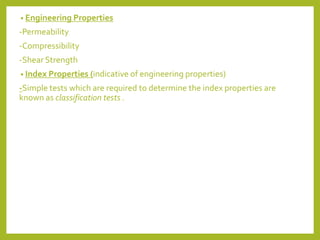
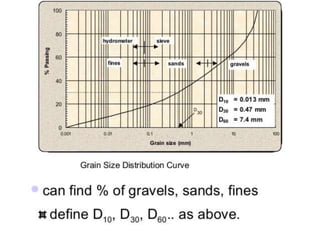
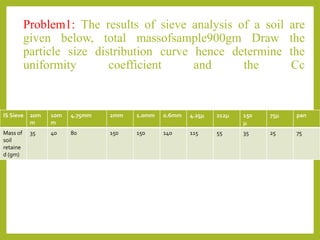
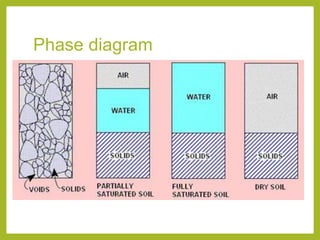
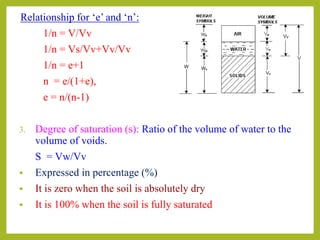
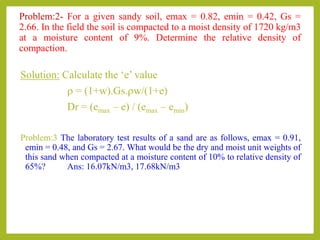
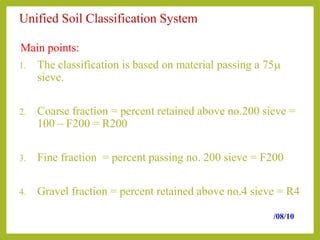
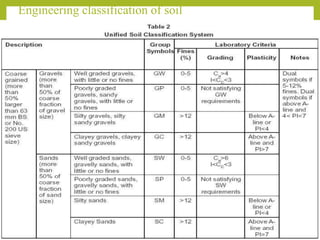
![Problem 1: The result of the particle size analysis of a soils as
follows:
a. % passing through no.10 sieve = 100
b. % passing through no.40 sieve = 80
c. % passing through no.200 sieve = 58
liquid limit and plasticity index of the minus no.40 fraction of the
soil are 30 and 10 respectively. Calculate the GI
Solution:
GI = (F200 – 35)[0.2+0.005(LL – 40)]+0.01(F200 – 15)(PI -10)](https://image.slidesharecdn.com/civ341-180520171123/85/Soil-Mechanics-92-320.jpg)
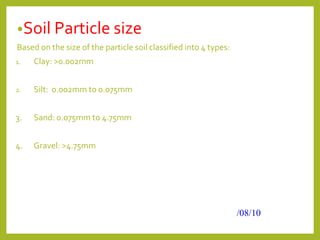
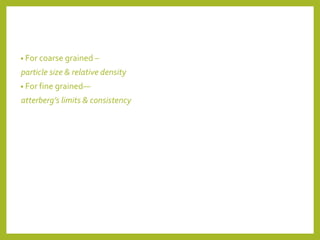
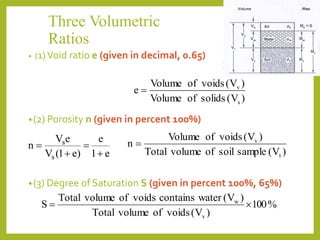
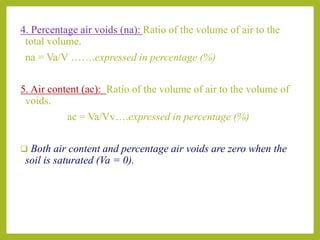
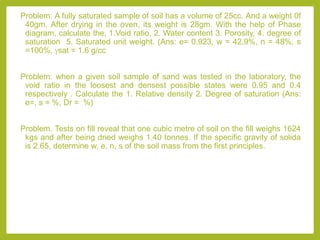
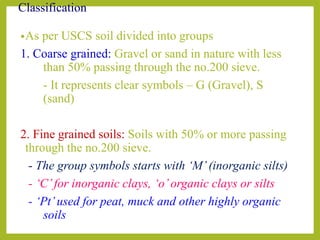
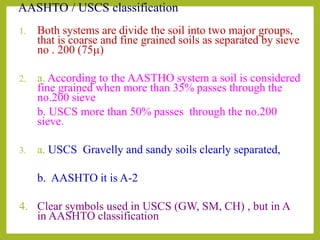
![Problem:2, Ninty five percent of a soil passes through the no.200
sieve and has a liquid limit of 60 and plasticity index of 40.
Calculate th GI.
Solution:
GI = (F200 – 35)[0.2+0.005(LL – 40)]+0.01(F200 – 15)(PI -10)](https://image.slidesharecdn.com/civ341-180520171123/85/Soil-Mechanics-93-320.jpg)


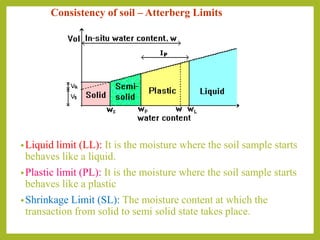
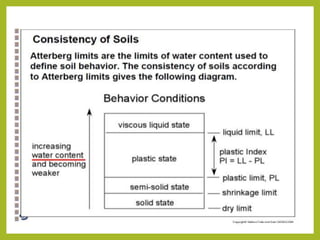
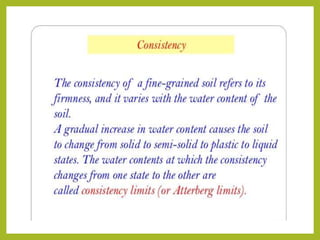
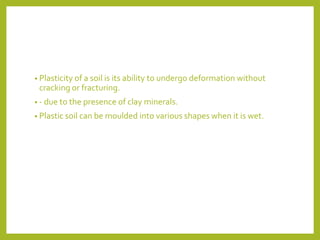
![Geotechnical Engineering-I [Lec #9: Atterberg limits]](https://cdn.slidesharecdn.com/ss_thumbnails/9-180923180923-thumbnail.jpg?width=640&height=640&fit=bounds)