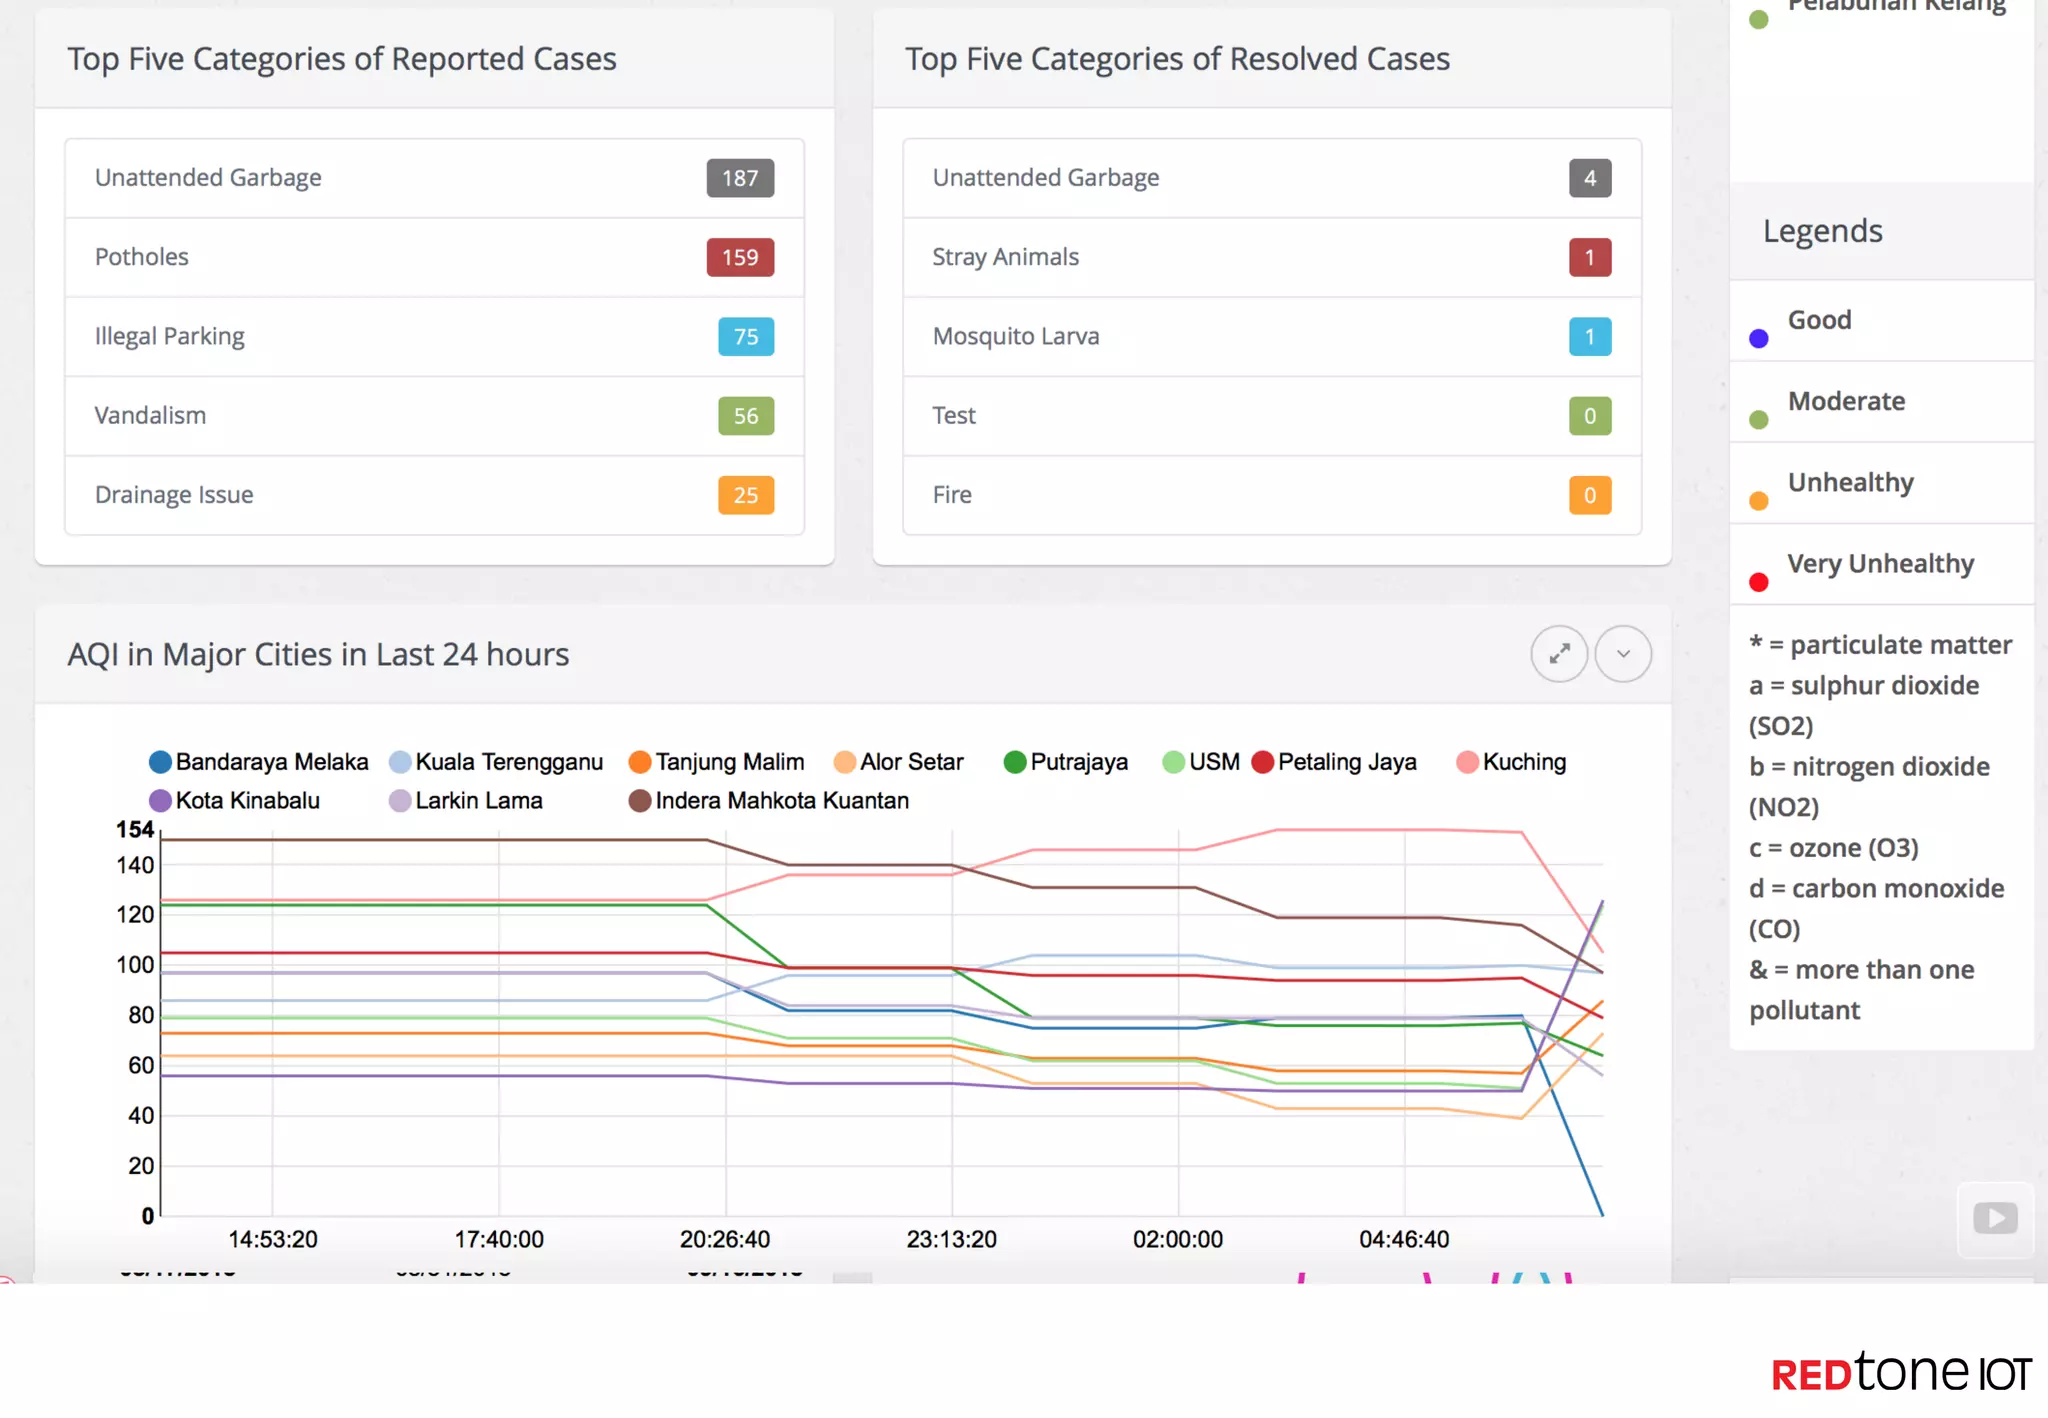
LISTEN TO THE
PULSE OF THE
CITY USING IOT
Dr. Mazlan Abbas
CEO - REDtone IOT Sdn Bhd
Email: mazlan.abbas@redtone.com
UTHM, Sept. 21, 2015
What is Your Pulse Rate?
What-If You Can Capture
More Than Your
Heart Beat?
PRESENTATION CONTENTS
•  Need to Connect Things
•  Why IoT?
•  Opportunities & Challenges
•  Building Smart Cities
•  Making Sense of Data
•  Pulse of the City
•  Summary
What items
are missing?
Who is a
better and
safer bus
driver?
How reduce
my electricity
bill?
When is my
next train?
Where can I
park?
Why are my
items not
selling?
THE NEED TO CONNECT THINGS
How Big is the IOT Market?
IOT – BASICS TO ADVANCED SERVICES
Monitor
Autonomous
Optimize
Control
IOT BENEFITS
Improved
Performance
Reduced
Costs
Create
Innovative
Products
New Revenue
Streams
Security and Privacy of
data
Managing vast
amounts of data
Fragmented industry
Finding the right
business model
WHAT ARE THE BUSINESS CHALLENGES
The Final Aim of Smart City
•  To support better living, create more opportunities, support stronger
and more cohesive communities and improve the quality of life
overall for all residents
•  To make a better use of the public resources
•  Reducing the operational costs of the public administrations.
Cities are the engines for economic growth
But the development was not always “smart,”
sacrificing health conditions, for instance, for greater
productivity.
Multiplier Effect of Economic Growth via
Technology
With greater use of technology, a number of cities are accumulating data,
delivering innovation, and enhancing lives of citizens.
BUILDING 3 TYPES OF CITIES
1.  ROI-driven
–  the aim of rolling out smart city technologies is to
generate income which pays for its deployment and
more. There are many cities in the western
hemisphere which fall into this category, such as Los
Angeles, London.
2.  Carbon-driven
–  The aim here is to reduce the carbon footprint and
ideally become carbon neutral long-term. These are
mainly cities in Middle and Northern Europe, such as
Luxembourg, Helsinki, etc.
3.  Vanity-driven
–  Finally, “vanity” driven cities are mainly driven by
events where the entire world is watching and they
want to be perceived as “modern”
TO OVERCOME 3 KEY CHALLENGES
Only by addressing all three can organizations turn raw data into information
and actionable insights.
Integrating data
from multiple
sources
Automating the
collection of data
Analyzing data to
effectively identify
actionable insights
MAKING SENSE OF DATA … BUT
WHAT CITY DATA?
THE GOLD RUSH
Wisdom
Knowledge
Information
Data
More
Important
Less
Important
Evaluated understanding
Appreciation of
Answers to questions.
Symbols
Understanding
Answers to
questions
WHO
WHY
HOW
WHAT
WHERE WHEN
VALUE IS CREATED BY MAKING SENSE OF DATA
VALUE PYRAMID
Wisdom
Knowledge
Information
Data
More
Important
Less
Important
N/A
Empty (0), Full (1)
Understanding
EXAMPLE - SMART PARKING
Who park at this lot?
What kind of vehicle?
Where is the empty parking lot?
When is the peak period?
How to implement a tiered charging?
How to find “overstayed” vehicles?
Why this parking area is not fully
occupied?
Who Benefits? - Citizens / Parking Operators / City Council / Shops
HOW-TO PROVIDE A SMART
CITY SOLUTIONS?
HOW-TO
DATA OWNERSHIPS
Personal /
Household
Private Public Commercial Sensor
Data Provider
Home Health Transport OfficeWaste
WHAT-IF – WE CAN DO DATA BLENDING
Creating New Compound Applications
SENSING-AS-A-SERVICE
WHAT-IF
The city would pay for access to
the light sensors in order to
decide when to turn on and off
the street lights
Gathering temperature, light,
pressure, humidity and
pollution.
COMMERCIAL IOT SENSOR PROVIDER
A university may want access
to the pollution information for
research purposes for a limited
period
The weather department
would want the temperature
and pressure data
The street town council center
would want the temperature
and humidity data for
planning during rough
weather
BENEFITS OF SENSING-AS-A-SERVICE
Harnessing
the Creativity
Rapid Deployment
Sustainable
Business Model
Assisting Scientific
Community
Smart City Agenda
For city leaders wanting to pursue a smart city agenda, citizen
inclusion is critical
As citizens turn smart so will the cities they inhibit.
Traffic Volume Maps
76% want sensors in streets, pavements and public areas to report how
crowded a street, shopping mall or park is.
THE RISE OF SMART CITIZENS
Building Trust
Citizens encounter good customer
service across government
channels
SMART CITIZEN TOOLS
Open source and
open data
Make
visible the
invisible
Sensing the city Provide tools for
the citizens to
interpret and
change the
workings of the
city
Technology may help mitigate the “black hole” problem.
EMPOWER THE CITIZENS TO SENSE
CROWDSENSING
GETTING INSIGHTS FROM
EMPOWER THE CITIZENS TO
SENSE
SMARTPHONE AS YOUR “SENSING ASSISTANT”
Sensors:
①  Camera – “Eyes”
②  Audio – “Ears”
③  Accelerometer –
“Speed”
④  GPS – “Location”
⑤  Gyroscope –
“Movement”
⑥  Compass – “Direction”
⑦  Proximity –
“Closeness”
⑧  Ambient light – “Eyes”
⑨  Others…
Crowdsourcing Via Crowdsensing
Context
①  Spatial – Location / Speed Orientation
②  Temporal – Time / Duration
③  Environmental – Temperature / Light / Noise Level
④  User Characterization – Activity (Mobility Pattern) / Social (Friends, Interactions)
MAKING CITIES BETTER USING CITIZENS
Traffic
NoiseEnvironment
Network Coverage
(WiFi/3G/4G)
LET ALL CITIZENS BE OUR “EYES”
MOBILE
APPLICATION
Citiact
Case management
system (CMS)
Citiact
dashboard
DRAINAGE ISSUES – CAUSE OF FLASH FLOOD?
CORRELATE SEVERAL DATASETS
Examples
•  Relationship between Dengue Cases with drainage issues, mosquito larvae,
weather
•  Relationship between Leptospirosis (Penyakit Kencing Tikus) with unattended
garbage, weather, etc
MOBILE
APPLICATION
Open Data
Smartphone Users
Social Media
Users
PORTAL
CITISENSE.COM
CASE
MANAGEMENT
SYSTEM
DASHBOARD
EMPOWERING SMART CITIZENS
THE MULTI-SIDED MARKET CHALLENGE
WHICH CAME FIRST – THE CHICKEN OR THE EGG?
SMART CITIZENS AND SENSORS
CONNECTING AND AGGREGATING
Smart
City
Environmental
Monitoring
Multiple Sensors
Outdoor Parking
Management
Parking sensors
Mobile
Environmental
Monitoring
Sensors installed in
public vehicles
Traffic Intensity
Monitoring
Devices located at
main entrance of
city
Guidance to free
parking lots
Panels located at
intersections
Smart Citizen
Crowdsensing
Parks and Gardens
Irrigation
Sensors in green zones
•  Temperature
•  CO
•  Noise
•  Car Presence
•  Ferromagnetic
sensors
•  Temperature
•  CO
•  Noise
•  Car
Presence
•  Measure main traffic parameters
•  Traffic volumes
•  Road occupancy
•  Vehicle speed
•  Queue Length
•  Taking information retrieved by the
deployed parking sensors in order to
guide drivers towards the available
free parking lots
•  Moisture temperature
•  Humidity
•  Pluviometer (rain gauge)
•  Anemometer (wind-speed)
•  User generated feedback
with smartphones that help
to make cities better
CHALLENGE #1
FLOOD MONITORING
PREDICTING FLOOD
1.  What is the water level in the river?
2.  When does the river swell up?
3.  Where is the location of water rise?
4.  Where are the areas that require immediate evacuation?
5.  Who is contributing to the rise in water level?
6.  How to control the water level?
7.  How fast is the water rising?
8.  Why is the water rising?
FLOOD – SENSORS & INFRA
1.  Water level and weather sensors
2.  Tide monitoring sensor
3.  Astronomical data
4.  GPS for rescue vehicles (Plug-n-Play OBD)
5.  GIS data
6.  Camera
7.  Social network integration
FLOOD MONITORING – VALUE PROPOSITION
1.  Early warning system for floods
2.  Locating the area of violation (cause of floods)
3.  Efficient rescue planning
4.  Plan the widening of the river banks
5.  Plan deepening of the river bed
6.  Predict the conditions of flooding when coupled with a weather
station, astronomical, tide and GIS.
CHALLENGE #2
WASTE MANAGEMENT
WASTE MANAGEMENT
1.  Who is collecting the garbage?
2.  What is the status of garbage bin?
3.  When was the garbage collected?
4.  Where is the location of full bins?
5.  How to plan the route of the trucks?
6.  How many days till the next collection?
7.  How much garbage is produced in an area?
8.  Why is the garbage truck not picking up garbage?
9.  Why is a particular area producing more garbage?
WASTE MONITORING – SENSORS & INFRA
1.  Garbage level sensors on garbage bins
2.  GPS on garbage trucks
3.  Network infrastructure (WiFi, 3G)
WASTE MANAGEMENT – VALUE PROPOSITION
•  Timely pickup of full garbage bins
•  Efficient routing of the garbage trucks
•  Violation of service agreement by the garbage collectors
•  Plan for future dumping sites
•  Predict the amount of garbage from an area
•  Organize awareness programs to promote recycling
•  Correlation can be derived to gauge the population in a particular
area
If You Can’t Measure It,
You Can’t Improve It
THANK YOU
@REDtoneIOTREDtoneIOT
•  EMAIL: mazlan@gmail.com
•  TWITTER: @mazlan_abbas
•  FACEBOOK: www.facebook.com/drmazlanabbas
•  LINKEDIN: my.linkedin.com/in/mazlan/
•  SLIDESHARE: www.slideshare.net/mazlan1
•  ABOUT ME: about.me/mazlan.abbas

Listen to the Pulse of the City

  • 1.
    LISTEN TO THE PULSEOF THE CITY USING IOT Dr. Mazlan Abbas CEO - REDtone IOT Sdn Bhd Email: mazlan.abbas@redtone.com UTHM, Sept. 21, 2015
  • 2.
    What is YourPulse Rate?
  • 3.
    What-If You CanCapture More Than Your Heart Beat?
  • 4.
    PRESENTATION CONTENTS •  Needto Connect Things •  Why IoT? •  Opportunities & Challenges •  Building Smart Cities •  Making Sense of Data •  Pulse of the City •  Summary
  • 5.
    What items are missing? Whois a better and safer bus driver? How reduce my electricity bill? When is my next train? Where can I park? Why are my items not selling? THE NEED TO CONNECT THINGS
  • 6.
    How Big isthe IOT Market?
  • 11.
    IOT – BASICSTO ADVANCED SERVICES Monitor Autonomous Optimize Control
  • 12.
  • 13.
    Security and Privacyof data Managing vast amounts of data Fragmented industry Finding the right business model WHAT ARE THE BUSINESS CHALLENGES
  • 14.
    The Final Aimof Smart City •  To support better living, create more opportunities, support stronger and more cohesive communities and improve the quality of life overall for all residents •  To make a better use of the public resources •  Reducing the operational costs of the public administrations.
  • 15.
    Cities are theengines for economic growth But the development was not always “smart,” sacrificing health conditions, for instance, for greater productivity.
  • 16.
    Multiplier Effect ofEconomic Growth via Technology With greater use of technology, a number of cities are accumulating data, delivering innovation, and enhancing lives of citizens.
  • 17.
    BUILDING 3 TYPESOF CITIES 1.  ROI-driven –  the aim of rolling out smart city technologies is to generate income which pays for its deployment and more. There are many cities in the western hemisphere which fall into this category, such as Los Angeles, London. 2.  Carbon-driven –  The aim here is to reduce the carbon footprint and ideally become carbon neutral long-term. These are mainly cities in Middle and Northern Europe, such as Luxembourg, Helsinki, etc. 3.  Vanity-driven –  Finally, “vanity” driven cities are mainly driven by events where the entire world is watching and they want to be perceived as “modern”
  • 18.
    TO OVERCOME 3KEY CHALLENGES Only by addressing all three can organizations turn raw data into information and actionable insights. Integrating data from multiple sources Automating the collection of data Analyzing data to effectively identify actionable insights
  • 19.
    MAKING SENSE OFDATA … BUT WHAT CITY DATA? THE GOLD RUSH
  • 20.
    Wisdom Knowledge Information Data More Important Less Important Evaluated understanding Appreciation of Answersto questions. Symbols Understanding Answers to questions WHO WHY HOW WHAT WHERE WHEN VALUE IS CREATED BY MAKING SENSE OF DATA VALUE PYRAMID
  • 21.
    Wisdom Knowledge Information Data More Important Less Important N/A Empty (0), Full(1) Understanding EXAMPLE - SMART PARKING Who park at this lot? What kind of vehicle? Where is the empty parking lot? When is the peak period? How to implement a tiered charging? How to find “overstayed” vehicles? Why this parking area is not fully occupied? Who Benefits? - Citizens / Parking Operators / City Council / Shops
  • 22.
    HOW-TO PROVIDE ASMART CITY SOLUTIONS? HOW-TO
  • 23.
    DATA OWNERSHIPS Personal / Household PrivatePublic Commercial Sensor Data Provider
  • 24.
    Home Health TransportOfficeWaste WHAT-IF – WE CAN DO DATA BLENDING Creating New Compound Applications
  • 25.
  • 26.
    The city wouldpay for access to the light sensors in order to decide when to turn on and off the street lights Gathering temperature, light, pressure, humidity and pollution. COMMERCIAL IOT SENSOR PROVIDER A university may want access to the pollution information for research purposes for a limited period The weather department would want the temperature and pressure data The street town council center would want the temperature and humidity data for planning during rough weather
  • 27.
    BENEFITS OF SENSING-AS-A-SERVICE Harnessing theCreativity Rapid Deployment Sustainable Business Model Assisting Scientific Community
  • 28.
    Smart City Agenda Forcity leaders wanting to pursue a smart city agenda, citizen inclusion is critical
  • 29.
    As citizens turnsmart so will the cities they inhibit. Traffic Volume Maps 76% want sensors in streets, pavements and public areas to report how crowded a street, shopping mall or park is. THE RISE OF SMART CITIZENS
  • 30.
    Building Trust Citizens encountergood customer service across government channels
  • 31.
    SMART CITIZEN TOOLS Opensource and open data Make visible the invisible Sensing the city Provide tools for the citizens to interpret and change the workings of the city Technology may help mitigate the “black hole” problem. EMPOWER THE CITIZENS TO SENSE
  • 32.
  • 33.
    SMARTPHONE AS YOUR“SENSING ASSISTANT” Sensors: ①  Camera – “Eyes” ②  Audio – “Ears” ③  Accelerometer – “Speed” ④  GPS – “Location” ⑤  Gyroscope – “Movement” ⑥  Compass – “Direction” ⑦  Proximity – “Closeness” ⑧  Ambient light – “Eyes” ⑨  Others… Crowdsourcing Via Crowdsensing Context ①  Spatial – Location / Speed Orientation ②  Temporal – Time / Duration ③  Environmental – Temperature / Light / Noise Level ④  User Characterization – Activity (Mobility Pattern) / Social (Friends, Interactions)
  • 34.
    MAKING CITIES BETTERUSING CITIZENS Traffic NoiseEnvironment Network Coverage (WiFi/3G/4G)
  • 35.
    LET ALL CITIZENSBE OUR “EYES”
  • 36.
  • 37.
  • 38.
  • 39.
    DRAINAGE ISSUES –CAUSE OF FLASH FLOOD?
  • 40.
    CORRELATE SEVERAL DATASETS Examples • Relationship between Dengue Cases with drainage issues, mosquito larvae, weather •  Relationship between Leptospirosis (Penyakit Kencing Tikus) with unattended garbage, weather, etc
  • 41.
    MOBILE APPLICATION Open Data Smartphone Users SocialMedia Users PORTAL CITISENSE.COM CASE MANAGEMENT SYSTEM DASHBOARD EMPOWERING SMART CITIZENS
  • 42.
  • 43.
    WHICH CAME FIRST– THE CHICKEN OR THE EGG?
  • 44.
    SMART CITIZENS ANDSENSORS CONNECTING AND AGGREGATING
  • 45.
    Smart City Environmental Monitoring Multiple Sensors Outdoor Parking Management Parkingsensors Mobile Environmental Monitoring Sensors installed in public vehicles Traffic Intensity Monitoring Devices located at main entrance of city Guidance to free parking lots Panels located at intersections Smart Citizen Crowdsensing Parks and Gardens Irrigation Sensors in green zones •  Temperature •  CO •  Noise •  Car Presence •  Ferromagnetic sensors •  Temperature •  CO •  Noise •  Car Presence •  Measure main traffic parameters •  Traffic volumes •  Road occupancy •  Vehicle speed •  Queue Length •  Taking information retrieved by the deployed parking sensors in order to guide drivers towards the available free parking lots •  Moisture temperature •  Humidity •  Pluviometer (rain gauge) •  Anemometer (wind-speed) •  User generated feedback with smartphones that help to make cities better
  • 46.
  • 47.
    PREDICTING FLOOD 1.  Whatis the water level in the river? 2.  When does the river swell up? 3.  Where is the location of water rise? 4.  Where are the areas that require immediate evacuation? 5.  Who is contributing to the rise in water level? 6.  How to control the water level? 7.  How fast is the water rising? 8.  Why is the water rising?
  • 48.
    FLOOD – SENSORS& INFRA 1.  Water level and weather sensors 2.  Tide monitoring sensor 3.  Astronomical data 4.  GPS for rescue vehicles (Plug-n-Play OBD) 5.  GIS data 6.  Camera 7.  Social network integration
  • 49.
    FLOOD MONITORING –VALUE PROPOSITION 1.  Early warning system for floods 2.  Locating the area of violation (cause of floods) 3.  Efficient rescue planning 4.  Plan the widening of the river banks 5.  Plan deepening of the river bed 6.  Predict the conditions of flooding when coupled with a weather station, astronomical, tide and GIS.
  • 50.
  • 51.
    WASTE MANAGEMENT 1.  Whois collecting the garbage? 2.  What is the status of garbage bin? 3.  When was the garbage collected? 4.  Where is the location of full bins? 5.  How to plan the route of the trucks? 6.  How many days till the next collection? 7.  How much garbage is produced in an area? 8.  Why is the garbage truck not picking up garbage? 9.  Why is a particular area producing more garbage?
  • 52.
    WASTE MONITORING –SENSORS & INFRA 1.  Garbage level sensors on garbage bins 2.  GPS on garbage trucks 3.  Network infrastructure (WiFi, 3G)
  • 53.
    WASTE MANAGEMENT –VALUE PROPOSITION •  Timely pickup of full garbage bins •  Efficient routing of the garbage trucks •  Violation of service agreement by the garbage collectors •  Plan for future dumping sites •  Predict the amount of garbage from an area •  Organize awareness programs to promote recycling •  Correlation can be derived to gauge the population in a particular area
  • 54.
    If You Can’tMeasure It, You Can’t Improve It
  • 55.
    THANK YOU @REDtoneIOTREDtoneIOT •  EMAIL:mazlan@gmail.com •  TWITTER: @mazlan_abbas •  FACEBOOK: www.facebook.com/drmazlanabbas •  LINKEDIN: my.linkedin.com/in/mazlan/ •  SLIDESHARE: www.slideshare.net/mazlan1 •  ABOUT ME: about.me/mazlan.abbas