
Recommended
More Related Content
What's hot
What's hot (20)
Similar to Calc. Practice 3 (1º ESO)
Similar to Calc. Practice 3 (1º ESO) (20)
More from jesmope
Recently uploaded
Recently uploaded (20)
Calc. Practice 3 (1º ESO)
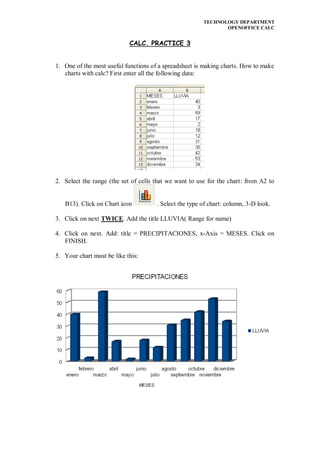
- 1. TECHNOLOGY DEPARTMENT OPENOFFICE CALC CALC. PRACTICE 3 1. One of the most useful functions of a spreadsheet is making charts. How to make charts with calc? First enter all the following data: 2. Select the range (the set of cells that we want to use for the chart: from A2 to B13). Click on Chart icon . Select the type of chart: column, 3-D look. 3. Click on next TWICE. Add the title LLUVIA( Range for name) 4. Click on next. Add: title = PRECIPITACIONES, x-Axis = MESES. Click on FINISH. 5. Your chart must be like this:
- 2. TECHNOLOGY DEPARTMENT OPENOFFICE CALC 6. Create a chart, similar to the previous one, with the following data: 7. Create the next chart: 8. Create a chart, similar to the previous one, with the following data: