Download to read offline
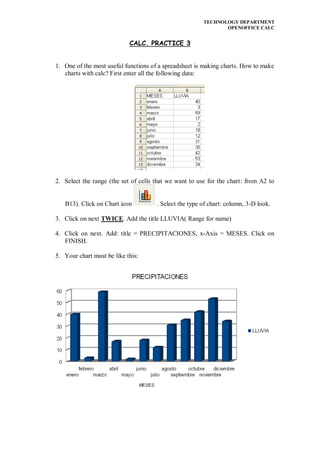
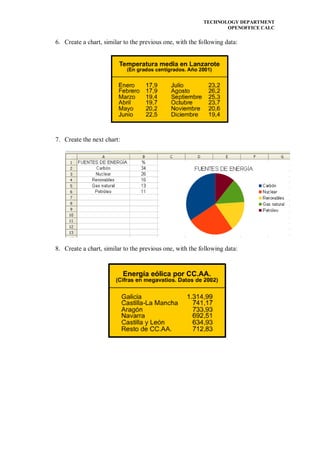
This document provides instructions for creating charts in OpenOffice Calc. It lists the steps to select data ranges, choose chart types such as columns or 3D, add titles for the chart, axes, and ranges. The goal is to create 4 charts with different data sets following the same steps for formatting and labeling each chart.