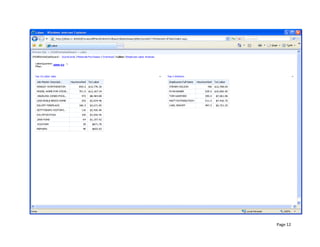
Performance ProjectConstruction Financial DashboardsClass 2008B3John Stires10/31/08Table of Contents TOC \o \"
1-3\"
 \h \z \u II.Overview PAGEREF _Toc243550789 \h 4A.Data Sources Used PAGEREF _Toc243550790 \h 41.Job Master PAGEREF _Toc243550791 \h 42.Overhead PAGEREF _Toc243550792 \h 43.Materials PAGEREF _Toc243550793 \h 44.Labor PAGEREF _Toc243550794 \h 4III.Page 1:  Overhead Quarters PAGEREF _Toc243550795 \h 5A.Use JobTotal/AllJobs for JOBFinancials PAGEREF _Toc243550796 \h 5B.Chart Format PAGEREF _Toc243550797 \h 5C.Left Scoreboard PAGEREF _Toc243550798 \h 51.Filter(s) PAGEREF _Toc243550799 \h 52.KPIs PAGEREF _Toc243550800 \h 5D.Right Scoreboard PAGEREF _Toc243550801 \h 51.Use the Master cube PAGEREF _Toc243550802 \h 52.KPIs PAGEREF _Toc243550803 \h 5E.Background PAGEREF _Toc243550804 \h 5IV.Page 2:  Purchase Breakdown by Client PAGEREF _Toc243550805 \h 7A.Use the Materials cube PAGEREF _Toc243550806 \h 7B.Chart Format PAGEREF _Toc243550807 \h 7C.Filter(s) PAGEREF _Toc243550808 \h 7D.Background PAGEREF _Toc243550809 \h 7V.Page 3:  Overhead Cost by Category by Quarter PAGEREF _Toc243550810 \h 9A.Use the Overhead cube PAGEREF _Toc243550811 \h 9B.Chart Format PAGEREF _Toc243550812 \h 9C.Filter(s) PAGEREF _Toc243550813 \h 9D.Background PAGEREF _Toc243550814 \h 9VI.Page 4:  Top Labor By Quarter PAGEREF _Toc243550815 \h 11A.Cube PAGEREF _Toc243550816 \h 11B.Chart Format PAGEREF _Toc243550817 \h 11C.Filter(s) PAGEREF _Toc243550818 \h 11D.MDX PAGEREF _Toc243550819 \h 111.Modify the MDX to create a TOPCOUNT PAGEREF _Toc243550820 \h 112.Base the TOPCOUNT on the LaborQuarters filter. PAGEREF _Toc243550821 \h 11E.Background PAGEREF _Toc243550822 \h 11VII.Page 5:  Employee Labor Analysis PAGEREF _Toc243550823 \h 13A.Displayed Data PAGEREF _Toc243550824 \h 13B.Chart Format PAGEREF _Toc243550825 \h 131.Table PAGEREF _Toc243550826 \h 132.Bar Chart Total labor by quarter PAGEREF _Toc243550827 \h 133.Line Graph Employee’s percent of the total labor per quarter. PAGEREF _Toc243550828 \h 13OverviewIn this project, a 5-page dashboard will be created showing construction overhead information.  Obtain the data for these pages from the database SetFocusAllWorksAnalysis OLAP database on thesfbisrv1 server.  Four data sources will required for each of four cubes:Data Sources UsedJob MasterOverheadMaterialsLaborPage 1:  Overhead QuartersUse JobTotal/AllJobs for JOBFinancialsShow Client/Job total and children rows.  Chart FormatChart format will be percentages and KPIs.Left ScoreboardUse the Overhead cube Utilize the named sets:  OverheadTotal and AllOverHeads.  (Show Overhead Total and the overhead children.)Filter(s)Create a filter on quarters using the named set OverheadQuarters from the Overhead cube.  Apply only to the left scoreboard.KPIsKPIoverheadTrendRight ScoreboardUse the Master cubeUtilize the named sets:  ClientTotal/AllClients for Client Financials (you can use the named set ClientsOpenReceivables as a filtered named set for the list of clients under open receivables KPI)KPIsKPIopenReceivables/asPctOfInvoicedKPIOverheadAsPctOfOTotalCostBackgroundNone specified.Page 2:  Purchase Breakdown by ClientChart Material Purchase Amount and Material Purchase Type Description by quarter.Use the Materials cubeChart can be run for a single client, or an all client total.Chart FormatChart format will be a bar chart.Filter(s)Create a filter on Clients using the named set ClientsPlusAll from the Master cubeBackgroundSet the chart background based on the Client Name, and to the Client Filter.Page 3:  Overhead Cost by Category by QuarterChart the overhead dollar amount and overhead category description, by quarter.Use the Overhead cubeChart may be run for multiple overhead categories.Chart FormatChart format will be a line graph.Filter(s)Create a filter on Overhead description, using the names set AllOverheads from the Overhead cube.BackgroundNo background for the chart.  Need to link explicitly on the overhead categories (specified in the line chart).Page 4:  Top Labor By QuarterChart the top 10 jobs by labor dollars, and the top 5 employees by labor dollars, by quarter.CubeUse the Labor cubeChart FormatChart format will display hours and dollars for the respective job and employee.Filter(s)Create a filter on Labor Quarters using the named set LaborQuarters from the Labor cubeMDXModify the MDX to create a TOPCOUNTBase the TOPCOUNT on the LaborQuarters filter.BackgroundNone specified.Page 5:  Employee Labor AnalysisShow an employee’s labor dollars by quarter, along with the percentage of labor for the jobs the employee worked on.Displayed DataShow that employee’s labor dollars by quarter, along with the percentage of labor for the jobs the employee worked on.  For example, in the 3rd quarter, if the employee had $00 in labor dollars, and the total labor dollars for jobs that he worked on was $400 for that quarter, the % would be 25%.Chart FormatTableEach job the employee worked on.Total labor for the job.The employee’s labor contribution, The employee % labor of the total for that job.Bar ChartTotal labor by quarterLine GraphEmployee’s percent of the total labor per quarter.
Performance Project Portfolio

Performance Project Portfolio

  • 1.
    Performance ProjectConstruction FinancialDashboardsClass 2008B3John Stires10/31/08Table of Contents TOC \o \" 1-3\" \h \z \u II.Overview PAGEREF _Toc243550789 \h 4A.Data Sources Used PAGEREF _Toc243550790 \h 41.Job Master PAGEREF _Toc243550791 \h 42.Overhead PAGEREF _Toc243550792 \h 43.Materials PAGEREF _Toc243550793 \h 44.Labor PAGEREF _Toc243550794 \h 4III.Page 1: Overhead Quarters PAGEREF _Toc243550795 \h 5A.Use JobTotal/AllJobs for JOBFinancials PAGEREF _Toc243550796 \h 5B.Chart Format PAGEREF _Toc243550797 \h 5C.Left Scoreboard PAGEREF _Toc243550798 \h 51.Filter(s) PAGEREF _Toc243550799 \h 52.KPIs PAGEREF _Toc243550800 \h 5D.Right Scoreboard PAGEREF _Toc243550801 \h 51.Use the Master cube PAGEREF _Toc243550802 \h 52.KPIs PAGEREF _Toc243550803 \h 5E.Background PAGEREF _Toc243550804 \h 5IV.Page 2: Purchase Breakdown by Client PAGEREF _Toc243550805 \h 7A.Use the Materials cube PAGEREF _Toc243550806 \h 7B.Chart Format PAGEREF _Toc243550807 \h 7C.Filter(s) PAGEREF _Toc243550808 \h 7D.Background PAGEREF _Toc243550809 \h 7V.Page 3: Overhead Cost by Category by Quarter PAGEREF _Toc243550810 \h 9A.Use the Overhead cube PAGEREF _Toc243550811 \h 9B.Chart Format PAGEREF _Toc243550812 \h 9C.Filter(s) PAGEREF _Toc243550813 \h 9D.Background PAGEREF _Toc243550814 \h 9VI.Page 4: Top Labor By Quarter PAGEREF _Toc243550815 \h 11A.Cube PAGEREF _Toc243550816 \h 11B.Chart Format PAGEREF _Toc243550817 \h 11C.Filter(s) PAGEREF _Toc243550818 \h 11D.MDX PAGEREF _Toc243550819 \h 111.Modify the MDX to create a TOPCOUNT PAGEREF _Toc243550820 \h 112.Base the TOPCOUNT on the LaborQuarters filter. PAGEREF _Toc243550821 \h 11E.Background PAGEREF _Toc243550822 \h 11VII.Page 5: Employee Labor Analysis PAGEREF _Toc243550823 \h 13A.Displayed Data PAGEREF _Toc243550824 \h 13B.Chart Format PAGEREF _Toc243550825 \h 131.Table PAGEREF _Toc243550826 \h 132.Bar Chart Total labor by quarter PAGEREF _Toc243550827 \h 133.Line Graph Employee’s percent of the total labor per quarter. PAGEREF _Toc243550828 \h 13OverviewIn this project, a 5-page dashboard will be created showing construction overhead information. Obtain the data for these pages from the database SetFocusAllWorksAnalysis OLAP database on thesfbisrv1 server. Four data sources will required for each of four cubes:Data Sources UsedJob MasterOverheadMaterialsLaborPage 1: Overhead QuartersUse JobTotal/AllJobs for JOBFinancialsShow Client/Job total and children rows. Chart FormatChart format will be percentages and KPIs.Left ScoreboardUse the Overhead cube Utilize the named sets: OverheadTotal and AllOverHeads. (Show Overhead Total and the overhead children.)Filter(s)Create a filter on quarters using the named set OverheadQuarters from the Overhead cube. Apply only to the left scoreboard.KPIsKPIoverheadTrendRight ScoreboardUse the Master cubeUtilize the named sets: ClientTotal/AllClients for Client Financials (you can use the named set ClientsOpenReceivables as a filtered named set for the list of clients under open receivables KPI)KPIsKPIopenReceivables/asPctOfInvoicedKPIOverheadAsPctOfOTotalCostBackgroundNone specified.Page 2: Purchase Breakdown by ClientChart Material Purchase Amount and Material Purchase Type Description by quarter.Use the Materials cubeChart can be run for a single client, or an all client total.Chart FormatChart format will be a bar chart.Filter(s)Create a filter on Clients using the named set ClientsPlusAll from the Master cubeBackgroundSet the chart background based on the Client Name, and to the Client Filter.Page 3: Overhead Cost by Category by QuarterChart the overhead dollar amount and overhead category description, by quarter.Use the Overhead cubeChart may be run for multiple overhead categories.Chart FormatChart format will be a line graph.Filter(s)Create a filter on Overhead description, using the names set AllOverheads from the Overhead cube.BackgroundNo background for the chart. Need to link explicitly on the overhead categories (specified in the line chart).Page 4: Top Labor By QuarterChart the top 10 jobs by labor dollars, and the top 5 employees by labor dollars, by quarter.CubeUse the Labor cubeChart FormatChart format will display hours and dollars for the respective job and employee.Filter(s)Create a filter on Labor Quarters using the named set LaborQuarters from the Labor cubeMDXModify the MDX to create a TOPCOUNTBase the TOPCOUNT on the LaborQuarters filter.BackgroundNone specified.Page 5: Employee Labor AnalysisShow an employee’s labor dollars by quarter, along with the percentage of labor for the jobs the employee worked on.Displayed DataShow that employee’s labor dollars by quarter, along with the percentage of labor for the jobs the employee worked on. For example, in the 3rd quarter, if the employee had $00 in labor dollars, and the total labor dollars for jobs that he worked on was $400 for that quarter, the % would be 25%.Chart FormatTableEach job the employee worked on.Total labor for the job.The employee’s labor contribution, The employee % labor of the total for that job.Bar ChartTotal labor by quarterLine GraphEmployee’s percent of the total labor per quarter.