1. 25th Nov’14 Currency Highlights
USDINR
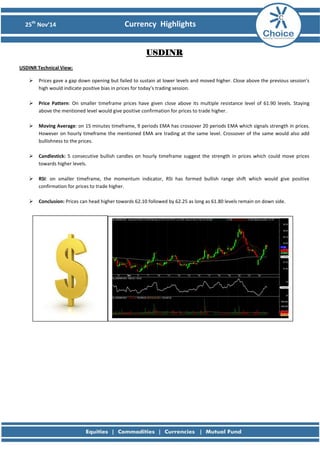
USDINR Technical View:
Prices gave a gap down opening but failed to sustain at lower levels and moved higher. Close above the previous session’s high would indicate positive bias in prices for today’s trading session.
Price Pattern: On smaller timeframe prices have given close above its multiple resistance level of 61.90 levels. Staying above the mentioned level would give positive confirmation for prices to trade higher.
Moving Average: on 15 minutes timeframe, 9 periods EMA has crossover 20 periods EMA which signals strength in prices. However on hourly timeframe the mentioned EMA are trading at the same level. Crossover of the same would also add bullishness to the prices.
Candlestick: 5 consecutive bullish candles on hourly timeframe suggest the strength in prices which could move prices towards higher levels.
RSI: on smaller timeframe, the momentum indicator, RSI has formed bullish range shift which would give positive confirmation for prices to trade higher.
Conclusion: Prices can head higher towards 62.10 followed by 62.25 as long as 61.80 levels remain on down side.
2. 25th Nov’14 Currency Highlights
Economic Indicators Date Time Data Prior Expected Impact
25.11.14
7:00 PM Prelim GDP q/q 3.5%
3.3%
Actual > Expected=Good for USD
25.11.14
7:00 PM Prelim GDP Price Index q/q 1.3%
1.3%
Actual > Expected=Good for USD
25.11.14
7.30 PM HPI m/m 0.5%
0.5%
Actual > Expected=Good for USD
25.11.14
7.30 PM S&P/CS Composite-20 HPI y/y 5.6%
4.7%
Actual > Expected=Good for USD
25.11.14
8.30 PM CB Consumer Confidence 94.5
95.9
Actual > Expected=Good for USD
25.11.14
8.30 PM Richmond Manufacturing Index 20
17
Actual > Expected=Good for USD
3. 25th Nov’14 Currency Highlights
EURINR
EURINR Technical View:
Prices gave a gap down opening but failed to sustain at lower levels and inched higher which could be the pullback of the impulsive down move from 78.15 – 76.45 levels.
Price Pattern: Prices have taken support near the previous intermediate low of 76.35 levels and inched higher. Currently prices are trading in correction of the previous down move which could inch prices towards 77.10-77.15 levels which can be considered as a selling opportunity to test lower levels.
MACD: MACD signals weakness as it is below zero level.
RSI: The momentum indicator, RSI on hourly as well as on daily timeframe below 40 levels which suggest lack of momentum in prices.
Conclusion: For now we expect prices could inch higher near 77.10-77.15 levels which can be used as selling opportunity for the test of 76.60 levels.
Economic Indicators Date Time Data Prior Expected Impact
25.11.14
12.30 PM German Final GDP q/q
0.1%
0.1%
Actual > Expected=Good for EUR
25.11.14
2.30 PM Italian Retail Sales m/m
-0.1%
0.2%
Actual > Expected=Good for EUR
4. 25th Nov’14 Currency Highlights
GBPINR
GBPINR Technical View:
Prices have taken support near the previous intermediate low of 96.53 and moved higher.
Retracement: Prices are trading near the 61.8% retracement level of the previous down move from 97.65 – 96.53 levels which could be act as a resistance for prices to move lower.
Moving Average: Prices are trading below both the moving averages i.e. 20 periods EMA and 9 period EMA suggesting weakness in prices.
MACD: MACD is below zero level which gives negative confirmation while rallies can be used as selling opportunity.
RSI: On daily timeframe the momentum indicator, RSI is below 40 levels which indicates lack of momentum in prices..
Conclusion: Downtrend is still intact which could drift prices towards 96.65 levels as prices are trading near the crucial resistance level which is also the 61.8% retracement level of the previous down move.
Economic Indicators Date Time Data Prior Expected Impact
25.11.14
3:00 PM BBA Mortgage Approvals
39.3K
38.5K
Actual > Expected=Good for GBP
25.11.14
3:30 PM Inflation Report Hearings
More hawkish = Good for GBP
5. 25th Nov’14 Currency Highlights
JPYINR
JPYINR Technical View:
Oversold momentum indicator hints pullback rally.
Price Pattern: JPYINR price pattern continues to remain in a strong bearish pattern as the prices are making new lows every day. There is no sign of reversal and sell on rise will be the strategy for the pair.
Moving Average: both the averages are trading above the prices which indicate weakness In the prices.
MACD: MACD indicator continues its sell signal and the signal also remains valid as the pair is in major downtrend.
RSI: On daily timeframe the momentum indicator, RSI is oversold which suggest pullback rally can be expected which could be again used as selling opportunity to move lower.
Economic Indicators Date Time Data Prior Expected Impact
25.11.14
5.20 AM Monetary Policy Meeting Minutes
More hawkish = Good for GBP
25.11.14
5.20 AM SPPI y/y
3.5%
3.6%
Actual > Expected=Good for JPY
25.11.14
6.30 AM BOJ Gov Kuroda Speaks
More hawkish = Good for GBP
7. 25th Nov’14 Currency Highlights
Disclaimer
This is solely for information of clients of Choice Broking and does not construe to be an investment advice. It is also not intended as an offer or solicitation for the purchase and sale of any financial instruments. Any action taken by you on the basis of the information contained herein is your responsibility alone and Choice Broking its subsidiaries or its employees or associates will not be liable in any manner for the consequences of such action taken by you. We have exercised due diligence in checking the correctness and authenticity of the information contained in this recommendation, but Choice Broking or any of its subsidiaries or associates or employees shall not be in any way responsible for any loss or damage that may arise to any person from any inadvertent error in the information contained in this recommendation or any action taken on basis of this information. Technical analysis studies market psychology, price patterns and volume levels. It is used to forecast future price and market movements. Technical analysis is complementary to fundamental analysis and news sources. The recommendations issued here with might be contrary to recommendations issued by Choice Broking in the company research undertaken as the recommendations stated in this report is derived purely from technical analysis. Choice Broking has based this document on information obtained from sources it believes to be reliable but which it has not independently verified; Choice Broking makes no guarantee, representation or warranty and accepts no responsibility or liability as to its accuracy or completeness. The opinions contained within the report are based upon publicly available information at the time of publication and are subject to change without notice. The information and any disclosures provided herein are in summary form and have been prepared for informational purposes. The recommendations and suggested price levels are intended purely for trading purposes. The recommendations are valid for the day of the report however trading trends and volumes might vary substantially on an intraday basis and the recommendations may be subject to change. The information and any disclosures provided herein may be considered confidential. Any use, distribution, modification, copying, forwarding or disclosure by any person is strictly prohibited. The information and any disclosures provided herein do not constitute a solicitation or offer to purchase or sell any security or other financial product or instrument. The current performance may be unaudited. Past performance does not guarantee future returns. There can be no assurance that investments will achieve any targeted rates of return, and there is no guarantee against the loss of your entire investment.
POTENTIAL CONFLICT OF INTEREST DISCLOSURE (as on date of report) Disclosure of interest statement – • Analyst interest of the stock /Instrument(s): - No. • Firm interest of the stock / Instrument (s): - No.