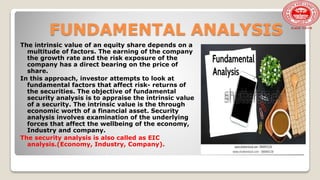
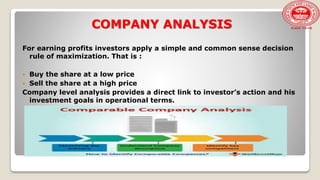
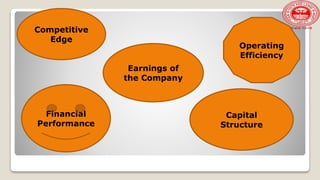
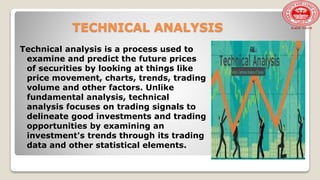
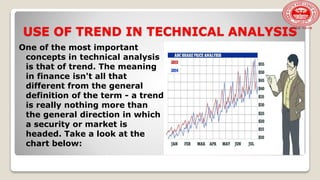
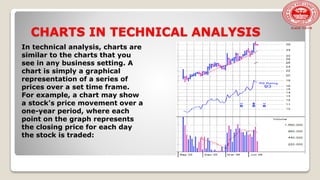
SlideShare a Scribd company logo
1 of 29
PRESENTATION
ON
FUNDAMENTAL
AND TECHNICAL
ANALYSIS
Submitted to:- Submitted by:-
Ms. Priya Rana Neha Saini
Class:- M.com(IT)-3rd sem.
Roll No.:- 3251720002
Sanatan Dharma College
Ambala Cantt
FUNDAMENTAL ANALYSIS
The intrinsic value of an equity share depends on a
multitude of factors. The earning of the company
the growth rate and the risk exposure of the
company has a direct bearing on the price of
share.
In this approach, investor attempts to look at
fundamental factors that affect risk- returns of
the securities. The objective of fundamental
security analysis is to appraise the intrinsic value
of a security. The intrinsic value is the through
economic worth of a financial asset. Security
analysis involves examination of the underlying
forces that affect the wellbeing of the economy,
Industry and company.
The security analysis is also called as EIC
analysis.(Economy, Industry, Company).
Levels of Fundamental Analysis
ECONOMIC ANALYSIS
The analysis of the state of the economy incorporates the performance of
the economy in the past, how it is performing in the present and how it is
expected to perform in future. Based on economic changes that affect the
risk and return on investments.
1) Gross Domestic product:- GDP indicates the rate of growth of the
economy. GDP represents aggregate value of consumption of goods
and services produced in the economy.
Higher GDP is More favorable to the stock market.
Lower GDP is Not favorable to the stock market.
2) Savings and investment:-
If the savings of the individuals will increase there are more
commitments from them to investment.
3) Inflation:-
Because of the inflation the demand for the product will effect.
Because inflation effects buyers purchasing power. The real rate of
growth is very small. Demand for product is decreases. It affects the
company profitability position.
4) Interest Rate:-
If the interest rate is higher, then it is very difficult to any company to
raise funds. Then it leads effects the profitability position of company
vice versa. If the interest rates are the credit availability to consumers
are low, the sales of the products are reduced.
5) Budget:-
 Elaborate account of government expenditure and revenues.
 Deficit budget when high Inflation because of increased Cost of
production.
 Surplus budget when Deflation in the economy.
 Balanced budget is favorable to the stock market.
6) Tax Structure:-
 Every year in march the business community eagerly awaits the
government announcement recording the tax policy.
 Concessions and incentives given to a certain industry encourage
investment in that particular industry.
 Tax relives leads more savings, then the company’s profitability
position will increase.
7) Balance of payments:-
The balance of payment = “Total receipts – Total payments”
8) Monsoon and Agriculture:-
 Agriculture is directly/indirectly linked
with some industries. Ex: sugar industries,
cotton industries, food industries etc.
9) Infrastructure Facilities:-
 I.F is essential for the growth of industries
and agriculture sector, a wide network of
common system is must for development of
economy.
 The regular power supply will be
considered as boost to the production.
 A good I.F is considered as favorable to the
stock market.
10) Demographic factors:-
 Demographic data provides details about
the population by age, occupation etc.
 It affects industrial growth and stock
market.
INDUSTRY ANALYSIS
After conducting an analysis of the economy and identifying the direction
it is likely to take into short interim and long term, the analyst must
look into various sectors of the economy in terms various industries.
Industry is a group of companies, which have similar technological
structure of production and produce similar products. Industry analysis
can also be useful in knowing the investment – worthiness of a firm.
Classification of Industries
1) classification by reporting agencies
2) classification by business cycle
3) Industry groups
1) Classification by reporting agencies: According to RBI has industries into
32 groups, stock exchange 10 group, business media have their own
classification.
2) Classification by business cycle:
 Growth industries: These industries grow consistently and its growth may
exceed the average growth of the economy.
 Cyclical Industries: These industries mostly likely the benefits from a
period of economic prosperity and most likely suffers from economic
recession.
 Defensive Industries: These industries specify the movement of the
business cycle. Defensive industries often contain firms whose securities
on investor might hold for income. Food and shelter are the basic
requirements of humanity.
 Cyclical Growth Industries: These industrial pass both characteristics of
cyclical growth industries. Ex: Automobile industries, because these
industry experiences period of stagnation.
3) Group of industries:
Small
scale
Up to 30
lakhs
Medium
scale
Rs.5 cr
and
above
Large
scale
Rs.10 cr
and
above
COMPANY ANALYSIS
For earning profits investors apply a simple and common sense decision
rule of maximization. That is :
 Buy the share at a low price
 Sell the share at a high price
Company level analysis provides a direct link to investor’s action and his
investment goals in operational terms.
Competitive
Edge
Earnings of
the Company
Capital
Structure
Financial
Performance
Operating
Efficiency
TECHNICAL ANALYSIS
Technical analysis is a process used to
examine and predict the future prices
of securities by looking at things like
price movement, charts, trends, trading
volume and other factors. Unlike
fundamental analysis, technical
analysis focuses on trading signals to
delineate good investments and trading
opportunities by examining an
investment's trends through its trading
data and other statistical elements.
Assumptions:-
 The market value of the scrip is
determined by die interaction of
supply and demand.
 The market discounts
everything.
 Price moves in trends.
 History tends to repeat itself.
USE OF TREND IN TECHNICAL ANALYSIS
One of the most important
concepts in technical analysis
is that of trend. The meaning
in finance isn't all that
different from the general
definition of the term - a trend
is really nothing more than
the general direction in which
a security or market is
headed. Take a look at the
chart below:
Types of Trends:
Types of Trend There are three types of trend: Up trends
Downtrends Sideways/Horizontal Trends
Uptrend
 It is the trend when financial markets and assets move in
upward directions, resulting in an increase in the price. It is
usually the time of boom in the economy, where overall
sentiments are favorable.
Downtrend
 In the downtrend or the bear market, the economy,
financial markets, and assets prices move in the downward
direction. It is the time when companies shrink operations
and overall investor sentiment is not favorable.
Sideways / horizontal Trend
 In this, the assets prices or the broader economy-level are
not moving in any direction, rather are moving sideways.
This means, moving up for some time and then down on the
same level. It is a risky movement as investors are unsure
of what will happen to their investment.
CHARTS IN TECHNICAL ANALYSIS
In technical analysis, charts are
similar to the charts that you
see in any business setting. A
chart is simply a graphical
representation of a series of
prices over a set time frame.
For example, a chart may show
a stock's price movement over a
one-year period, where each
point on the graph represents
the closing price for each day
the stock is traded:
Chart Types:
There are four main types of charts that are used by
investors and traders depending on the information that
they are seeking and their individual skill levels. The chart
types are: the line chart, the bar chart, the candlestick chart
and the point and figure chart.
Line Chart: The most basic of the four charts is the line chart
because it represents only the closing prices over a set
period of time. The line is formed by connecting the closing
prices over the time frame. Line charts do not provide visual
information of the trading range for the individual points
such as the high, low and opening prices. However, the
closing price is often considered to be the most important
price in stock data compared to the high and low for the day
and this is why it is the only value used in line charts.
Bar Chart:
The bar chart expands on the line chart by adding
several more key pieces of information to each
data point. The chart is made up of a series of
vertical lines that represent each data point. This
vertical line represents the high and low for the
trading period, along with the closing price. The
close and open are represented on the vertical
line by a horizontal dash. The opening price on a
bar chart is illustrated by the dash that is located
on the left side of the vertical bar. Conversely, the
close is represented by the dash on the right.
Generally, if the left dash (open) is lower than the
right dash (close) then the bar will be shaded
black, representing an up period for the stock,
which means it has gained value. A bar that is
colored red signals that the stock has gone down
in value over that period. When this is the case,
the dash on the right (close) is lower than the
dash on the left (open).
Candlestick Charts:
The candlestick chart is similar to a
bar chart, but it differs in the way
that it is visually constructed. Similar
to the bar chart, the candlestick also
has a thin vertical line showing the
period's trading range. The
difference comes in the formation of
a wide bar on the vertical line, which
illustrates the difference between the
open and close. And, like bar charts,
candlesticks also rely heavily on the
use of colors to explain what has
happened during the trading period.
Volume
Volume is simply the number of
shares or contracts that trade over
a given period of time, usually a
day. The higher the volume, the
more active the security. To
determine the movement of the
volume (up or down), chartists look
at the volume bars that can usually
be found at the bottom of any
chart. Volume bars illustrate how
many shares have traded per
period and show trends in the same
way that prices do.
Dow Theory
The Dow theory is a financial theory
that says the market is in an upward
trend if one of its averages
(i.e. industrials or transportation)
advances above a previous important
high and is accompanied or followed
by a similar advance in the other
average. For example, if the Dow
Jones Industrial Average (DJIA)
climbs to an intermediate high, the
Dow Jones Transportation Average
(DJTA) is expected to follow suit
within a reasonable period of time.
The Dow Theory is an approach to trading
developed by Charles H. Dow who, with
Edward Jones and Charles Bergstresser,
founded Dow Jones & Company, Inc. and
developed the Dow Jones Industrial Average
(DJIA). Dow fleshed out the theory in a series
of editorials in the Wall Street Journal, which
he co-founded. Before we can get into the
specifics of Dow theory trend analysis, we
need to understand trends. First, it's
important to note that while the market tends
to move in a general direction, or trend, it
doesn't do so in a straight line. The market
will rally up to a high (peak) and then sell off
to a low (trough), but will generally move in
one direction. (For related reading, see Peak-
and-Trough Analysis.)
Trends in Dow Theory
a) Primary Trend: In Dow theory, the
primary trend is the major trend of the
market, which makes it the most
important one to determine. This is
because the overriding trend is the one
that affects the movements in stock
prices. The primary trend will also
impact the secondary and minor trends
within the market. (For related reading,
see Short-, Intermediate- and Long-
Term Trends.) Dow determined that a
primary trend will generally last
between one and three years but could
vary in some instances.
b) Secondary, or Intermediate: Trend In
Dow theory, a primary trend is the main
direction in which the market is moving.
Conversely, a secondary trend moves in
the opposite direction of the primary
trend, or as a correction to the primary
trend. For example, an upward primary
trend will be composed of secondary
downward trends. This is the movement
from a consecutively higher high to a
consecutively lower high. In a primary
downward trend the secondary trend
will be an upward move, or a rally. This
is the movement from a consecutively
lower low to a consecutively higher low.
c) Minor Trend:
The last of the three trend types in Dow theory is the
minor trend, which is defined as a market movement
lasting less than three weeks. The minor trend is
generally the corrective moves within a secondary move,
or those moves that go against the direction of the
secondary trend. Due to its short-term nature and the
longer-term focus of Dow theory, the minor trend is not
of major concern to Dow theory followers. But this
doesn't mean it is completely irrelevant; the minor trend
is watched with the large picture in mind, as these short-
term price movements are a part of both the primary and
secondary trends. Most proponents of Dow theory focus
their attention on the primary and secondary trends, as
minor trends tend to include a considerable amount of
noise. If too much focus is placed on minor trends, it can
to lead to irrational trading, as traders get distracted by
short-term volatility and lose sight of the bigger picture.
Stated simply, the greater the time period a trend
comprises, the more important the trend.
Sanatan Dharma College
Ambala Cantt

More Related Content

What's hot

What's hot (20)

Technical Analysis
Technical AnalysisTechnical Analysis
Technical Analysis
 
Dow theory
Dow theoryDow theory
Dow theory
 
Technical Analysis By Pantej
Technical Analysis By PantejTechnical Analysis By Pantej
Technical Analysis By Pantej
 
Trend Reversal Patterns
Trend Reversal PatternsTrend Reversal Patterns
Trend Reversal Patterns
 
Technical analysis doc
Technical analysis doc Technical analysis doc
Technical analysis doc
 
Dow Theory and Elliott Wave Theory
Dow Theory and Elliott Wave TheoryDow Theory and Elliott Wave Theory
Dow Theory and Elliott Wave Theory
 
Technical analysis
Technical analysisTechnical analysis
Technical analysis
 
Technical Analysis
Technical AnalysisTechnical Analysis
Technical Analysis
 
SAPM - Technical analysis
SAPM - Technical analysisSAPM - Technical analysis
SAPM - Technical analysis
 
Technical analysis
Technical analysisTechnical analysis
Technical analysis
 
Portfolio - Technical Analysis
Portfolio - Technical Analysis Portfolio - Technical Analysis
Portfolio - Technical Analysis
 
Basic Technical Analysis
Basic Technical AnalysisBasic Technical Analysis
Basic Technical Analysis
 
Technical Analysis
Technical AnalysisTechnical Analysis
Technical Analysis
 
Chapter 17 technical analysis
Chapter 17 technical analysisChapter 17 technical analysis
Chapter 17 technical analysis
 
Module 1 - Technical Analysis and the Dow Theory
Module 1 - Technical Analysis  and the Dow TheoryModule 1 - Technical Analysis  and the Dow Theory
Module 1 - Technical Analysis and the Dow Theory
 
Moving average and Rate of change (ROC)
Moving average and Rate of change (ROC)Moving average and Rate of change (ROC)
Moving average and Rate of change (ROC)
 
Bhavishya- Technical Analysis
Bhavishya- Technical AnalysisBhavishya- Technical Analysis
Bhavishya- Technical Analysis
 
Technical Analysis Of Stock Market
Technical Analysis Of Stock MarketTechnical Analysis Of Stock Market
Technical Analysis Of Stock Market
 
Technical analysis
Technical analysisTechnical analysis
Technical analysis
 
Japanese Candlestick
Japanese CandlestickJapanese Candlestick
Japanese Candlestick
 

Similar to Ppt of security analysis 2

Fundamental and Technical Analysis
Fundamental and Technical AnalysisFundamental and Technical Analysis
Fundamental and Technical AnalysisNeerajSingh725
 
fundamental and technical analysis of banking sector in india
fundamental and technical analysis of banking sector in indiafundamental and technical analysis of banking sector in india
fundamental and technical analysis of banking sector in indiaKarthik Ezil
 
Investment Analysis
Investment Analysis Investment Analysis
Investment Analysis Nina Haku
 
Fundamental and Technical Analysis
Fundamental and Technical AnalysisFundamental and Technical Analysis
Fundamental and Technical AnalysisMACFAST
 
Technical Analysis Project
Technical Analysis ProjectTechnical Analysis Project
Technical Analysis ProjectRahul Prajapati
 
Fundamental, Economic and Industry Analysis
Fundamental, Economic and Industry AnalysisFundamental, Economic and Industry Analysis
Fundamental, Economic and Industry AnalysisRajaKrishnan M
 
Movement of Share Prices and Sectoral Analysis: A Reflection Through Interact...
Movement of Share Prices and Sectoral Analysis: A Reflection Through Interact...Movement of Share Prices and Sectoral Analysis: A Reflection Through Interact...
Movement of Share Prices and Sectoral Analysis: A Reflection Through Interact...Waqas Tariq
 
Technical analysis
Technical analysisTechnical analysis
Technical analysisSalim Ansari
 
A fundamental study on Technical Analysis
A fundamental study on Technical AnalysisA fundamental study on Technical Analysis
A fundamental study on Technical AnalysisJay Sadhwani
 
Fundamental analysis hard copy
Fundamental analysis hard copyFundamental analysis hard copy
Fundamental analysis hard copyDharmik
 
Abdul+Rahim+wong+1st+year+phd+thesis.docx.pdf
Abdul+Rahim+wong+1st+year+phd+thesis.docx.pdfAbdul+Rahim+wong+1st+year+phd+thesis.docx.pdf
Abdul+Rahim+wong+1st+year+phd+thesis.docx.pdfdrwong3
 
Abdul+Rahim+wong+1st+year+phd+thesis.docx.pdf
Abdul+Rahim+wong+1st+year+phd+thesis.docx.pdfAbdul+Rahim+wong+1st+year+phd+thesis.docx.pdf
Abdul+Rahim+wong+1st+year+phd+thesis.docx.pdfdrwong3
 
Abdul Rahim wong 1st year phd thesis.docx
Abdul Rahim wong 1st year phd thesis.docxAbdul Rahim wong 1st year phd thesis.docx
Abdul Rahim wong 1st year phd thesis.docxdrwong3
 
Use of vectors in financial graphs
Use of vectors in financial graphsUse of vectors in financial graphs
Use of vectors in financial graphsdrwong3
 

Similar to Ppt of security analysis 2 (20)

Fundamental and Technical Analysis
Fundamental and Technical AnalysisFundamental and Technical Analysis
Fundamental and Technical Analysis
 
fundamental and technical analysis of banking sector in india
fundamental and technical analysis of banking sector in indiafundamental and technical analysis of banking sector in india
fundamental and technical analysis of banking sector in india
 
Investment Analysis
Investment Analysis Investment Analysis
Investment Analysis
 
Fundamental and Technical Analysis
Fundamental and Technical AnalysisFundamental and Technical Analysis
Fundamental and Technical Analysis
 
Technical Analysis Project
Technical Analysis ProjectTechnical Analysis Project
Technical Analysis Project
 
Investment 1
Investment 1Investment 1
Investment 1
 
Fundamental, Economic and Industry Analysis
Fundamental, Economic and Industry AnalysisFundamental, Economic and Industry Analysis
Fundamental, Economic and Industry Analysis
 
Module 3.pptx
Module 3.pptxModule 3.pptx
Module 3.pptx
 
Movement of Share Prices and Sectoral Analysis: A Reflection Through Interact...
Movement of Share Prices and Sectoral Analysis: A Reflection Through Interact...Movement of Share Prices and Sectoral Analysis: A Reflection Through Interact...
Movement of Share Prices and Sectoral Analysis: A Reflection Through Interact...
 
Technical analysis
Technical analysisTechnical analysis
Technical analysis
 
Technical Analysis
Technical AnalysisTechnical Analysis
Technical Analysis
 
A fundamental study on Technical Analysis
A fundamental study on Technical AnalysisA fundamental study on Technical Analysis
A fundamental study on Technical Analysis
 
4th chapter
4th chapter4th chapter
4th chapter
 
Ii technical analysis
Ii technical analysisIi technical analysis
Ii technical analysis
 
Fundamental analysis hard copy
Fundamental analysis hard copyFundamental analysis hard copy
Fundamental analysis hard copy
 
SECURITY ANALYSIS
SECURITY ANALYSISSECURITY ANALYSIS
SECURITY ANALYSIS
 
Abdul+Rahim+wong+1st+year+phd+thesis.docx.pdf
Abdul+Rahim+wong+1st+year+phd+thesis.docx.pdfAbdul+Rahim+wong+1st+year+phd+thesis.docx.pdf
Abdul+Rahim+wong+1st+year+phd+thesis.docx.pdf
 
Abdul+Rahim+wong+1st+year+phd+thesis.docx.pdf
Abdul+Rahim+wong+1st+year+phd+thesis.docx.pdfAbdul+Rahim+wong+1st+year+phd+thesis.docx.pdf
Abdul+Rahim+wong+1st+year+phd+thesis.docx.pdf
 
Abdul Rahim wong 1st year phd thesis.docx
Abdul Rahim wong 1st year phd thesis.docxAbdul Rahim wong 1st year phd thesis.docx
Abdul Rahim wong 1st year phd thesis.docx
 
Use of vectors in financial graphs
Use of vectors in financial graphsUse of vectors in financial graphs
Use of vectors in financial graphs
 

Recently uploaded

VIP High Class Call Girls Saharanpur Anushka 8250192130 Independent Escort Se...
VIP High Class Call Girls Saharanpur Anushka 8250192130 Independent Escort Se...VIP High Class Call Girls Saharanpur Anushka 8250192130 Independent Escort Se...
VIP High Class Call Girls Saharanpur Anushka 8250192130 Independent Escort Se...Suhani Kapoor
 
House of Commons ; CDC schemes overview document
House of Commons ; CDC schemes overview documentHouse of Commons ; CDC schemes overview document
House of Commons ; CDC schemes overview documentHenry Tapper
 
Q3 2024 Earnings Conference Call and Webcast Slides
Q3 2024 Earnings Conference Call and Webcast SlidesQ3 2024 Earnings Conference Call and Webcast Slides
Q3 2024 Earnings Conference Call and Webcast SlidesMarketing847413
 
Chapter 2.ppt of macroeconomics by mankiw 9th edition
Chapter 2.ppt of macroeconomics by mankiw 9th editionChapter 2.ppt of macroeconomics by mankiw 9th edition
Chapter 2.ppt of macroeconomics by mankiw 9th editionMuhammadHusnain82237
 
Quantitative Analysis of Retail Sector Companies
Quantitative Analysis of Retail Sector CompaniesQuantitative Analysis of Retail Sector Companies
Quantitative Analysis of Retail Sector Companiesprashantbhati354
 
Malad Call Girl in Services 9892124323 | ₹,4500 With Room Free Delivery
Malad Call Girl in Services  9892124323 | ₹,4500 With Room Free DeliveryMalad Call Girl in Services  9892124323 | ₹,4500 With Room Free Delivery
Malad Call Girl in Services 9892124323 | ₹,4500 With Room Free DeliveryPooja Nehwal
 
Call Girls Service Nagpur Maya Call 7001035870 Meet With Nagpur Escorts
Call Girls Service Nagpur Maya Call 7001035870 Meet With Nagpur EscortsCall Girls Service Nagpur Maya Call 7001035870 Meet With Nagpur Escorts
Call Girls Service Nagpur Maya Call 7001035870 Meet With Nagpur Escortsranjana rawat
 
Bladex Earnings Call Presentation 1Q2024
Bladex Earnings Call Presentation 1Q2024Bladex Earnings Call Presentation 1Q2024
Bladex Earnings Call Presentation 1Q2024Bladex
 
Interimreport1 January–31 March2024 Elo Mutual Pension Insurance Company
Interimreport1 January–31 March2024 Elo Mutual Pension Insurance CompanyInterimreport1 January–31 March2024 Elo Mutual Pension Insurance Company
Interimreport1 January–31 March2024 Elo Mutual Pension Insurance CompanyTyöeläkeyhtiö Elo
 
letter-from-the-chair-to-the-fca-relating-to-british-steel-pensions-scheme-15...
letter-from-the-chair-to-the-fca-relating-to-british-steel-pensions-scheme-15...letter-from-the-chair-to-the-fca-relating-to-british-steel-pensions-scheme-15...
letter-from-the-chair-to-the-fca-relating-to-british-steel-pensions-scheme-15...Henry Tapper
 
fca-bsps-decision-letter-redacted (1).pdf
fca-bsps-decision-letter-redacted (1).pdffca-bsps-decision-letter-redacted (1).pdf
fca-bsps-decision-letter-redacted (1).pdfHenry Tapper
 
High Class Call Girls Nashik Maya 7001305949 Independent Escort Service Nashik
High Class Call Girls Nashik Maya 7001305949 Independent Escort Service NashikHigh Class Call Girls Nashik Maya 7001305949 Independent Escort Service Nashik
High Class Call Girls Nashik Maya 7001305949 Independent Escort Service NashikCall Girls in Nagpur High Profile
 
(办理原版一样)QUT毕业证昆士兰科技大学毕业证学位证留信学历认证成绩单补办
(办理原版一样)QUT毕业证昆士兰科技大学毕业证学位证留信学历认证成绩单补办(办理原版一样)QUT毕业证昆士兰科技大学毕业证学位证留信学历认证成绩单补办
(办理原版一样)QUT毕业证昆士兰科技大学毕业证学位证留信学历认证成绩单补办fqiuho152
 
High Class Call Girls Nagpur Grishma Call 7001035870 Meet With Nagpur Escorts
High Class Call Girls Nagpur Grishma Call 7001035870 Meet With Nagpur EscortsHigh Class Call Girls Nagpur Grishma Call 7001035870 Meet With Nagpur Escorts
High Class Call Girls Nagpur Grishma Call 7001035870 Meet With Nagpur Escortsranjana rawat
 
How Automation is Driving Efficiency Through the Last Mile of Reporting
How Automation is Driving Efficiency Through the Last Mile of ReportingHow Automation is Driving Efficiency Through the Last Mile of Reporting
How Automation is Driving Efficiency Through the Last Mile of ReportingAggregage
 
Call Girls In Yusuf Sarai Women Seeking Men 9654467111
Call Girls In Yusuf Sarai Women Seeking Men 9654467111Call Girls In Yusuf Sarai Women Seeking Men 9654467111
Call Girls In Yusuf Sarai Women Seeking Men 9654467111Sapana Sha
 
Log your LOA pain with Pension Lab's brilliant campaign
Log your LOA pain with Pension Lab's brilliant campaignLog your LOA pain with Pension Lab's brilliant campaign
Log your LOA pain with Pension Lab's brilliant campaignHenry Tapper
 
20240417-Calibre-April-2024-Investor-Presentation.pdf
20240417-Calibre-April-2024-Investor-Presentation.pdf20240417-Calibre-April-2024-Investor-Presentation.pdf
20240417-Calibre-April-2024-Investor-Presentation.pdfAdnet Communications
 

Recently uploaded (20)

VIP High Class Call Girls Saharanpur Anushka 8250192130 Independent Escort Se...
VIP High Class Call Girls Saharanpur Anushka 8250192130 Independent Escort Se...VIP High Class Call Girls Saharanpur Anushka 8250192130 Independent Escort Se...
VIP High Class Call Girls Saharanpur Anushka 8250192130 Independent Escort Se...
 
House of Commons ; CDC schemes overview document
House of Commons ; CDC schemes overview documentHouse of Commons ; CDC schemes overview document
House of Commons ; CDC schemes overview document
 
Q3 2024 Earnings Conference Call and Webcast Slides
Q3 2024 Earnings Conference Call and Webcast SlidesQ3 2024 Earnings Conference Call and Webcast Slides
Q3 2024 Earnings Conference Call and Webcast Slides
 
Chapter 2.ppt of macroeconomics by mankiw 9th edition
Chapter 2.ppt of macroeconomics by mankiw 9th editionChapter 2.ppt of macroeconomics by mankiw 9th edition
Chapter 2.ppt of macroeconomics by mankiw 9th edition
 
Quantitative Analysis of Retail Sector Companies
Quantitative Analysis of Retail Sector CompaniesQuantitative Analysis of Retail Sector Companies
Quantitative Analysis of Retail Sector Companies
 
Malad Call Girl in Services 9892124323 | ₹,4500 With Room Free Delivery
Malad Call Girl in Services  9892124323 | ₹,4500 With Room Free DeliveryMalad Call Girl in Services  9892124323 | ₹,4500 With Room Free Delivery
Malad Call Girl in Services 9892124323 | ₹,4500 With Room Free Delivery
 
🔝+919953056974 🔝young Delhi Escort service Pusa Road
🔝+919953056974 🔝young Delhi Escort service Pusa Road🔝+919953056974 🔝young Delhi Escort service Pusa Road
🔝+919953056974 🔝young Delhi Escort service Pusa Road
 
Call Girls Service Nagpur Maya Call 7001035870 Meet With Nagpur Escorts
Call Girls Service Nagpur Maya Call 7001035870 Meet With Nagpur EscortsCall Girls Service Nagpur Maya Call 7001035870 Meet With Nagpur Escorts
Call Girls Service Nagpur Maya Call 7001035870 Meet With Nagpur Escorts
 
Bladex Earnings Call Presentation 1Q2024
Bladex Earnings Call Presentation 1Q2024Bladex Earnings Call Presentation 1Q2024
Bladex Earnings Call Presentation 1Q2024
 
Interimreport1 January–31 March2024 Elo Mutual Pension Insurance Company
Interimreport1 January–31 March2024 Elo Mutual Pension Insurance CompanyInterimreport1 January–31 March2024 Elo Mutual Pension Insurance Company
Interimreport1 January–31 March2024 Elo Mutual Pension Insurance Company
 
letter-from-the-chair-to-the-fca-relating-to-british-steel-pensions-scheme-15...
letter-from-the-chair-to-the-fca-relating-to-british-steel-pensions-scheme-15...letter-from-the-chair-to-the-fca-relating-to-british-steel-pensions-scheme-15...
letter-from-the-chair-to-the-fca-relating-to-british-steel-pensions-scheme-15...
 
fca-bsps-decision-letter-redacted (1).pdf
fca-bsps-decision-letter-redacted (1).pdffca-bsps-decision-letter-redacted (1).pdf
fca-bsps-decision-letter-redacted (1).pdf
 
High Class Call Girls Nashik Maya 7001305949 Independent Escort Service Nashik
High Class Call Girls Nashik Maya 7001305949 Independent Escort Service NashikHigh Class Call Girls Nashik Maya 7001305949 Independent Escort Service Nashik
High Class Call Girls Nashik Maya 7001305949 Independent Escort Service Nashik
 
(办理原版一样)QUT毕业证昆士兰科技大学毕业证学位证留信学历认证成绩单补办
(办理原版一样)QUT毕业证昆士兰科技大学毕业证学位证留信学历认证成绩单补办(办理原版一样)QUT毕业证昆士兰科技大学毕业证学位证留信学历认证成绩单补办
(办理原版一样)QUT毕业证昆士兰科技大学毕业证学位证留信学历认证成绩单补办
 
High Class Call Girls Nagpur Grishma Call 7001035870 Meet With Nagpur Escorts
High Class Call Girls Nagpur Grishma Call 7001035870 Meet With Nagpur EscortsHigh Class Call Girls Nagpur Grishma Call 7001035870 Meet With Nagpur Escorts
High Class Call Girls Nagpur Grishma Call 7001035870 Meet With Nagpur Escorts
 
🔝9953056974 🔝Call Girls In Dwarka Escort Service Delhi NCR
🔝9953056974 🔝Call Girls In Dwarka Escort Service Delhi NCR🔝9953056974 🔝Call Girls In Dwarka Escort Service Delhi NCR
🔝9953056974 🔝Call Girls In Dwarka Escort Service Delhi NCR
 
How Automation is Driving Efficiency Through the Last Mile of Reporting
How Automation is Driving Efficiency Through the Last Mile of ReportingHow Automation is Driving Efficiency Through the Last Mile of Reporting
How Automation is Driving Efficiency Through the Last Mile of Reporting
 
Call Girls In Yusuf Sarai Women Seeking Men 9654467111
Call Girls In Yusuf Sarai Women Seeking Men 9654467111Call Girls In Yusuf Sarai Women Seeking Men 9654467111
Call Girls In Yusuf Sarai Women Seeking Men 9654467111
 
Log your LOA pain with Pension Lab's brilliant campaign
Log your LOA pain with Pension Lab's brilliant campaignLog your LOA pain with Pension Lab's brilliant campaign
Log your LOA pain with Pension Lab's brilliant campaign
 
20240417-Calibre-April-2024-Investor-Presentation.pdf
20240417-Calibre-April-2024-Investor-Presentation.pdf20240417-Calibre-April-2024-Investor-Presentation.pdf
20240417-Calibre-April-2024-Investor-Presentation.pdf
 

Ppt of security analysis 2

  • 1. PRESENTATION ON FUNDAMENTAL AND TECHNICAL ANALYSIS Submitted to:- Submitted by:- Ms. Priya Rana Neha Saini Class:- M.com(IT)-3rd sem. Roll No.:- 3251720002 Sanatan Dharma College Ambala Cantt
  • 2. FUNDAMENTAL ANALYSIS The intrinsic value of an equity share depends on a multitude of factors. The earning of the company the growth rate and the risk exposure of the company has a direct bearing on the price of share. In this approach, investor attempts to look at fundamental factors that affect risk- returns of the securities. The objective of fundamental security analysis is to appraise the intrinsic value of a security. The intrinsic value is the through economic worth of a financial asset. Security analysis involves examination of the underlying forces that affect the wellbeing of the economy, Industry and company. The security analysis is also called as EIC analysis.(Economy, Industry, Company).
  • 4. ECONOMIC ANALYSIS The analysis of the state of the economy incorporates the performance of the economy in the past, how it is performing in the present and how it is expected to perform in future. Based on economic changes that affect the risk and return on investments.
  • 5. 1) Gross Domestic product:- GDP indicates the rate of growth of the economy. GDP represents aggregate value of consumption of goods and services produced in the economy. Higher GDP is More favorable to the stock market. Lower GDP is Not favorable to the stock market. 2) Savings and investment:- If the savings of the individuals will increase there are more commitments from them to investment. 3) Inflation:- Because of the inflation the demand for the product will effect. Because inflation effects buyers purchasing power. The real rate of growth is very small. Demand for product is decreases. It affects the company profitability position. 4) Interest Rate:- If the interest rate is higher, then it is very difficult to any company to raise funds. Then it leads effects the profitability position of company vice versa. If the interest rates are the credit availability to consumers are low, the sales of the products are reduced.
  • 6. 5) Budget:-  Elaborate account of government expenditure and revenues.  Deficit budget when high Inflation because of increased Cost of production.  Surplus budget when Deflation in the economy.  Balanced budget is favorable to the stock market. 6) Tax Structure:-  Every year in march the business community eagerly awaits the government announcement recording the tax policy.  Concessions and incentives given to a certain industry encourage investment in that particular industry.  Tax relives leads more savings, then the company’s profitability position will increase. 7) Balance of payments:- The balance of payment = “Total receipts – Total payments”
  • 7. 8) Monsoon and Agriculture:-  Agriculture is directly/indirectly linked with some industries. Ex: sugar industries, cotton industries, food industries etc. 9) Infrastructure Facilities:-  I.F is essential for the growth of industries and agriculture sector, a wide network of common system is must for development of economy.  The regular power supply will be considered as boost to the production.  A good I.F is considered as favorable to the stock market. 10) Demographic factors:-  Demographic data provides details about the population by age, occupation etc.  It affects industrial growth and stock market.
  • 8. INDUSTRY ANALYSIS After conducting an analysis of the economy and identifying the direction it is likely to take into short interim and long term, the analyst must look into various sectors of the economy in terms various industries. Industry is a group of companies, which have similar technological structure of production and produce similar products. Industry analysis can also be useful in knowing the investment – worthiness of a firm.
  • 9. Classification of Industries 1) classification by reporting agencies 2) classification by business cycle 3) Industry groups 1) Classification by reporting agencies: According to RBI has industries into 32 groups, stock exchange 10 group, business media have their own classification. 2) Classification by business cycle:  Growth industries: These industries grow consistently and its growth may exceed the average growth of the economy.  Cyclical Industries: These industries mostly likely the benefits from a period of economic prosperity and most likely suffers from economic recession.  Defensive Industries: These industries specify the movement of the business cycle. Defensive industries often contain firms whose securities on investor might hold for income. Food and shelter are the basic requirements of humanity.
  • 10.  Cyclical Growth Industries: These industrial pass both characteristics of cyclical growth industries. Ex: Automobile industries, because these industry experiences period of stagnation. 3) Group of industries: Small scale Up to 30 lakhs Medium scale Rs.5 cr and above Large scale Rs.10 cr and above
  • 11. COMPANY ANALYSIS For earning profits investors apply a simple and common sense decision rule of maximization. That is :  Buy the share at a low price  Sell the share at a high price Company level analysis provides a direct link to investor’s action and his investment goals in operational terms.
  • 13. TECHNICAL ANALYSIS Technical analysis is a process used to examine and predict the future prices of securities by looking at things like price movement, charts, trends, trading volume and other factors. Unlike fundamental analysis, technical analysis focuses on trading signals to delineate good investments and trading opportunities by examining an investment's trends through its trading data and other statistical elements.
  • 14. Assumptions:-  The market value of the scrip is determined by die interaction of supply and demand.  The market discounts everything.  Price moves in trends.  History tends to repeat itself.
  • 15. USE OF TREND IN TECHNICAL ANALYSIS One of the most important concepts in technical analysis is that of trend. The meaning in finance isn't all that different from the general definition of the term - a trend is really nothing more than the general direction in which a security or market is headed. Take a look at the chart below:
  • 16. Types of Trends: Types of Trend There are three types of trend: Up trends Downtrends Sideways/Horizontal Trends Uptrend  It is the trend when financial markets and assets move in upward directions, resulting in an increase in the price. It is usually the time of boom in the economy, where overall sentiments are favorable. Downtrend  In the downtrend or the bear market, the economy, financial markets, and assets prices move in the downward direction. It is the time when companies shrink operations and overall investor sentiment is not favorable.
  • 17. Sideways / horizontal Trend  In this, the assets prices or the broader economy-level are not moving in any direction, rather are moving sideways. This means, moving up for some time and then down on the same level. It is a risky movement as investors are unsure of what will happen to their investment.
  • 18. CHARTS IN TECHNICAL ANALYSIS In technical analysis, charts are similar to the charts that you see in any business setting. A chart is simply a graphical representation of a series of prices over a set time frame. For example, a chart may show a stock's price movement over a one-year period, where each point on the graph represents the closing price for each day the stock is traded:
  • 19. Chart Types: There are four main types of charts that are used by investors and traders depending on the information that they are seeking and their individual skill levels. The chart types are: the line chart, the bar chart, the candlestick chart and the point and figure chart. Line Chart: The most basic of the four charts is the line chart because it represents only the closing prices over a set period of time. The line is formed by connecting the closing prices over the time frame. Line charts do not provide visual information of the trading range for the individual points such as the high, low and opening prices. However, the closing price is often considered to be the most important price in stock data compared to the high and low for the day and this is why it is the only value used in line charts.
  • 20.
  • 21. Bar Chart: The bar chart expands on the line chart by adding several more key pieces of information to each data point. The chart is made up of a series of vertical lines that represent each data point. This vertical line represents the high and low for the trading period, along with the closing price. The close and open are represented on the vertical line by a horizontal dash. The opening price on a bar chart is illustrated by the dash that is located on the left side of the vertical bar. Conversely, the close is represented by the dash on the right. Generally, if the left dash (open) is lower than the right dash (close) then the bar will be shaded black, representing an up period for the stock, which means it has gained value. A bar that is colored red signals that the stock has gone down in value over that period. When this is the case, the dash on the right (close) is lower than the dash on the left (open).
  • 22. Candlestick Charts: The candlestick chart is similar to a bar chart, but it differs in the way that it is visually constructed. Similar to the bar chart, the candlestick also has a thin vertical line showing the period's trading range. The difference comes in the formation of a wide bar on the vertical line, which illustrates the difference between the open and close. And, like bar charts, candlesticks also rely heavily on the use of colors to explain what has happened during the trading period.
  • 23. Volume Volume is simply the number of shares or contracts that trade over a given period of time, usually a day. The higher the volume, the more active the security. To determine the movement of the volume (up or down), chartists look at the volume bars that can usually be found at the bottom of any chart. Volume bars illustrate how many shares have traded per period and show trends in the same way that prices do.
  • 24. Dow Theory The Dow theory is a financial theory that says the market is in an upward trend if one of its averages (i.e. industrials or transportation) advances above a previous important high and is accompanied or followed by a similar advance in the other average. For example, if the Dow Jones Industrial Average (DJIA) climbs to an intermediate high, the Dow Jones Transportation Average (DJTA) is expected to follow suit within a reasonable period of time.
  • 25. The Dow Theory is an approach to trading developed by Charles H. Dow who, with Edward Jones and Charles Bergstresser, founded Dow Jones & Company, Inc. and developed the Dow Jones Industrial Average (DJIA). Dow fleshed out the theory in a series of editorials in the Wall Street Journal, which he co-founded. Before we can get into the specifics of Dow theory trend analysis, we need to understand trends. First, it's important to note that while the market tends to move in a general direction, or trend, it doesn't do so in a straight line. The market will rally up to a high (peak) and then sell off to a low (trough), but will generally move in one direction. (For related reading, see Peak- and-Trough Analysis.)
  • 26. Trends in Dow Theory a) Primary Trend: In Dow theory, the primary trend is the major trend of the market, which makes it the most important one to determine. This is because the overriding trend is the one that affects the movements in stock prices. The primary trend will also impact the secondary and minor trends within the market. (For related reading, see Short-, Intermediate- and Long- Term Trends.) Dow determined that a primary trend will generally last between one and three years but could vary in some instances.
  • 27. b) Secondary, or Intermediate: Trend In Dow theory, a primary trend is the main direction in which the market is moving. Conversely, a secondary trend moves in the opposite direction of the primary trend, or as a correction to the primary trend. For example, an upward primary trend will be composed of secondary downward trends. This is the movement from a consecutively higher high to a consecutively lower high. In a primary downward trend the secondary trend will be an upward move, or a rally. This is the movement from a consecutively lower low to a consecutively higher low.
  • 28. c) Minor Trend: The last of the three trend types in Dow theory is the minor trend, which is defined as a market movement lasting less than three weeks. The minor trend is generally the corrective moves within a secondary move, or those moves that go against the direction of the secondary trend. Due to its short-term nature and the longer-term focus of Dow theory, the minor trend is not of major concern to Dow theory followers. But this doesn't mean it is completely irrelevant; the minor trend is watched with the large picture in mind, as these short- term price movements are a part of both the primary and secondary trends. Most proponents of Dow theory focus their attention on the primary and secondary trends, as minor trends tend to include a considerable amount of noise. If too much focus is placed on minor trends, it can to lead to irrational trading, as traders get distracted by short-term volatility and lose sight of the bigger picture. Stated simply, the greater the time period a trend comprises, the more important the trend.

Editor's Notes

  1. NOTE: To change the image on this slide, select the picture and delete it. Then click the Pictures icon in the placeholder to insert your own image.