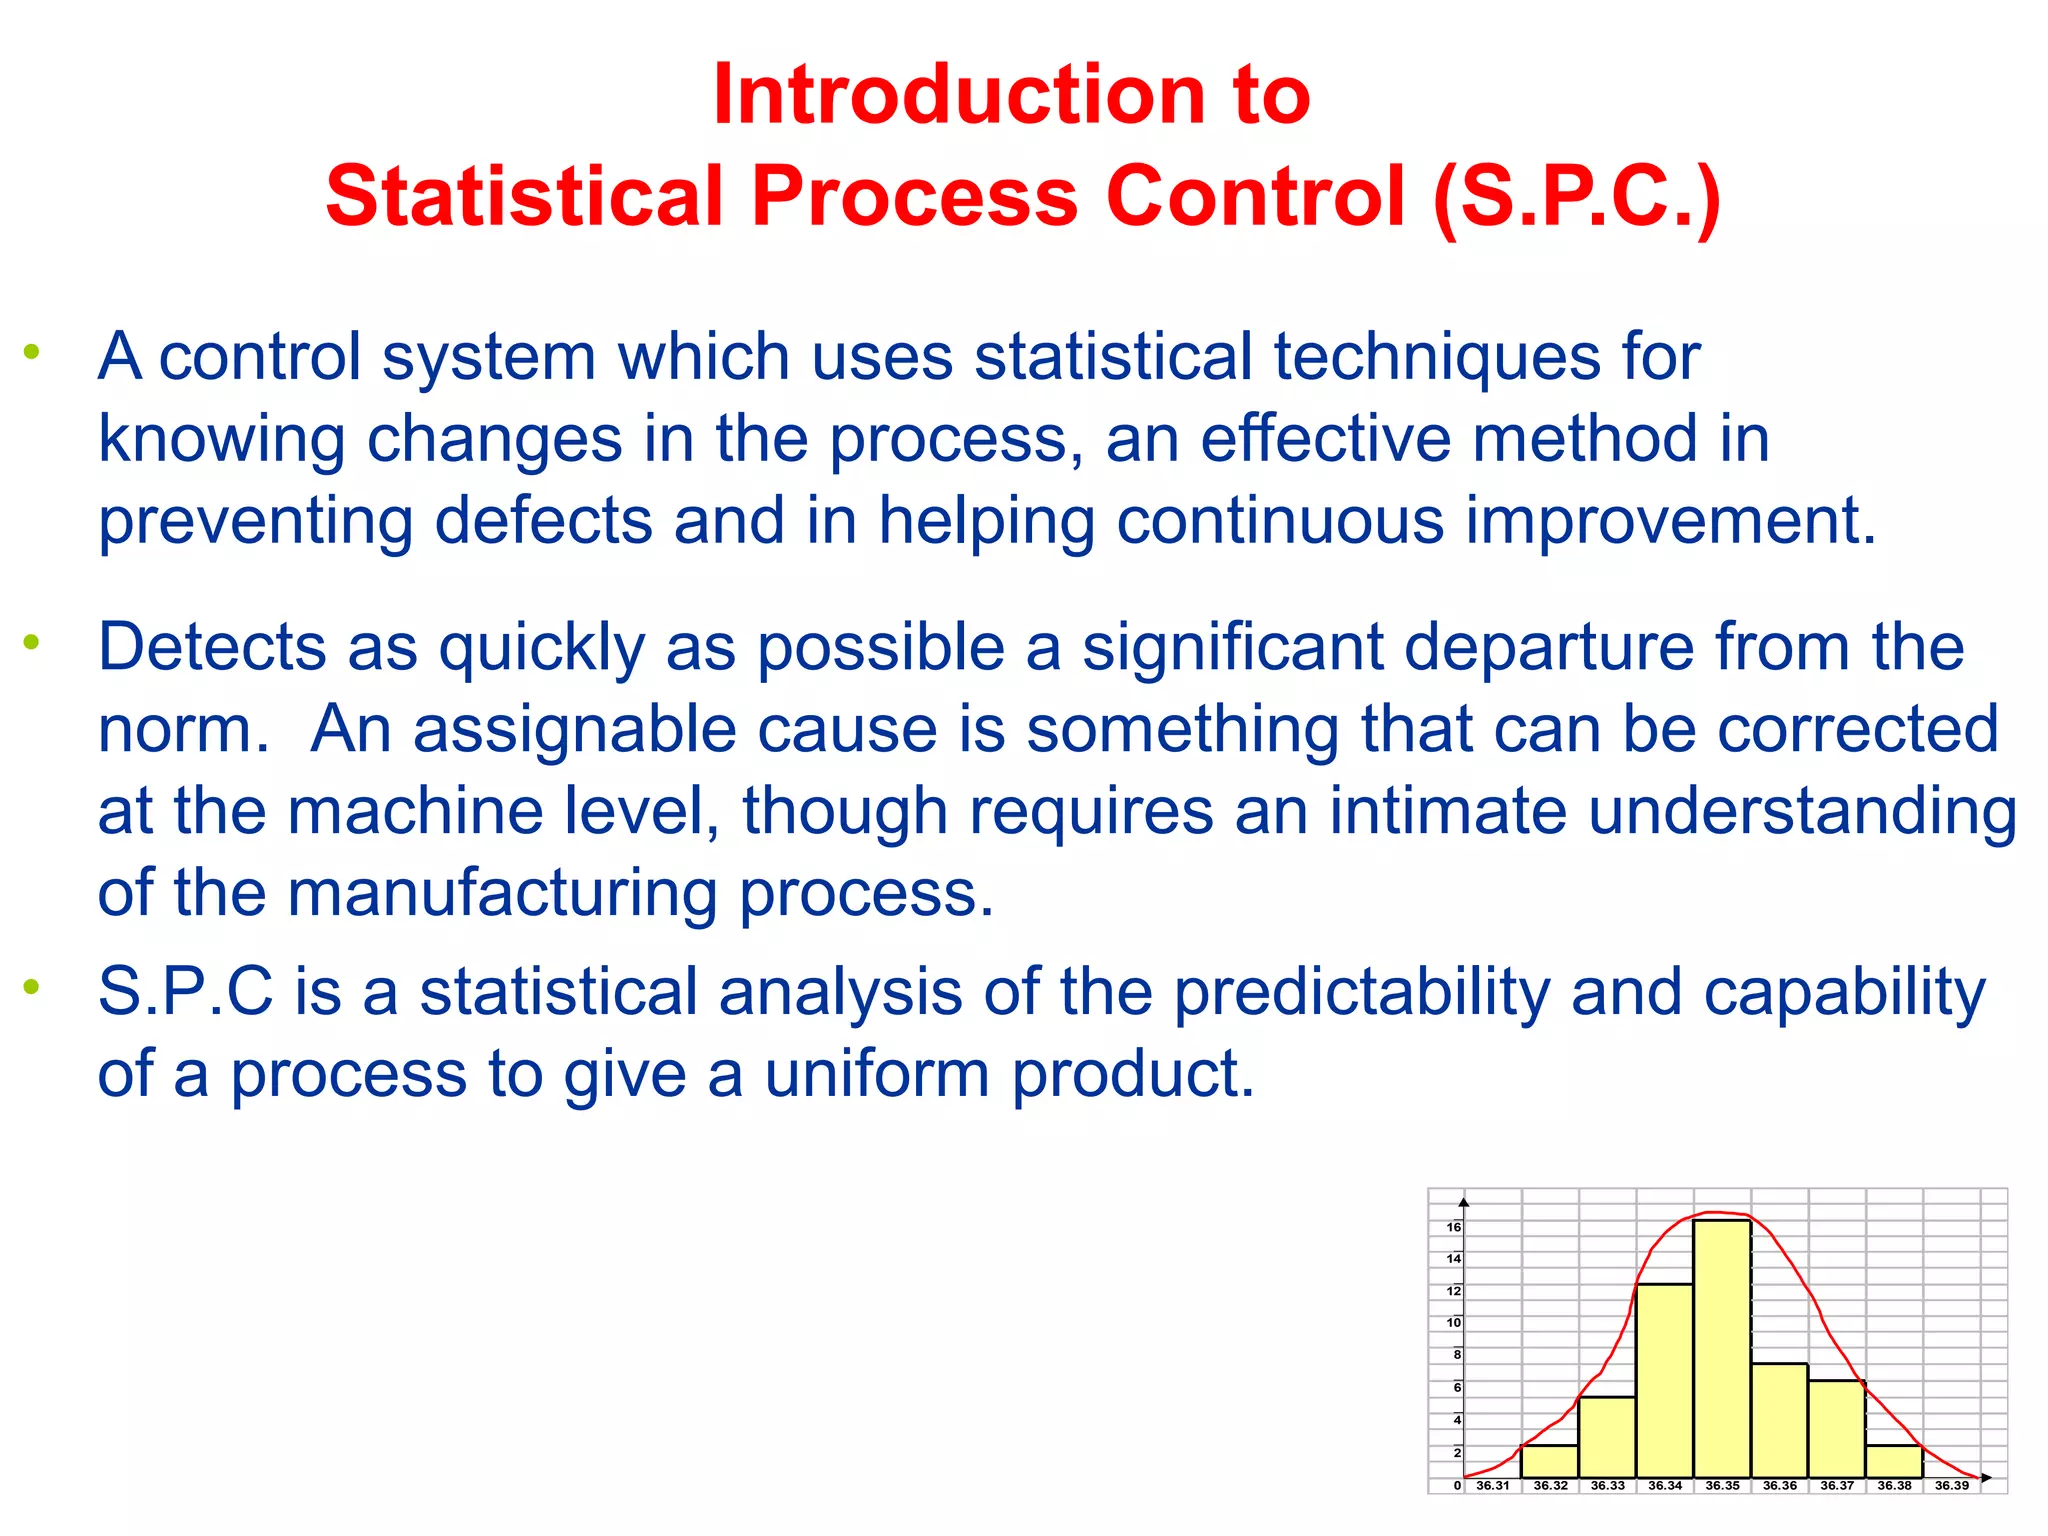
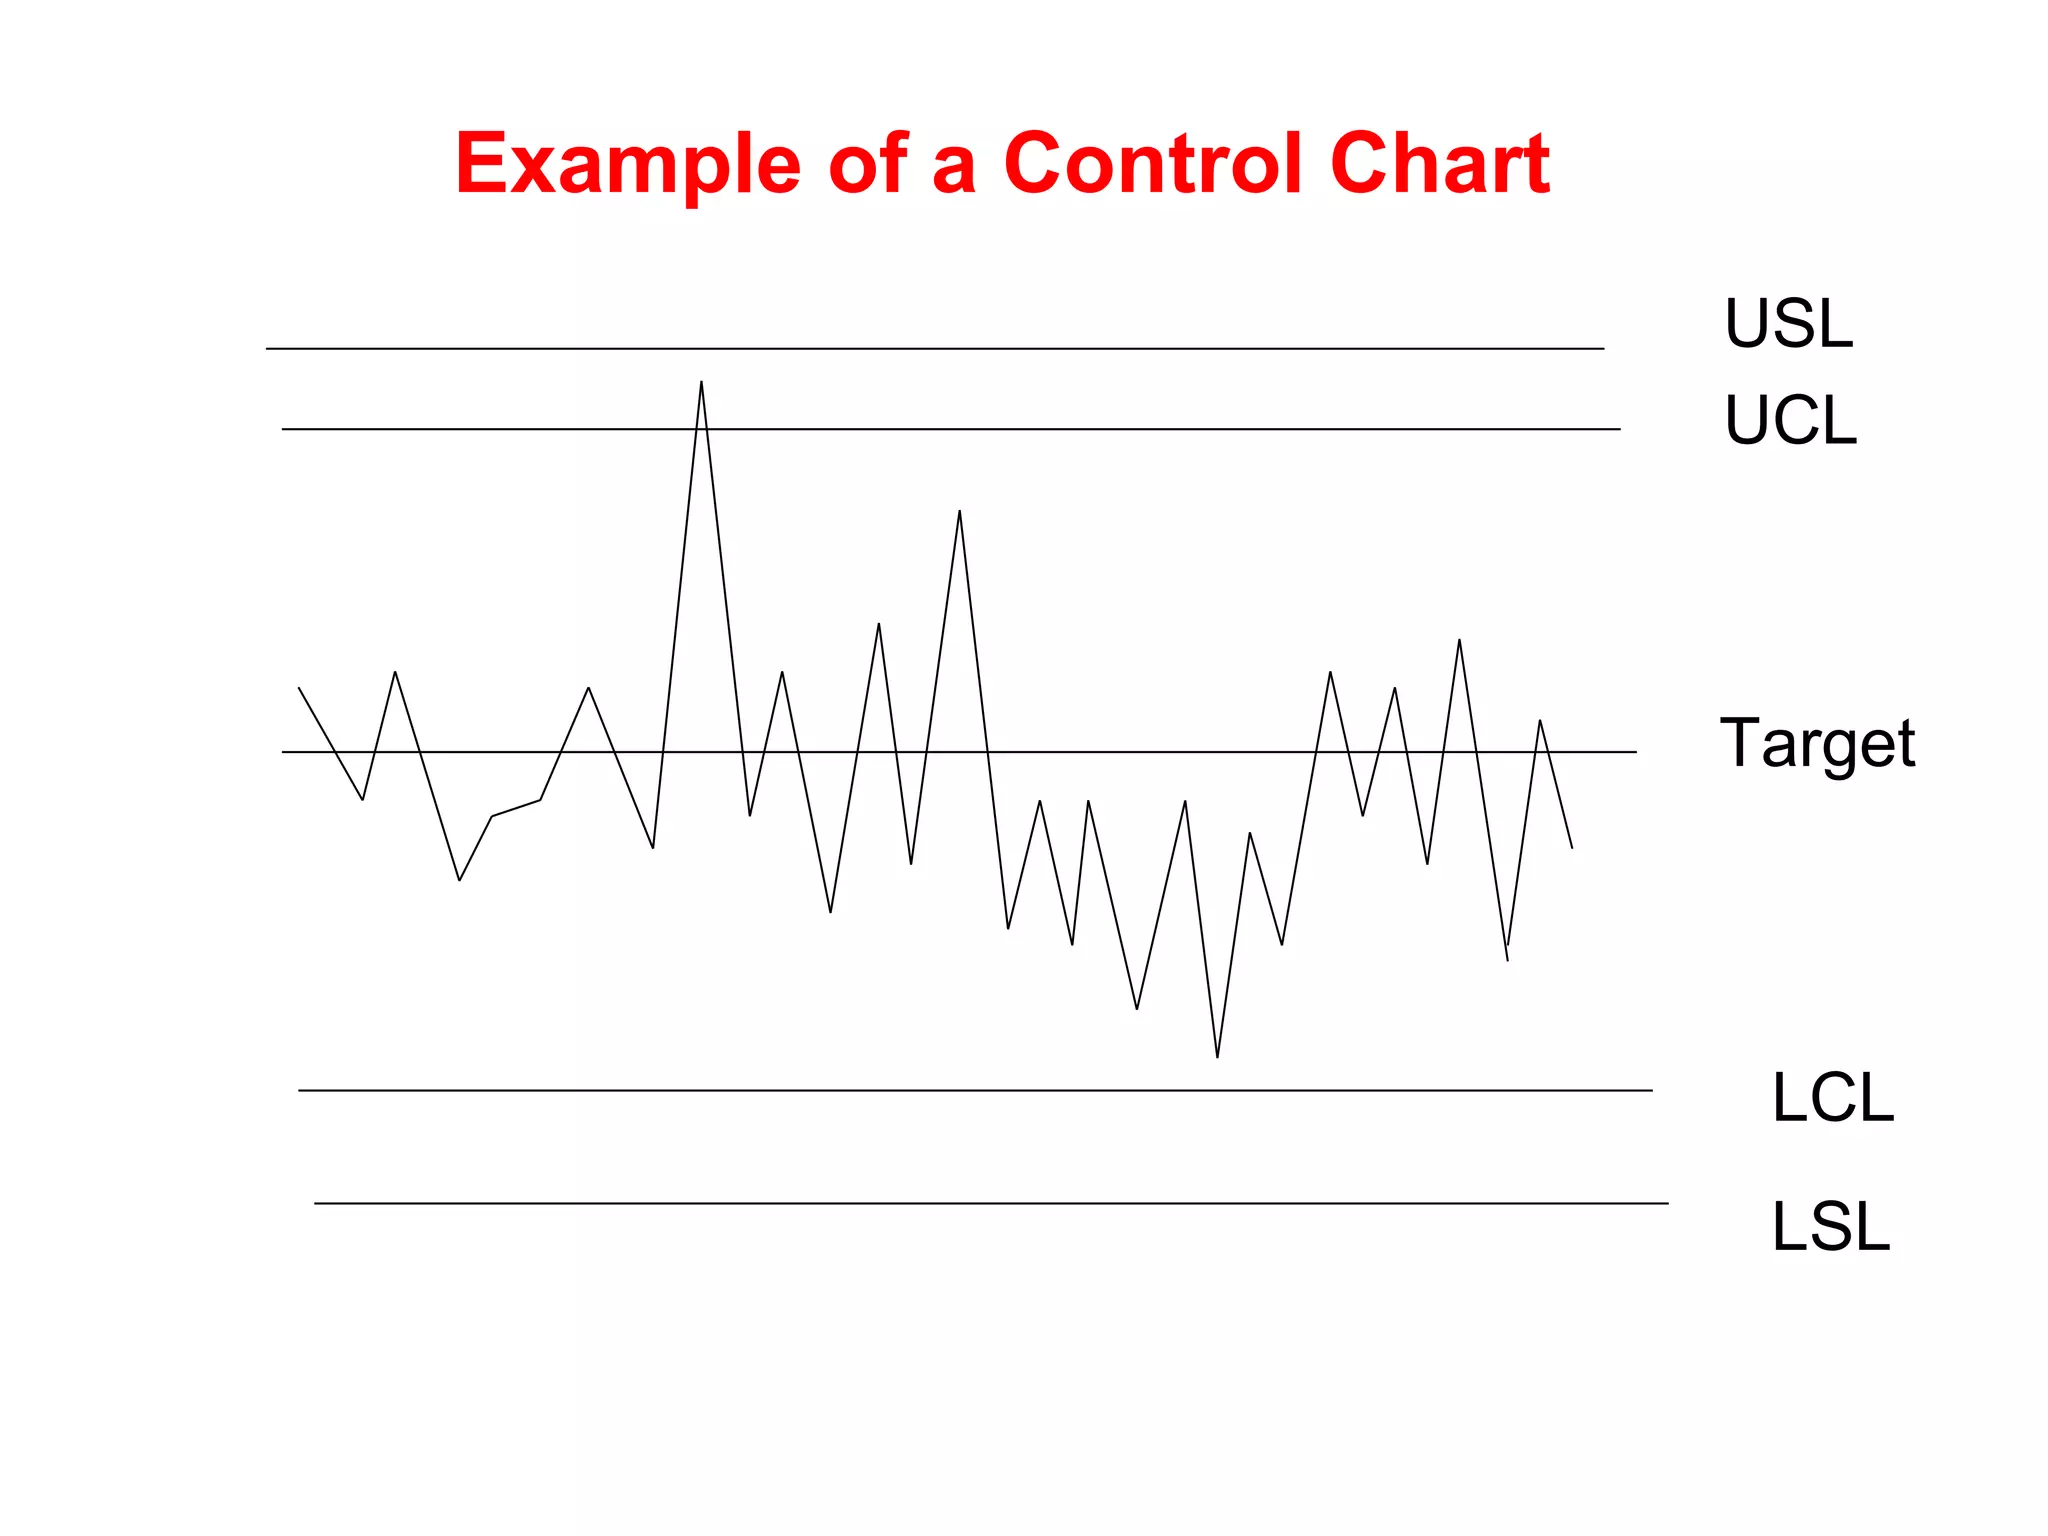
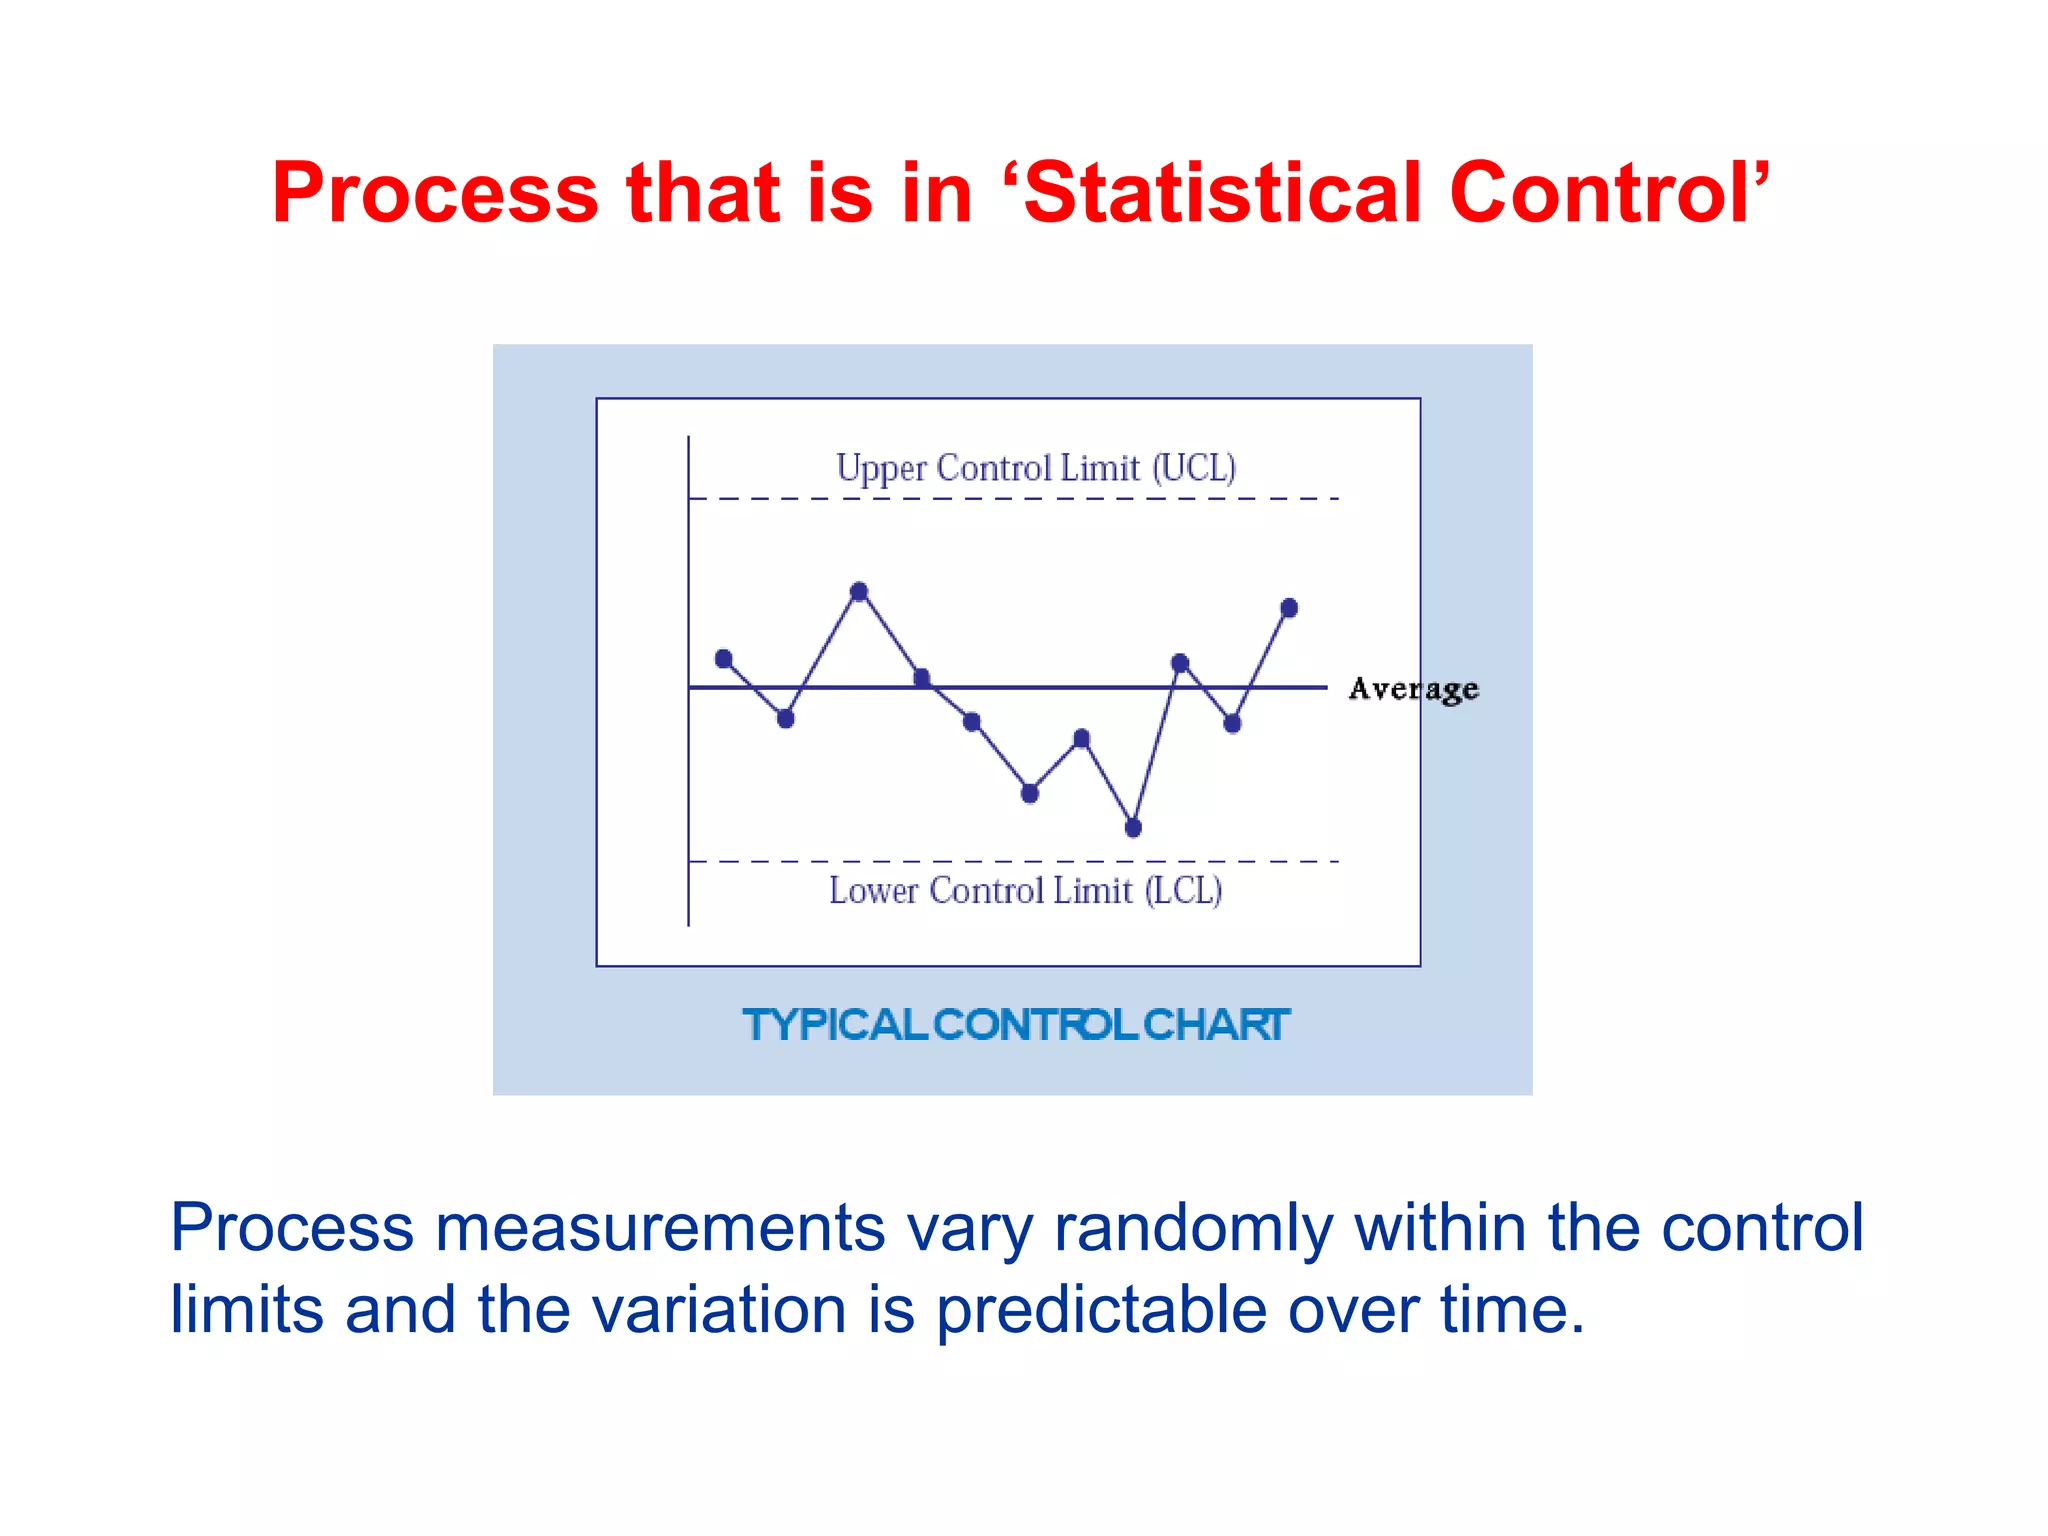
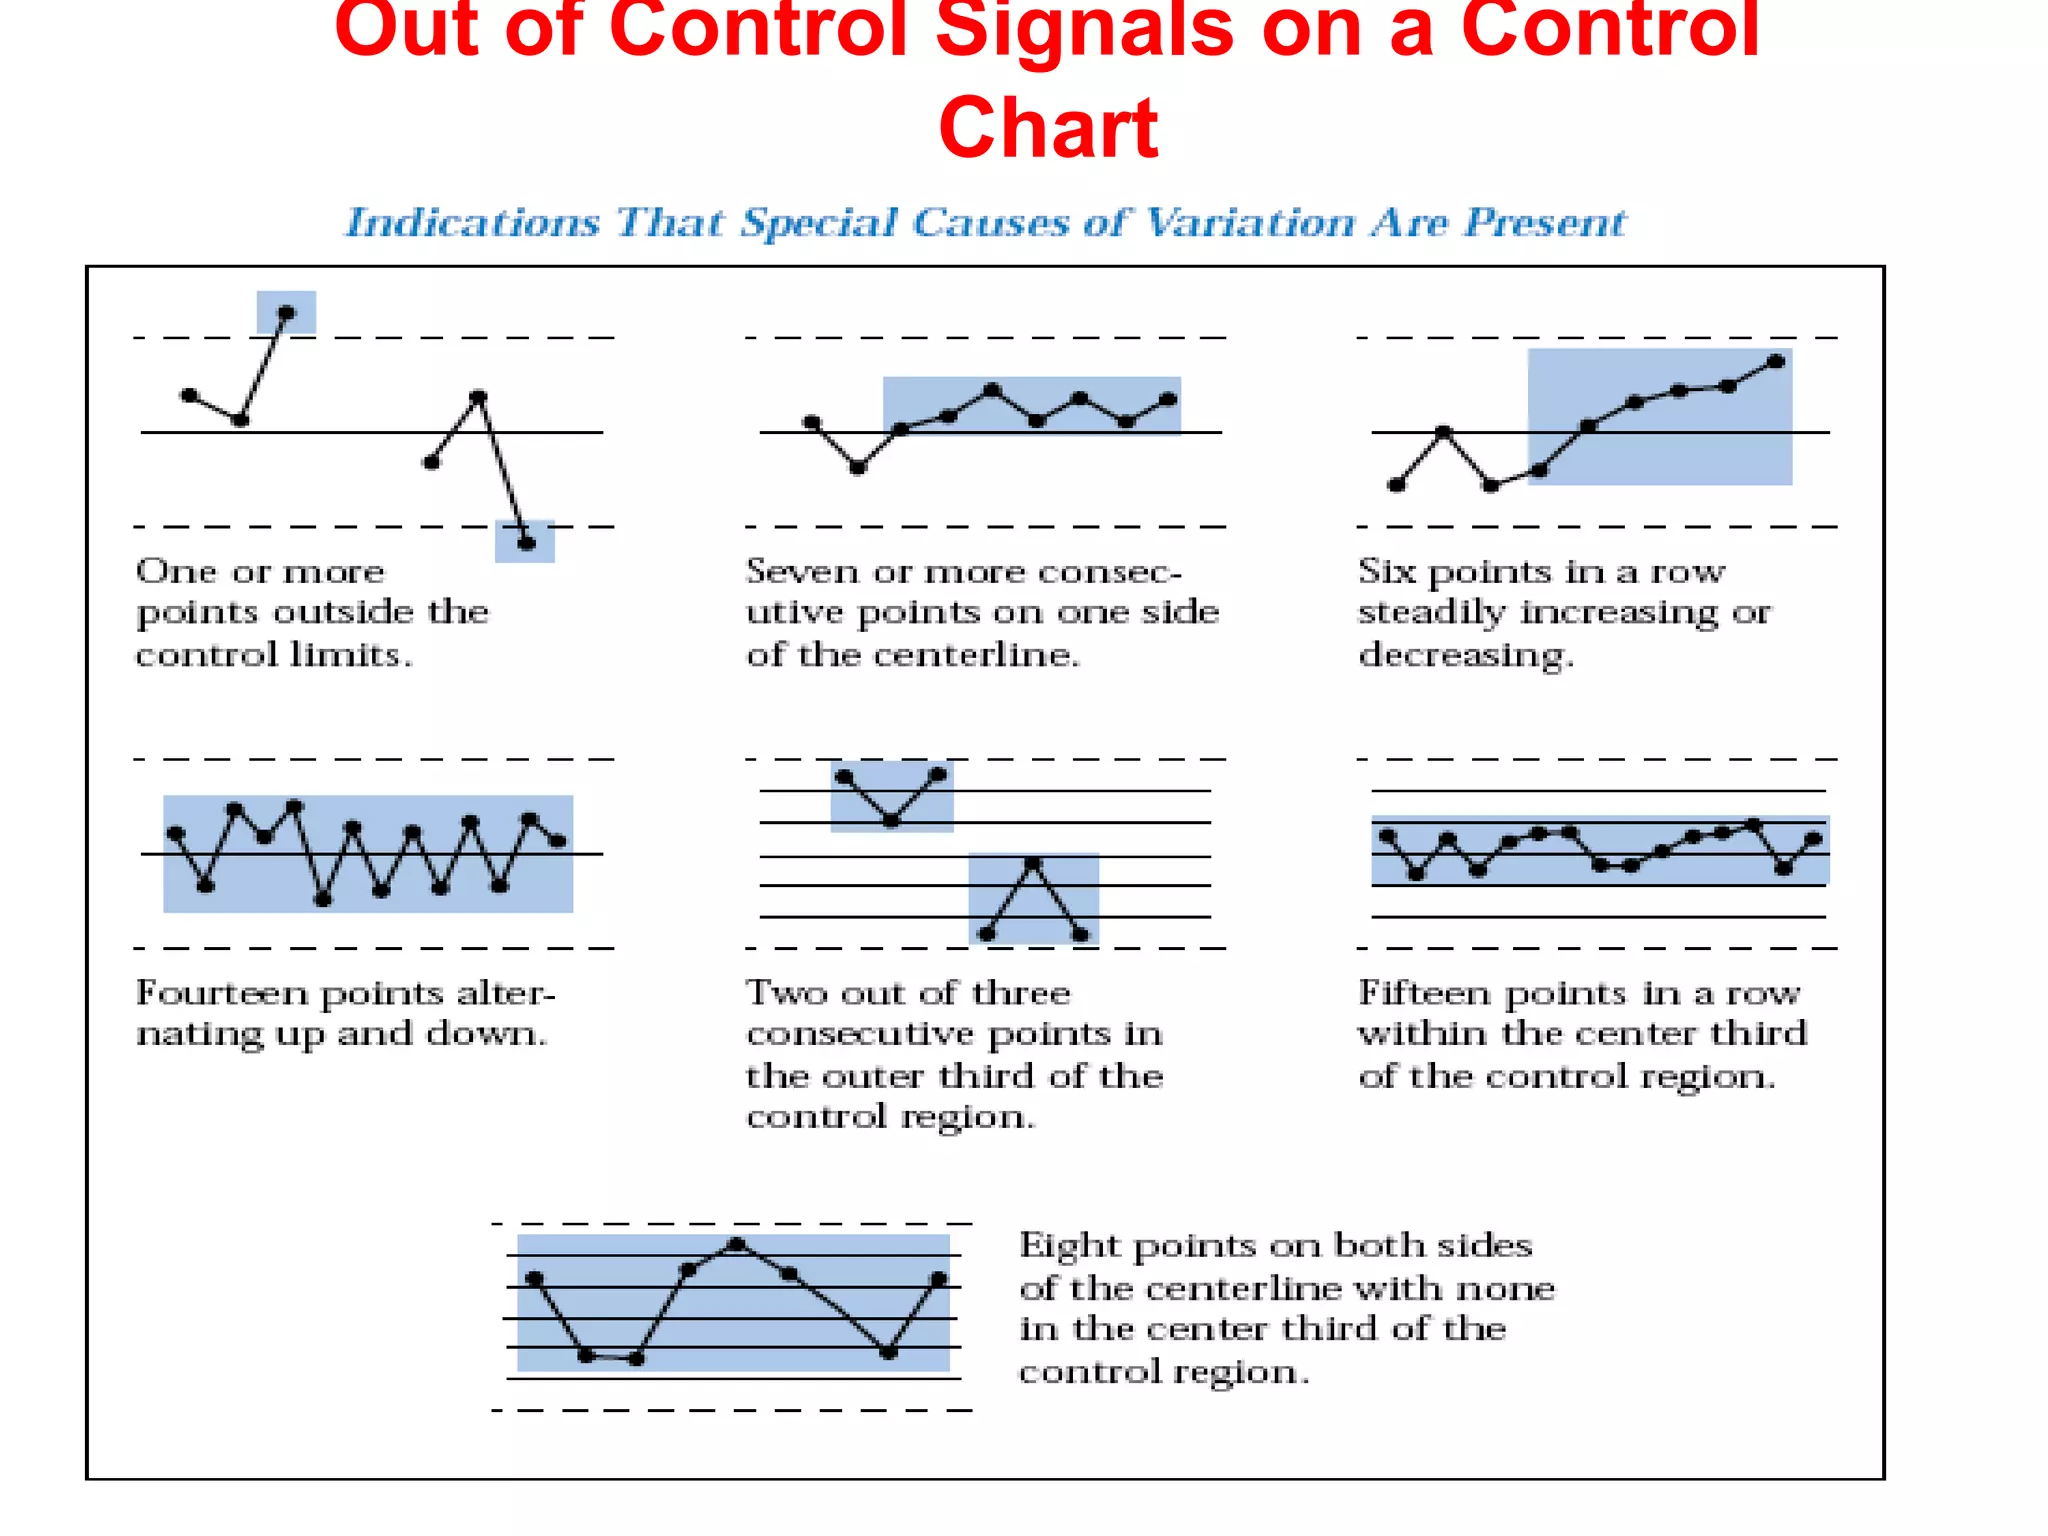
Statistical Process
Control (S.P.C.)
By Lorraine Fraser
• A control system which uses statistical techniques for
knowing changes in the process, an effective method in
preventing defects and in helping continuous improvement.
Introduction to
Statistical Process Control (S.P.C.)
• Detects as quickly as possible a significant departure from the
norm. An assignable cause is something that can be corrected
at the machine level, though requires an intimate understanding
of the manufacturing process.
• S.P.C is a statistical analysis of the predictability and capability
of a process to give a uniform product.
16
14
12
10
8
6
4
2
0 36.31 36.32 36.33 36.34 36.35 36.36 36.37 36.38 36.39
What does S.P.C. mean?
• Statistical - tools are used to make predictions on
performance with a high degree of accuracy.
• Process - the process involves people, machines, materials,
methods, management and environment working together to
produce an output, such as an end product.
• Control - This is a control system which uses statistical
techniques for knowing changes in the process. It is an
effective method in preventing defects and helps continuous
quality improvement.
The Aim of S.P.C.
- Detection Strategy
 Historically a detection type system focused on
identification of problems after production, by 100%
inspection or by customer complaints. The drawbacks to
this process are higher costs (rework, inspection), and
repetitive problems.
Benefits of S.P.C.
• Monitors performance, preventing defects.
• Common language for discussing process performance.
• Reduced cost of inspection and defects with a stable process.
• Is a tool for prevention vs. detection.
 S.P.C. focuses on in-process production and identification of
problems through analysis of process capability. It is a
future oriented strategy.
• When dealing with variable data (measurements), both
the location and spread of the frequency distribution must
be monitored to maintain process control, capability and
centring.
• We turn to control charts to monitor process average and
spread based on average and range of small samples.
• To monitor the location and spread of the process, control
limits will be established to define the expected amount of
variation of both the sample average and sample range.
• If the process is initially controlled, capable and centred,
and the sample data confirm that the process continues to
operate within this expected variation, then the resulting
product or parts will reliably fall within their specification
limits.
• Control charts are real time control tools.
Process Control Charts
 Control limits are not specification limits. Specifications
reflect customer requirements, while control limits reflect
the historical performance of the process.
 Out of control - assignable causes.
 In control - random causes
 Subgroup size – 4 or 5 is most common for economy and
confidence
Process Control Charts
 A control chart is a graph used to study how a process
changes over time.
 Control charts for variable data are used in pairs. The top
chart monitors the average, and the bottom chart monitors
the range, or the width of the distribution.
 Variable data (measurements) are measured on a
continuous scale.
Process Control Charts
Example of a Control Chart
UCL
USL
LCL
LSL
Target
Process that is in ‘Statistical Control’
Process measurements vary randomly within the control
limits and the variation is predictable over time.
Out of Control Signals on a Control
Chart
Self-test (9 of 9)Benefits of Control Charts
 Reduce scrap and re-work by the systematic elimination
of assignable causes
 Prevent unnecessary adjustments.
 Provide diagnostic information from the shape of the non
random patterns.
 Find out what the process can do.
 Provide immediate visual feedback.
 Helps you recognize and understand variability and how
to control it.
 Identify ‘special causes’ of variation and change in
performance
 Keep you from fixing a process that is varying randomly
within control limits. If you want to improve it you have to
objectively identify and eliminate the root cause of the
process variation.
Self-test (9 of 9)
Questions?

Introduction to SPC

  • 1.
  • 2.
    • A controlsystem which uses statistical techniques for knowing changes in the process, an effective method in preventing defects and in helping continuous improvement. Introduction to Statistical Process Control (S.P.C.) • Detects as quickly as possible a significant departure from the norm. An assignable cause is something that can be corrected at the machine level, though requires an intimate understanding of the manufacturing process. • S.P.C is a statistical analysis of the predictability and capability of a process to give a uniform product. 16 14 12 10 8 6 4 2 0 36.31 36.32 36.33 36.34 36.35 36.36 36.37 36.38 36.39
  • 3.
    What does S.P.C.mean? • Statistical - tools are used to make predictions on performance with a high degree of accuracy. • Process - the process involves people, machines, materials, methods, management and environment working together to produce an output, such as an end product. • Control - This is a control system which uses statistical techniques for knowing changes in the process. It is an effective method in preventing defects and helps continuous quality improvement.
  • 4.
    The Aim ofS.P.C. - Detection Strategy  Historically a detection type system focused on identification of problems after production, by 100% inspection or by customer complaints. The drawbacks to this process are higher costs (rework, inspection), and repetitive problems. Benefits of S.P.C. • Monitors performance, preventing defects. • Common language for discussing process performance. • Reduced cost of inspection and defects with a stable process. • Is a tool for prevention vs. detection.  S.P.C. focuses on in-process production and identification of problems through analysis of process capability. It is a future oriented strategy.
  • 5.
    • When dealingwith variable data (measurements), both the location and spread of the frequency distribution must be monitored to maintain process control, capability and centring. • We turn to control charts to monitor process average and spread based on average and range of small samples. • To monitor the location and spread of the process, control limits will be established to define the expected amount of variation of both the sample average and sample range. • If the process is initially controlled, capable and centred, and the sample data confirm that the process continues to operate within this expected variation, then the resulting product or parts will reliably fall within their specification limits. • Control charts are real time control tools. Process Control Charts
  • 6.
     Control limitsare not specification limits. Specifications reflect customer requirements, while control limits reflect the historical performance of the process.  Out of control - assignable causes.  In control - random causes  Subgroup size – 4 or 5 is most common for economy and confidence Process Control Charts
  • 7.
     A controlchart is a graph used to study how a process changes over time.  Control charts for variable data are used in pairs. The top chart monitors the average, and the bottom chart monitors the range, or the width of the distribution.  Variable data (measurements) are measured on a continuous scale. Process Control Charts
  • 8.
    Example of aControl Chart UCL USL LCL LSL Target
  • 9.
    Process that isin ‘Statistical Control’ Process measurements vary randomly within the control limits and the variation is predictable over time.
  • 10.
    Out of ControlSignals on a Control Chart
  • 11.
    Self-test (9 of9)Benefits of Control Charts  Reduce scrap and re-work by the systematic elimination of assignable causes  Prevent unnecessary adjustments.  Provide diagnostic information from the shape of the non random patterns.  Find out what the process can do.  Provide immediate visual feedback.  Helps you recognize and understand variability and how to control it.  Identify ‘special causes’ of variation and change in performance  Keep you from fixing a process that is varying randomly within control limits. If you want to improve it you have to objectively identify and eliminate the root cause of the process variation.
  • 12.
    Self-test (9 of9) Questions?

Editor's Notes

  • #10 A process is said to be in “statistical control” when the process measurements vary randomly within the control limits, that is, the variation present in the process is convenient and predictable over time. Control limits are a function of the way your process actually performs over time. Specification or tolerance limits are a function of what your process may have been designed to do and may not necessarily have any direct relationship to the actual performance of the process.
  • #11 There are several indications of ‘out of control’ situations on a Control chart, including: one or more points outside the control limits, seven or more consecutive points on one side of the centreline, Six points in a row steadily increasing or decreasing Fourteen points alternating up and down Two out of three consecutive points in the outer third of the control region Eight points on both sides of the centre third of the control region.