SlideShare a Scribd company logo
Net Zero Energy Design of Commercial Buildings
A Research Report submitted to the faculty of
San Francisco State University
In partial fulfillment of
The requirements for
The Degree
Master of Science
In
Engineering: Energy Systems
By
Ruchir Hemant Shah
San Francisco, California
December 2015
i
Copyright by
Ruchir Hemant Shah
2015
ii
CERTIFICATION OF APPROVAL
I certify that I have read Net Energy Design of Commercial Buildings by Ruchir H. Shah, and
that in my opinion this work meets the criteria for approving a research project report submitted
in partial fulfillment of the requirement for the degree Master of Science in Energy Systems at
San Francisco State University.
Ahmad Ganji, Ph.D.
Professor
A. S. (Ed) Cheng, Ph.D.
Professor
iii
Net Zero Energy Design of Commercial Buildings
Ruchir Hemant Shah
San Francisco, California
2015
The vision of Net Zero Energy Buildings (NZEBs) is compelling. In theory, the amount of
energy consumed by the building for an entire year should be less than or equal to the amount of
energy produced by the onsite renewable source.
The main aim of my project is to build maximum number of floors in the building and make it
zero net site energy using roof-top solar photovoltaic (PV) panels. To check weather effect,
project is simulated in three different weather conditions.
Results obtained from the simulation in this project under the three weather conditions show that
a maximum of two floors can be designed in new energy efficient buildings to make them zero
net site energy using roof mounted solar PV. The simulation results indicate that only one floor
can be built as a net zero source energy building if natural gas consumption converted into
electrical energy consumption. To design more than two floors in new construction or to design
more than one floor in existing building to make net zero energy, we need to use building site for
energy production, in addition to the roof-top.
Analysis methods for design and implementation of NZEBs are also discussed. The discussion is
followed by several ways to achieve large-scale, replicable NZEBs performance. Various passive
and renewable energy strategies are implemented, including full daylighting, high-performance
lighting, natural ventilation, infiltration and thermal mass. Ground source heat pumps have been
used for space conditioning as well domestic water heating.
I certify that the Abstract is a correct representation of the content of this thesis.
Chair, Project Committee Date
iv
PREFACE AND/OR ACKNOWLEDGEMENTS
I want to thank Professor Ahmad Ganji for his immense support and guidance in the
accomplishment of my project. I would like to thank him further for meeting with me every
week and helping me solve all the doubts and providing detailed solutions. This helped me
developed a lot of insights on NZE and gain conceptual knowledge during the span of this
project. Professor Ganji was extremely helpful and generous throughout the project
development.
I would also like to thank Professor A.S Cheng to be my other committee chair professor for his
assistance. I truly thank professor Cheng to support me during my entire stay at San Francisco
State University.
v
TABLE OF CONTENTS
Table of Contents………………………………………………………………………………...V
List of Figures………………………………………………………………………………….VII
List of Tables………………………………………………………………………………….VIII
1. Introduction……………………………………………………………………………………1
1.1. Problem Definition……………………………………………………………………….1
1.2. Project Scope………………………………………………………………………..........1
2. Climate Assessment…………………………………………………………………………....2
3. Energy Efficient Buildings………………………………………………………………….....3
3.1. Passive Design…………………………………………………………………………….4
3.2. Building Envelop………………………………………………………………………….8
3.3. Mechanical Systems………………………………………………………………………10
3.3.1. Traditional System…………………………………………………………………11
3.3.2. Heat Pumps………………………………………………………………………...11
3.4. Domestic Hot Water……………………………………………………………………...16
3.5. Lighting…………………………………………………………………………………..17
4. Renewable Energy…………………………………………………………………………….19
4.1. Solar Electric Generation…………………………………………………………………19
4.2. Solar Water Heating………………………………………………………………………20
5. Plug Loads and Occupancy……………………………………………………………………21
6. Modeling Simulation …………………………………………………………………………22
6.1 Building Specification…………………………………………………………………….22
6.2 Modeling Tool…………………………………………………………………………….23
vi
6.3 Model Specification……………………………………………………………………….24
6.4. Modeling Results…………………………………………………………………………27
7. Simulation Verification………………………………………………………………………..34
8. Future of Net Zero Energy Building………………………………………………………......35
9. References……………………………………………………………………………………..36
vii
LIST OF FIGURES
Figures Page
1. Night Purge Ventilation………………………………………………………5
2. Daylighting…………………………………………………………………... 7
3. Natural Ventilation…………………………………………………………... 8
4. Horizontal Closed loop Ground Source Heat pump System………………… 9
5. Vertical Closed loop Ground Source Heat pump System…………………….13
6. Pond/Lake Closed loop Ground Source Heat pump System………………….14
7. Open Loop Ground Source Heat Pump……………………………………… 15
8. Window Technology………………………………………………………….16
9. Commercial Building Use Breakdown……………………………………….21
10. Building Schematic…………………………………………………………..22
viii
LIST OF TABLES
Table 6-1 Tabular inputs used in eQuest for baseline building, Energy Efficient
techniques and Net Zero Energy for different location………………………...24
Table 6-2 Output of new office building with 50,000 Sqft in Phoenix, AZ for different
floors…………………………………………………………………………….28
Table 6-3 Output of new office building with 100,000 Sqft in Phoenix, AZ for different
floors…………………………………………………………………………….28
Table 6-4 Output of new office building with 50,000 Sqft in San Jose, CA for different
floors…………………………………………………………………………….28
Table 6-5 Output of new office building with 100,000 Sqft in San Jose, CA for different
floors…………………………………………………………………………….28
Table 6-6 Output of new office building with 50,000 Sqft in Chicago, IL for different
floors…………………………………………………………………………….29
Table 6-7 Output of new office building with 100,000 Sqft in Chicago, IL for different
floors…………………………………………………………………………….29
Table 6-8 Output of conventional office building with 100,000 Sqft in San Jose, CA for
different floors…………………………………………………………………..30
Table 6-9 Output of conventional office building with 100,000 Sqft in Phoenix, AZ for
different floors……………………………………………………………………30
Table 6-10 Output of conventional office building with 100,000 Sqft in Chicago, IL for
different floors…………………………………………………………………...31
Table 6-11 Comparison between new and existing building parameters for Phoenix, AZ with
different floors…………………………………………………………………...31
Table 6-12 Comparison between new and existing building parameters for San Jose, CA with
different floors…………………………………………………………………...32
Table 6-13 Comparison between new and existing building parameters for Chicago, IL with
different floors…………………………………………………………………...33
Table 6-14 Comparison between RSF building real data and my simulation output………...35
1
1. Introduction
Buildings have a significant impact on energy use and the environment. Commercial and
residential buildings use almost 40% of the primary energy in the United State (EIA 2005). The
energy used by the building sector continues to increase, primarily because new buildings are
constructed faster than existing ones are retired. Electricity consumption in the commercial
building sector doubled between 1980 and 2000 and is expected to increase another 50% by
2025 (EIA 2005). To address the growing energy use in the commercial building sector, an
influential community of industry leaders and researchers has committed to pushing the
boundaries of building performance to develop net-zero energy buildings (NZEBs).
Big bold goals adopted by California Public Utilities Commission (CPUC) in 2007-08 was, all
new residential construction in California will be zero net energy by 2020. All new commercial
construction in California will be zero net energy by 2030 (CPUC 2008).
1.1 Problem Definition
At its core, the amount of energy consumed by building for entire year should be less than or
equal to amount of energy produce by onsite renewable energy sources. The National Renewable
Energy Laboratory (NREL) has defined four ways of measuring and defining net zero energy for
buildings; net zero site energy, net zero source energy, net zero energy emissions, net zero
energy cost.
Net Zero Site Energy building produces at least as much renewable energy as it uses over the
course of the year when accounted for the site (Torcellini 2006)
Net Zero Source Energy building produces or purchases at least as much renewable energy as it
uses over the course of a year when accounted for at the energy source (Torcellini 2006).
Net Zero Energy Emission building produces or purchases enough emission-free renewable
energy to offset emissions from all energy used in the building over the course of a year
(Torcellini 2006).
Net Zero Cost Building receives at least as much financial credit for exported renewable energy
as it is charged for energy and energy services by the utility over the course of the year
(Torcellini 2006).
From the above definitions, the modeling simulation in this report is based on net zero site
energy using roof mounted solar PV.
1.2 Project Scope
The project is carried out to determine how many floors can be built in an energy efficient
commercial building to make it a net zero site energy building with roof-top PV system as the
energy source. The results are verified in different climates for all the buildings compliant with
current standards. Two office buildings are taken into consideration each having 50,000 Sqft and
100,000 Sqft areas with maximum number of floors viable. The modelling is carried out in given
2
climatic conditions for the cities of San Jose, CA, Chicago, IL and Phoenix, AZ. The modeling
simulation is developed using a ground source heat pump for heating and cooling source .Several
passive architecture energy efficient techniques such as daylighting, energy efficient building
envelope, lighting controls and natural ventilation are applied. In modeling of conventional
buildings, CA Title 24 and ASHRAE 90.1 standards are utilized to check net zero energy
possibilities. The results are compared with a new building to show the effects of energy efficient
techniques.
2. Climate Assessment
Climate is critical variable in the design of a net zero energy project. It influences external
thermal loads of a project and it is also a free source of energy. Simply we can say that net zero
energy project must be climate responsive. Climate classes are:
A. Tropical
B. Arid
C. Temperate
D. Cold
E. Polar
A. Tropical
Tropical climates are characterized by yearlong hot and moist weather with rainfall and
humidity. Example location: Miami, FL
Design Response:
• Reduce cooling load with passive strategies, such as minimizing solar radiation, reduce
thermal conduction, reducing internal heat gain.
• Daylight lowers lighting load and internal heat gain. Natural Ventilation is useful for
some tropical climates.
• Light colors for exterior surface will reflect rather than absorbs solar radiation.
B. Arid
Characterized by lack of precipitation. Can be hot or cold. Example locations: Nevada, Arizona,
New Mexico.
Design response:
• Hot climates are cooling dominated and cold climates are heating dominated.
• Night purge ventilation can also be effective for moderate cooling.
• Provide natural ventilation and solar shading during cooling season.
3
C. Temperate
Characterized by warm summer and cool winter. Example location: California
Design response:
• Hot climates are cooling dominated and cold climates are heating dominated.
• Night purge ventilation can also be effective for moderate cooling.
• Provide natural ventilation and solar shading during cooling season.
D. Cold
Characterized by cold winter with snow. Example location: Rochester, NY
Design response:
• Reduce heat transfer through conduction with well insulated building envelop
• Hot climates are cooling dominated and cold climates are heating dominated.
• Provide natural ventilation and solar shading during cooling season.
E. Polar
Extremely cold weather often with no summer season and typically treeless. No Human
population. Example location: Arctic
The simulation is performed for Phoenix, AZ as arid, San Jose, CA as temperate and Chicago, IL
as cool and humid.
3. Energy Efficient Buildings
Energy efficient buildings are the ones that use a minimum amount of energy throughout the
year. To achieve energy efficiency, passive and active architecture strategies play vital roles.
Passive architecture includes, daylighting, natural ventilation, air tightness of the building, and
efficient building envelopes. Active architecture contains mechanical systems in the building like
Heating Ventilation Air Conditioning (HVAC) and Domestic Hot Water (DHW). This section
will provide a brief introduction of passive and active architectures, lighting systems in the
building and their roles in energy efficient buildings.
3.1 Passive Design
Passive design is defined as the use of architecture and climate to provide heating, cooling,
ventilation and lighting. In other words technique which does not require any active systems. It is
one of the most important parameters to a get free source of energy in net zero energy building
for heating and cooling. However, we cannot rely totally on passive design to provide heating
4
and cooling so we still need active systems in the building, but the main aim is to minimize the
use of active system’s usage (Hootman 2012).
Passive Strategies Types
This section includes different passive strategy types like, thermal mass, night purge, super
insulation, air tightness, daylighting, and daylighting.
Thermal Mass: In building design, thermal mass is a property of the mass of a building which
enables it to store heat, providing "inertia" against temperature fluctuations. Thermal mass will
absorb thermal energy when the surroundings are higher in temperature than the mass, and give
thermal energy back when the surroundings are cooler, without reaching thermal equilibrium.
Ideal materials for thermal mass are those materials that have:
• High specific heat capacity,
• High density
Any solid, liquid, or gas that has mass will have some thermal mass. A common misconception
is that only concrete or earth soil has thermal mass; even air has thermal mass (Hootman 2012).
Night Purge: Night-Purge Ventilation (or "night flushing") keeps windows and other passive
ventilation openings closed during the day, but open at night to flush warm air out of the building
and cool thermal mass for the next day. Night-purge ventilation is useful when daytime air
temperatures are so high that bringing unconditioned air into the building would not cool people
down, but where night time air is cool or cold. This strategy can provide passive ventilation in
weather that might normally be considered too hot for it (Hootman 2012). Night flushing works
by opening up pathways for wind ventilation and stack ventilation throughout the night, to cool
down the thermal mass in a building by convection. Early in the morning, the building is closed
and kept sealed throughout the day to prevent warm outside air from entering. During the day,
the cool mass absorbs heat from occupants and other internal loads. This is done largely by
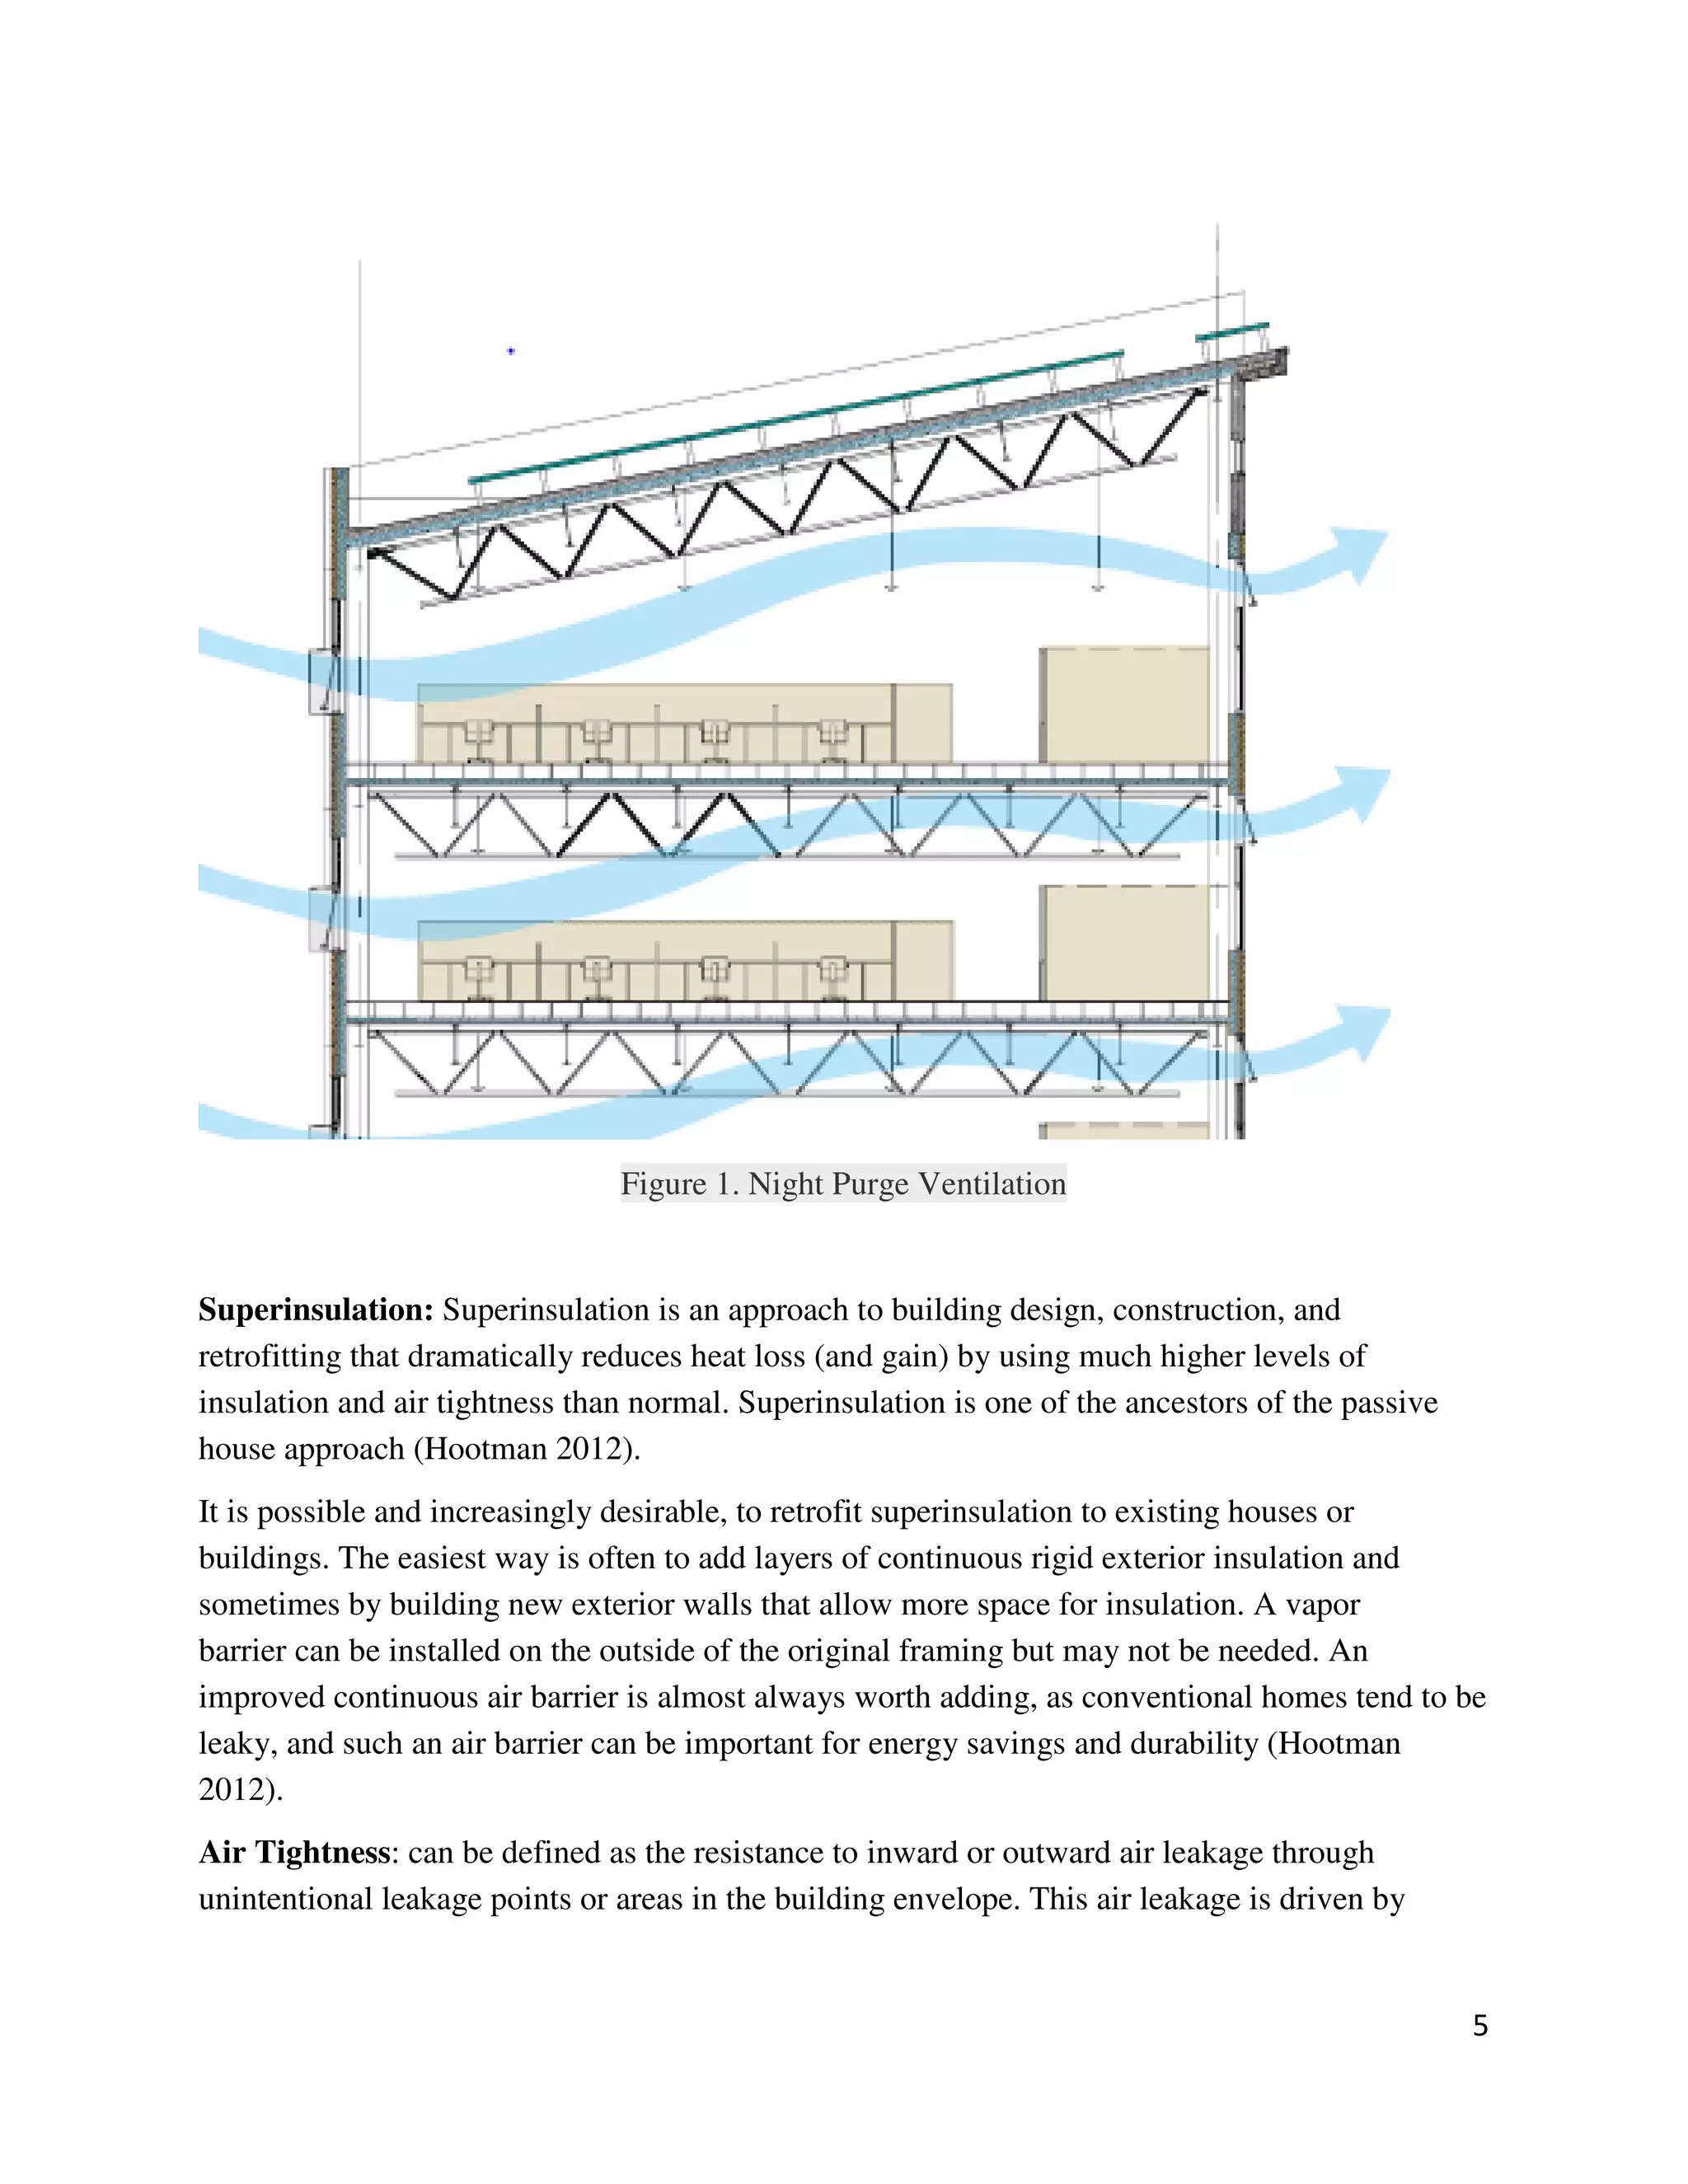
radiation, but convection and conduction also play roles (Hootman 2012). Figure 1 will give
more idea about night purge ventilation.
5
Figure 1. Night Purge Ventilation
Superinsulation: Superinsulation is an approach to building design, construction, and
retrofitting that dramatically reduces heat loss (and gain) by using much higher levels of
insulation and air tightness than normal. Superinsulation is one of the ancestors of the passive
house approach (Hootman 2012).
It is possible and increasingly desirable, to retrofit superinsulation to existing houses or
buildings. The easiest way is often to add layers of continuous rigid exterior insulation and
sometimes by building new exterior walls that allow more space for insulation. A vapor
barrier can be installed on the outside of the original framing but may not be needed. An
improved continuous air barrier is almost always worth adding, as conventional homes tend to be
leaky, and such an air barrier can be important for energy savings and durability (Hootman
2012).
Air Tightness: can be defined as the resistance to inward or outward air leakage through
unintentional leakage points or areas in the building envelope. This air leakage is driven by
6
differential pressures across the building envelope due to the combined effects of the stack,
external wind and mechanical ventilation systems.
Air tightness is the fundamental building property that impacts infiltration. An airtight building
has several positive impacts when combined with an appropriate ventilation system (whether
natural, mechanical, or hybrid) (Hootman 2012).
Daylighting: Daylighting is the controlled admission of direct and diffuse Sunlight into a
building to reduce electric lighting and saving energy. A key feature of energy efficient
commercial building design is maximizing the use of natural daylight to supplant electric
lighting in interior spaces. Natural light entering through windows and skylights is not only free,
but can also provide occupants with a feeling of connection to the outdoors. Moreover, when
properly designed to minimize direct beam penetration, the use of natural daylight provides the
most light for the least amount of internal heat gain an important quality given that even in
northern climates mechanical cooling of interior spaces is often needed for much of the year. The
dynamism of daylight provides visual and thermal comfort, but is also central to the regulation of
human circadian rhythms. Daylight enhances our mood and focus, improves immune system
function, and can even suppress drowsiness (Hootman 2012). Figure 2 will show office room
with daylighting.
7
Figure 2. Daylighting
Natural Ventilation: Natural ventilation is the process of supplying air to and removing air from
an indoor space without using mechanical systems. It refers to the flow of external air to an
indoor space as a result of pressure differences arising from natural forces. There are two types
of natural ventilation occurring in buildings: wind driven ventilation and buoyancy-driven
ventilation. Wind driven ventilation arises from the different pressures created by wind around a
building or structure, and openings being formed at the perimeter which then permit flow
through the building. Buoyancy-driven ventilation occurs as a result of the directional buoyancy
force that results from temperature differences between the interior and exterior. Since the
internal heat gains which create temperature differences between the interior and exterior are
created by natural processes including the heat from people, and wind effects are variable,
naturally ventilated buildings are sometimes called "breathing buildings" (Hootman 2012).
Figure 3 will give more idea about building with natural ventilation.
8
Figure 3. Natural Ventilation
3.2 Building Envelop
Building envelop plays a massive role in the implementation of passive strategies, and so should
be integrated with mechanical and electrical design. The building envelop is a critical element in
the energy performance of any building, but it is absolutely vital for the performance of net zero
buildings. This section will describe important element involved in building envelop and their
effects in energy performance.
Walls: Energy efficient walls are built to minimize heat transfer. The R value, the measure of a
material’s ability to stop the flow of heat is used to compare building material. The higher the R
value greater the material will protect against energy loss. The total R value of wall takes into
consideration all products from which wall is made. Insulation also plays an important role for
energy efficient building.
Thermally massive material have high density and a high specific heat capacity. Material such
as, concrete, stone, masonry and water have the capability to store heat and release heat back into
the environment once the ambient temperature cools. One of the primary benefits of thermal
mass is its capability to even out temperature swings in the interior environment. Thermal mass
9
can also be used on the exterior envelop in the hot climate as a means of showing down
temperature swings through the envelope (Hootman 2012).
Windows: When selecting windows for energy efficiency, it's important to first consider
their energy performance ratings in relation to climate and building design. A window's energy
efficiency is dependent upon all of its components. Frames conduct heat, contributing to a
window's overall energy efficiency, particularly its U-factor. Glazing or glass technologies have
become very sophisticated, and designers often specify different types of glazing or glass for
different windows, based on orientation, climate and building design (Haglund 2012). Figure 4
will give details of energy efficient window technology.
Figure 4 Window Technology
Another important consideration is how the windows operate, because some operating types
have lower air leakage rates than others, which will improve energy efficiency.
10
Single glazing is a very poor insulator, with an R-value of about 1 (equivalent to U-1). Increasing
the number of panes in a window improves the insulating value of the window, so clear double
glazing has an R-value of about 2 (equivalent to U-0.5), and clear triple glazing has an R-value
of about 3 (equivalent to U-0.33). The values for double or triple glazing can be further improved
by including one or two low-e coatings and an inert gas fill between the panes. The best double-
glazed windows have a whole-window U-factor of about 0.27, while the best triple-glazed
windows which are used in present simulation have a whole-window U-factor of about 0.17
(Haglund 2012).
Infiltration: Infiltration is the unintentional or accidental introduction of outside air into a
building, typically through cracks in the building envelope and through use of doors for passage.
Infiltration is sometimes called air leakage. The leakage of room air out of a building,
intentionally or not, is called exfiltration. Infiltration is caused by wind, negative pressurization
of the building, and by air buoyancy forces known commonly as the stack effect (Athienitis
2006).
Because infiltration is uncontrolled, and admits unconditioned air, it is generally considered
undesirable except for ventilation air purposes. Typically, infiltration is minimized to reduce
dust, to increase thermal comfort, and to decrease energy consumption. For all buildings,
infiltration can be reduced via sealing cracks in a building's envelope, and for new construction
or major renovations, by installing continuous air retarders. In buildings where forced ventilation
is provided, their HVAC designers typically choose to slightly pressurize the buildings by
admitting more outside air than exhausting so that infiltration is dramatically reduced (Athienitis
2006).
Reduced air infiltration combined with proper ventilation cannot only reduce energy bills, but it
can also improve the quality of indoor air. Outdoor air that leaks indoor makes it difficult to
maintain comfort and energy efficiency. As per Department of Energy (DOE) air leakage
accounts for 25–40% of the energy used for heating and cooling in a typical building (Athienitis
2006).
3.3 Mechanical Systems
The design of energy efficient building systems or mechanical systems for a net zero energy
project is depends upon the passive architecture of the building. For most commercial building
types, we cannot expect climate responsive architecture with passive strategies to meet all the
desired interior function of the light, comfort, air quality and hot water all the time. Mechanical
systems required to provide these functions when passive strategies alone are insufficient
(Collyer 2012). This section includes a brief discussion of mechanical systems in conventional
and new construction buildings.
11
3.3.1 Conventional Mechanical Systems
For heating in conventional buildings boilers are used to generate steam or hot water and can be
fired by natural gas, fuel oil, or coal. Their combustion efficiencies varies from 78% to 86%.
Furnaces can be used for residential and small commercial heating systems. Furnaces use natural
gas, fuel oil, and electricity for the heat source. Natural gas furnaces are available in condensing
and non-condensing models (Graham 2014).
In large commercial and institutional buildings, devices used to produce cool water are called
chillers. The water is pumped to air handling units to cool the air. They use either mechanical
refrigeration processes or absorption processes. Mechanical refrigeration chillers may have one
or more compressors. These compressors can be powered by electric motors, fossil fuel engines,
or turbines. Absorption chillers are heat-operated devices that produce chilled water via an
absorption cycle. Absorption chillers can be direct-fired, using natural gas or fuel oil, or indirect-
fired. Large and medium-sized air-cooled electric chillers have 0.95-0.85 kW/ton (COP of 3.7 to
4.1) (Graham 2014).
3.3.2 Heat Pumps
For climates with moderate heating and cooling needs, heat pumps offer an energy-efficient
alternative to furnaces and air conditioners. Like refrigerators, heat pumps use electricity to
move heat from a cool space to a warm space, making the cool space cooler and the warm space
warmer. During the heating season, heat pumps move heat from the cooler outdoors into the
warmer environment and during the cooling season, heat pumps move heat from cooler
environment into the warm outdoors. Because they move heat rather than generate heat, heat
pumps can provide equivalent space conditioning at as little as one quarter of the cost of
operating conventional heating or cooling appliances (Energy 2008). Classifications and
operations of heat pumps are described in the following sections.
Air Source Heat Pumps
An air-source heat pump can provide efficient heating and cooling for the home. When properly
installed, an air-source heat pump can deliver one-and-a-half to three times more heat energy to a
home than the electrical energy it consumes. This is possible because a heat pump moves heat
rather than converting it from a fuel like combustion heating systems do (Energy 2008).
Air-source heat pumps have been used for many years in nearly all parts of the United States, but
until recently they have not been used in areas that experienced extended periods of subfreezing
temperatures. However, in recent years, air-source heat pump technology has advanced so that it
now offers a real space heating alternative in colder regions (Energy 2008).
12
Ground Source Heat Pump
Geothermal heat pumps (GSHPs), sometimes referred to as GeoExchange, earth-coupled,
ground-source, or water-source heat pumps, have been in use since the late 1940s. They use the
constant temperature of the earth as the exchange medium instead of the outside air temperature.
This allows the system to reach fairly high Coefficient of Performance (COP) on the coldest
winter nights, compared to air-source heat pumps on cool days (Energy 2008).
Although many parts of the country experience seasonal temperature extremes -- from burning
heat in the summer to sub-zero cold in the winter. A few feet below the earth's surface the
ground remains at a relatively constant temperature. Depending on latitude, ground temperatures
range from 45°F (7°C) to 75°F (21°C). Like a cave, this ground temperature is warmer than the
air above it during the winter and cooler than the air in the summer. The GSHPs takes advantage
of this by exchanging heat with the earth through a ground heat exchanger (Energy 2008).
As with any heat pump, geothermal and water-source heat pumps are able to heat, cool, and, if so
equipped, supply the building with hot water. Relative to air-source heat pumps, they are quieter,
last longer, need little maintenance, and do not depend on the temperature of the outside air
(Energy 2008).
A dual-source heat pump combines an air-source heat pump with a geothermal heat pump. These
appliances combine the best of both systems. Dual-source heat pumps have higher COP than air-
source units, but are not as efficient as geothermal units. The main advantage of dual-source
systems is that they cost much less to install than a single geothermal unit, and work almost as
well (Energy 2008).
Even though the installation price of a geothermal system can be several times that of an air-
source system of the same heating and cooling capacity, the additional costs are returned as
energy savings in 5 to 10 years. System life is estimated at 25 years for the inside components
and 50+ years for the ground loop. There are approximately 50,000 geothermal heat pumps
installed in the United States each year (Energy 2008).
There are four basic types of ground loop systems. Three of these -- horizontal, vertical, and
pond/lake -- are closed-loop systems. The fourth type of system is the open-loop option. Which
one of these is best depends on the climate, soil conditions, available land, and local installation
costs at the site (Energy 2008). During a given modeling simulation project, closed loop vertical
system is used. All of these approaches can be used for residential and commercial building
applications.
13
Ground Loop
Most closed-loop geothermal heat pumps circulate an antifreeze solution through a closed loop
usually made of plastic tubing that is buried in the ground or submerged in water. A heat
exchanger transfers heat between the refrigerant in the heat pump and the antifreeze solution in
the closed loop. The loop can be in a horizontal, vertical, or pond/lake configuration (Energy
2008).
One variant of this approach, called direct exchange, does not use a heat exchanger and instead
pumps the refrigerant through copper tubing that is buried in the ground in a horizontal or
vertical configuration. Direct exchange systems require a larger compressor and work best in
moist soils (sometimes requiring additional irrigation to keep the soil moist), should avoid
installing in soils corrosive to the copper tubing. Because these systems circulate refrigerant
through the ground, local environmental regulations may prohibit their use in some locations
(Energy 2008).
Horizontal Ground Loop
This type of installation is generally more cost-effective for residential installations, particularly
for new construction where sufficient land is available. It requires drains at least four feet deep.
The most common layouts either use two pipes, one buried at six feet, and the other at four feet,
or two pipes placed side-by-side at five feet in the ground in a two-foot wide trench (Energy
2008). Figure 5 will show closed loop horizontal system arrangements.
Figure 5. Horizontal Closed loop Ground Source Heat pump System
14
Vertical Ground Loop
Large commercial buildings and schools often use vertical systems because the land area
required for horizontal loops would be prohibitive. Vertical loops are also used where the soil is
too shallow for trenching, and they minimize the disturbance to existing landscaping. For a
vertical system, holes (approximately four inches in diameter) are drilled about 20 feet apart and
100 to 400 feet deep. Into these holes go two pipes that are connected at the bottom with a U-
bend to form a loop. The vertical loops are connected with horizontal pipe (i.e., manifold),
placed in trenches, and connected to the heat pump in the building (Energy 2008). Figure 6 will
show vertical closed loop system arrangements.
Figure 6. Vertical Closed loop Ground Source Heat pump System
Pond/Lake Loop
If the site has a sufficient water body, this may be the lowest cost option. A supply line pipe is
run underground from the building to the water and coiled into circles at least eight feet under
the surface to prevent freezing. The coils should only be placed in a water source that meets
minimum volume, depth, and quality criteria (Energy 2008). Figure 7 will show closed loop
pond/lake arrangements.
15
Figure 7. Pond/Lake Closed loop Ground Source Heat pump System
Open loop Systems
This type of system uses well or surface body water as the heat exchange fluid that circulates
directly through the ground heat pump system. Once it has circulated through the system, the
water returns to the ground through the well, a recharge well, or surface discharge. This option is
obviously practical only where there is an adequate supply of relatively clean water, and all local
codes and regulations regarding groundwater discharge are met (Energy 2008). Figure 8 will
show open loop system arrangements.
16
Figure 8. Open Loop Ground Source Heat Pump
Hybrid Systems
Hybrid systems using several geothermal resources, or a combination of a geothermal resource
with outdoor air (i.e., a cooling tower), are another technology option. Hybrid approaches are
particularly effective where cooling needs are significantly larger than heating needs. Where
local geology permits, the "standing column well" is another option. In this variation of an open-
loop system, one or more deep vertical wells are drilled. Water is drawn from the bottom of a
standing column and returned to the top. During periods of peak heating and cooling, the system
can bleed a portion of the return water rather than re-injecting it all, causing water inflow to the
column from the surrounding aquifer. The bleed cycle cools the column during heat rejection,
heats it during heat extraction, and reduces the required bore depth (Energy 2008).
3.4 Domestic Hot Water
In conventional commercial buildings hot water is used for space heating and domestic hot
water, and energy consumption for heating the water in commercial building is less as compare
to other facilities like hotels, restaurants. Here ground source heat pump is used to heat water
used for space heating and for domestic hot water.
17
Low Energy Hot Water:
The following ideas can save energy used to produce hot water (Hootman 2012).
Minimize water consumption is the best approach to reducing energy use. Installing low flow hot
water fixtures and appliances is good way to reduce the amount of water consumption (Hootman
2012).
Using Heat pump instead of boilers or electric heater. As per research heat pump are more
efficient than boilers and electric heater (Hootman 2012).
In domestic hot water, placing the heater close to the sink by using point of use water heater
(Hootman 2012).
Using a hot water recirculation loop with a close connection of the point of use (Hootman 2012).
Grouping hot water fixtures close to heater locations (Hootman 2012).
3.5 Lighting Systems
Lighting power density (LPD) limits are a major part of all current building energy codes. LPD
sets maximum limit for the installed power over a specified area which is expressed in Watts per
Square Foot (W/ft2). The LPD limit values found in energy codes are typically based on a space-
type lighting model systems consisting currently available lighting product characteristics, light
loss factors, building construction data, and professional design experience. These factors are
used to calculate appropriate values for each building space type (Codes 2012). This Section
includes description of indoor and outdoor lighting controls.
Indoor Lighting Control
Interior lighting is one of the largest electricity energy end-uses in many commercial buildings
and controls can have a significant effect on their energy use. Interior lighting controls give
occupants control over the electric lighting in a space, and can be used to manage building
lighting automatically. Effectively controlling the space lighting results not only in occupant
comfort, but also in energy savings. Efficient lamps and light fixtures reduce the total installed
lighting power whereas controls generally reduce the amount of lighting used or the amount of
time for which lighting is used. Lighting controls can be classified as those required across the
entire building and those that must be applied space by space (Codes 2012).
18
Manual Control
The basic control provided in all spaces is a wall switch that allows occupants to turn general
lighting on and off. This manual control device must be easily accessible and must be located
such that the lights it controls are seen easily from the control location. Manual controls provide
a minimum level of comfort for occupants. Manual control is not required in spaces such as
corridors, stairwells, or other spaces where turning the lights off would be damaging for entry
and security (Codes 2012).
Under ASHRAE Standard 90.1, for spaces smaller than 10,000 Sqft, one manual control device
is required for every 2,500 Sqft. For spaces larger than 10,000 Sqft, one manual control device is
required for every 10,000 Sqft (Codes 2012).
Automatic Shutoff Control
On/off controls and lighting reduction controls are manual controls that are needed in most
spaces. However, these controls rely on occupants to obtain energy savings. There is no
guarantee that these controls will save energy. When occupants are not present in a space and
during the night, there is ample opportunity to turn lights off. Automatic lighting controls are
required to control the lighting during these unoccupied periods. Automatic controls also
guarantee energy savings from lighting (Codes 2012).
Energy codes require that all building spaces be controlled by an automatic control device that
shuts off general lighting. This control device must turn off lights in response to a time-based
operation schedule, occupancy sensors that detect the absence of the occupants, or a signal from
the building’s energy management system or some other system that indicates that the space is
empty (Codes 2012).
In ASHRAE Standard 90.1, the occupant must be able to reduce the lighting power to between
30% and 70% of full power using the manual control device. The International Energy
Conservation Code (IECC) requires this stepped reduction to be lower than or equal to 50% of
full power. Spaces such as corridors, stairways, electrical/mechanical rooms, public lobbies,
restrooms, storage rooms, and sleeping units are exempted. Also exempted are spaces with only
one luminaire with a rated power of less than 100 W and spaces with an LPD allowance of less
than 0.6 W/ft2. The IECC exempts areas within spaces that are controlled either by an occupancy
sensor or by daylighting controls (Codes 2012).
Exterior lighting control
The following controls are required by ASHRAE Standard 90.1.
• Building façade and landscape lighting is required to be shut off between midnight or
business closing, whichever is later, and 6 a.m. or business opening, whichever is earlier.
The façade and landscape lighting at this building must be turned off from 2 a.m. through
6 a.m. (Codes 2012)
19
• All other lighting must be reduced by at least 30% of full power using either occupancy
sensors to turn lights off within 15 minutes of sensing zero occupancy, or from midnight
or one hour from close of business, whichever is later, until 6 a.m. or business opening,
whichever is earlier (Codes 2012).
4. Renewable Energy
Renewable energy is generally defined as energy that comes from resources which are naturally
replenished on a human timescale, such as sunlight, wind, rain, tides, waves, and geothermal
heat. Renewable energy replaces conventional fuels in four distinct areas: electricity generation,
air and water heating/cooling, motor fuels, and rural (off-grid) energy services. To that end, this
topic provides general guidance on planning renewable energy systems for net zero energy
buildings, with focus on early planning and concepts needed to achieve effective integration into
a net zero energy building (Hootman 2012). This topic heavily leans on solar electricity from
photovoltaic systems as an important source of renewable energy for net zero energy buildings
and brief discussion on solar water heating.
4.1 Solar Electric Generation
Solar power is the conversion of sunlight into electricity, either directly using photovoltaics
(PV), or indirectly using Concentrated Solar Power (CSP). Concentrated solar power systems use
lenses or mirrors and tracking systems to focus a large area of sunlight into a small beam.
Photovoltaics convert light into an electric current using the photovoltaic effect (Hootman 2012).
A photovoltaic or PV system, is a powerful system designed to supply usable solar power by
means of photovoltaics. It consists of an arrangement of several components, including solar
panels to absorb and convert sunlight into electricity, a solar inverter to change the electric
current from DC to AC, as well as mounting, cabling and other electrical accessories to set up a
working system. It may also use a solar tracking system to improve the system's overall
performance and include an integrated battery solution, as prices for storage devices are expected
to decline PV systems range from small, rooftop-mounted or building-integrated systems with
capacities from a few to several tens of kilowatts, to large utility-scale power stations of
hundreds of megawatts. Nowadays, most PV systems are grid-connected, while off-grid or stand-
alone systems only account for a small portion of the market (Hootman 2012). Classification of
solar cells briefly describes in following section.
Monocrystalline Solar Cells
This type of solar cell is made from thin wafers of silicon cut from artificially grown crystals.
These cells are created from single crystals grown in isolation, making them the most expensive
of the three varieties (approximately 35% more expensive than equivalent polycrystalline cells),
20
but they have the highest efficiency rating between 15-24% (Hootman 2012). Monocrystalline
Silicon is used in this project.
Polycrystalline Solar Cells
This type of solar cell is also made from thin wafers of silicon cut from artificially grown
crystals, but instead of single crystals, these cells are made from multiple interlocking silicon
crystals grown together, hence they are cheaper to produce, but their efficiency is lower than the
monocrystalline Solar cells, currently at 13-18% (Hootman 2012).
Thin Film Solar Cells
These are the cheapest type of solar cell to produce, are relatively new to market and are
produced very differently to the two other types. Instead of using crystals, Silicon is deposited
very thinly on a backing substrate. There are two real benefits of the amorphous solar cell; firstly
the layer of silicon is so thin it allows the solar cells to be flexible and secondly, they are more
efficient in low light levels (like during winter). This however comes at a price; they have the
lowest efficiency rating of all three types – approximately 7% – 9%, requiring approximately
double the panel area to produce the same output. In addition, as this is a relatively new science,
there is no agreed industry wide production technique, so they are not as robust as the other two
types (Hootman 2012).
Array Sizing and Energy Calculation
There is an online tool which is very user friendly called PV Watts. This tool is supported by the
National Renewable Laboratory (NREL). The calculator estimates the electricity production of a
grid-connected roof- or ground-mounted photovoltaic system based on a few simple inputs. To
use the calculator, type the address or geographic coordinates of the system's location, specify
the system size and array orientation, and provide some information about the system's cost and
electricity rates. PV Watts calculates estimated values for the system's annual, monthly and
hourly electricity production, and for the monetary value of the electricity. (NREL 2011)
4.2 Solar Water Heating
Solar water heating (SWH) is the conversion of sunlight into renewable energy for water
heating using a solar thermal collector. Solar water heating systems consist of various
technologies that are increasingly used worldwide. Since solar water heating is not included in
the target simulated buildings, they are not discussed in this report.
21
5. Plug Loads and Occupancy
Plug and process loads (PPLs) account for 33% of U.S. commercial building electricity
consumption (McKenney, et. al. 2010). Minimizing these loads is a significant challenge in the
design and operation of an energy-efficient building. (Lobato et al. 2011). (Lobato et al. 2012)
define PPLs as energy loads that are not related to general lighting, heating, ventilation, cooling,
and water heating, and that typically do not provide comfort to the occupants. The percentage of
total building energy use from PPLs is increasing. According to the U.S. Department of Energy
(DOE), by 2030, commercial building energy consumption is expected to increase by 24%; PPL
energy consumption is anticipated to increase by 49% in the same time frame (DOE 2010).
These trends illustrate the importance of PPL energy reduction to achieve an overall goal of
reducing whole-building energy consumption (Griffith 2007). Figure 9 will show commercial
building energy use breakdown.
Figure 9. Commercial Building Energy Use Breakdown (Griffith 2007)
Occupant Behavior
Occupant behavior affects the building energy use directly and indirectly by opening/closing
windows, turning on/off or dimming lights, turning on/off office equipment, turning on/off
heating, ventilation, and air-conditioning (HVAC) systems, and setting indoor thermal, acoustic,
and visual comfort criteria. Measured energy use of buildings demonstrated large discrepancies
even between buildings with same functions and located in similar climates. Among various
factors contributing to the discrepancies, occupant behavior is a driving factor. Occupant
behavior is also one of the most significant sources of uncertainty in the prediction of building
energy use by simulation programs due to the complexity and inherent uncertainty of occupant
behavior. With the trend towards low energy buildings that reduce fossil fuel use and carbon
22
emissions, getting occupants actively involved during the design and operation of buildings is a
key to achieving high energy performance without scarifying occupant comfort or productivity.
Pilot projects demonstrated that low energy systems, such as natural ventilation, shading to
control solar heat gains and glare, daylighting to dim lights, and demand controlled ventilation,
especially need the interactions and collaborations of occupants. Energy savings from 5 to 30%
were achieved by behavioral studies that motivate changes to occupant behavior (Tianzhen Hong
2013).
6. Modeling Simulation Results
This section includes, conventional and new building specifications, description of modeling
tools used in the project, building validation, which contains my simulation approach and tabular
inputs used for baseline buildings and energy efficient buildings. It also includes simulation
results for new buildings, older buildings and their comparison.
6.1 Building Specification
• Building Type: Office buildings
• Occupancy: 100Sqft/person
• Area: 50,000 Sqft and 100,000 SqFt
• Location: Phoenix, AZ, San Jose, CA, Chicago, IL
• Baseline: ASHRAE 90.1 2013, California Title 24 2013
• Modeling Tool: eQuest by Department of Energy
• Renewable Tool: PV Watts by NREL
• Internal Loads: Task lighting, area lighting, miscellaneous loads, and occupancy
• Miscellaneous Loads: Cooking equipment’s, plug loads, and computer server
Building Schematic
Figure 10. Building Schematic
23
In new construction for heating and cooling, ground source vertical closed loop heat pump is
used. Due to use of a ground source heat pump, there is only electrical energy consumption in
the building. The following energy efficient techniques used in the simulation. Default values in
eQuest have been selected for energy efficient features.
• Daylighting
• Natural ventilation
• Energy efficient building envelop
• Energy efficient lighting and plug loads
• Variable frequency drives
• Ground source heat pump for heating and cooling
• Ground source heat pumps for domestic hot water
Conventional construction, which is built in 1980s uses chillers and boilers for cooling and
heating. HVAC System type is multi zone air handler with hot water heating. No energy
efficiency techniques were used. Following are the details.
• No daylighting
• No natural ventilation
• Building envelop as per CA Title 24 1980 for location in California and ASHRAE 90.1
1980 for other locations
• Lighting and plug loads as per CA Title 24 1980 for location in California and ASHRAE
90.1 1980 for other locations
• No variable frequency drives
• Both electrical and natural gas consumption in the building. Natural gas used for both
domestic hot water and space heating
For sizing of solar array following parameters were used.
• DC system size depends on roof area of buildings. Calculated as, Size (kW) = Array Area
(m²) × 1 kW/m² × Module Efficiency (%)
• Monocrystalline PV module
• Fixed array type
• Array tilt 20 degree
• Azimuth angle 180 degree
• 60% of building roof area is covered with Solar array
Note: For a fixed array, the azimuth angle is the angle clockwise from true north describing the
direction that the array faces. An azimuth angle of 180° is for a south-facing array, and an
azimuth angle of zero degrees is for a north-facing array. All the new buildings are south facing
azimuth angle will be 180 degree for south facing array.
24
6.2 Modeling Tool
eQuest is designed to provide whole building performance analysis to buildings professionals,
i.e., owners, designers, operators, utility and regulatory personnel, and educators. Whole building
analysis recognizes that building is a system of systems and that energy responsive design is a
creative process of integrating the performance of interacting systems, e.g., envelop, fenestration,
lighting, HVAC, and domestic hot water (Hirsch 2012).
PV Watts Online Tool
PV Watts estimates the energy production and cost of energy of grid-connected photovoltaic
(PV) energy systems throughout the world. It allows homeowners, small building owners,
installers and manufacturers to easily develop estimates of the performance of potential PV
installations. PV Watts calculates estimated values for the system's annual, monthly and hourly
electricity production, and for the monetary value of the electricity (NREL 2011).
6.3 Building Specifications
Approach
• Modeled one floor baseline buildings with area of 50,000 and 100,000 Sqft
• Applying ASHRAE 90.1 2013 and CA Title 24 2013 standards and found out annual
electrical energy consumption
• Modeled same baseline buildings for three different locations; San Jose, CA, Phoenix,
AZ, Chicago, IL and found out annual electrical consumption
• Applying energy efficient techniques to baseline building to make it energy efficient
buildings and derived annual electrical consumption for three different locations
• By utilizing PV Watts online tool for sizing the solar array, derived electrical energy
production for one floor energy efficient buildings for all three locations
• Determined electrical energy consumption by gradually increasing floors for energy
efficient buildings for all three different locations
• Simultaneously sizing solar array for different floors to find out electrical energy
production
• After finding electrical energy consumption and production for different floors and
locations, the main aim is to determine maximum number of floors that can be built to
make net zero site energy using roof mounted solar PV.
Tabular Inputs for New Construction
Table 6-1 shows different inputs used in eQuest for baseline building, Energy Efficient
techniques and Net Zero Energy for different locations.
25
Table 6-1 Tabular inputs used in eQuest for baseline building, Energy Efficient techniques and
Net Zero Energy for different locations (San Jose, CA Chicago, IL and Phoenix, AZ)
Components Baseline Energy
Efficiency
Techniques
Net Zero Energy
Cooling: DX Coil EER: 10.4
(ASHRAE 90.1),
EER: 13.4 (B.
Griffith, 2007)
EER: 13.4 (B. Griffith,
2007)
EER: 9.6 (CA
Title 24)
Heating: Ground
Source Heat
pump
COP: 3.1
(ASHRAE 90.1),
COP: 4.2 (B.
Griffith, 2007)
COP: 4.2 (B. Griffith,
2007)
COP: 2.9 (CA
Title 24)
Variable Volume
Fan
Efficiency: 50%
(ASHRAE 90.1)
Efficiency: 70%
(B. Griffith, 2007)
Efficiency: 70% (B.
Griffith, 2007)
Efficiency: 50%
(ASHRAE 90.1)
Domestic Hot Water
Heater Fuel Electricity Electricity Electricity
Heater Type Heat pump Heat pump Heat pump
COP 7 (ASHRAE
90.1)
7 (ASHRAE
90.1)
7 (ASHRAE 90.1)
7 (CA Title 24) 7 (CA Title 24) 7 (CA Title 24)
Ground Source Heat pump
GSHP loop Head 71.6 ft.(ASHRAE
90.1)
71.6 ft.
(ASHRAE 90.1)
71.6 ft. (ASHRAE 90.1)
71.6 ft. (CA Title
24)
71.6 ft. (CA Title
24)
71.6 ft. (CA Title 24)
Ground Heat
Exchange (GHX)
type
Vertical well Vertical well Vertical well
Loop temp: 30 F min and 110
F Max (ASHRAE
90.1)
30 F min and 110
F Max (ASHRAE
90.1)
30 F min and 110 F Max
(ASHRAE 90.1)
Continued on the following page
26
30 F min and 110
F Max (CA Title
24)
30 F min and 110
F Max (CA Title
24)
30 F min and 110 F Max.
(CA Title 24)
Loop Flow Constant with no
Variable speed
drive (VSD)
Variable with
Variable speed
drive (VSD)
Variable with variable
speed drive (VSD)
Building Envelop
Window to wall
ratio
52.3% (ASHRAE
90.1)
30% (B. Griffith,
2007)
30% (B. Griffith, 2007)
52.3% (CA Title
24)
Window Glass
Type
Double clear
(ASHRAE 90.1)
Triple clear /Tint
(B. Griffith, 2007)
Triple clear /Tint (B.
Griffith, 2007)
Double clear (CA
Title 24)
Vertical Glazing
with U Factor
0.57 (ASHRAE
90.1) Btu/h.Ft2.F,
0.40 (B. Griffith,
2007) Btu/h.Ft2.F
0.40 (B.
Griffith,2007)Btu/h.Ft2.F
0.59 Btu/h.Ft2.F
(CA Title 24)
Steel Frame wall
U Factor
0.084 (ASHRAE
90.1) Btu/h.Ft2.F,
0.064 (B. Griffith,
2007) Btu/h.Ft2.F
0.064 (B. Griffith, 2007)
Btu/h.Ft2.F
0.082 Btu/h.Ft2.F,
(CA Title 24)
Roof Metal frame 0.055 Btu/h.Ft2.F
(ASHRAE 90.1),
0.065 Btu/h.Ft2.F
(CA Title 24)
0.023 Btu/h.Ft2.F
(B. Griffith, 2007)
0.023 Btu/h.Ft2.F (B.
Griffith, 2007)
Floors wood
Framed
0.051 Btu/h.Ft2.F
(ASHRAE 90.1),
0.047 Btu/h.Ft2.F
(B. Griffith, 2007)
0.047 Btu/h.Ft2.F (B.
Griffith, 2007)
0.071 Btu/h.Ft2.F
(CA Title 24)
Windows Double Pane
(ASHRAE 90.1)
Triple pane Triple pane
Double Pane (CA
Title 24)
Continued on the following page
27
Lighting Systems
Area Lighting Fluorescent light Fluorescent light Fluorescent light
Office 1.10 W/Ft2
(ASHRAE 90.1)
0.5 W/Ft2 (B.
Griffith, 2007)
0.5 W/Ft2 (B. Griffith,
2007)
1.10 W/Ft2 (CA
Title 24)
Corridor 0.66 W/Ft2
(ASHRAE 90.1)
0.5 W/Ft2 (B.
Griffith, 2007)
0.5 W/Ft2 (B. Griffith,
2007)
0.66 W/Ft2 (CA
Title 24)
Lobby 1.30 W/Ft2
(ASHRAE 90.1)
0.5 W/Ft2 (B.
Griffith, 2007)
0.5 W/Ft2 (B. Griffith,
2007)
1.10 W/Ft2 (CA
Title 24)
Rest rooms 0.98 W/Ft2
(ASHRAE 90.1)
0.7 W/Ft2 (B.
Griffith, 2007)
0.7 W/Ft2 (B. Griffith,
2007)
0.98 W/Ft2 (CA
Title 24)
Conference
rooms
1.30 W/Ft2
(ASHRAE 90.1)
0.6 W/Ft2 (B.
Griffith, 2007)
0.6 W/Ft2 (B. Griffith,
2007)
1.40 W/Ft2 (CA
Title 24)
Mechanical/
Electrical room
1.50 W/Ft2
(ASHRAE 90.1)
0.5 W/Ft2 (B.
Griffith, 2007)
0.5 W/Ft2 (B. Griffith,
2007)
0.70 W/Ft2 (CA
Title 24)
Computer Server
Room
1.50 W/Ft2
(ASHRAE 90.1)
1.1 W/Ft2 (B.
Griffith, 2007)
1.1 W/Ft2 (B. Griffith,
2007)
0.70 W/Ft2 (CA
Title 24)
Miscellaneous
load
0.75 W/Ft2
(Default eQuest)
0.6 W/Ft2 (B.
Griffith, 2007)
0.6 W/Ft2 (B. Griffith,
2007)
Continued on the following page
28
Passive architecture
Day lighting No Yes with Day
lighting Sensors
Yes with Day lighting
Sensors
Occupancy
sensors
No Yes Yes
Natural
Ventilation
No Yes Yes
Night Purge
ventilation
No Yes Yes
Waste Heat
Recovery
No Yes Yes
6.4 Modeling Results
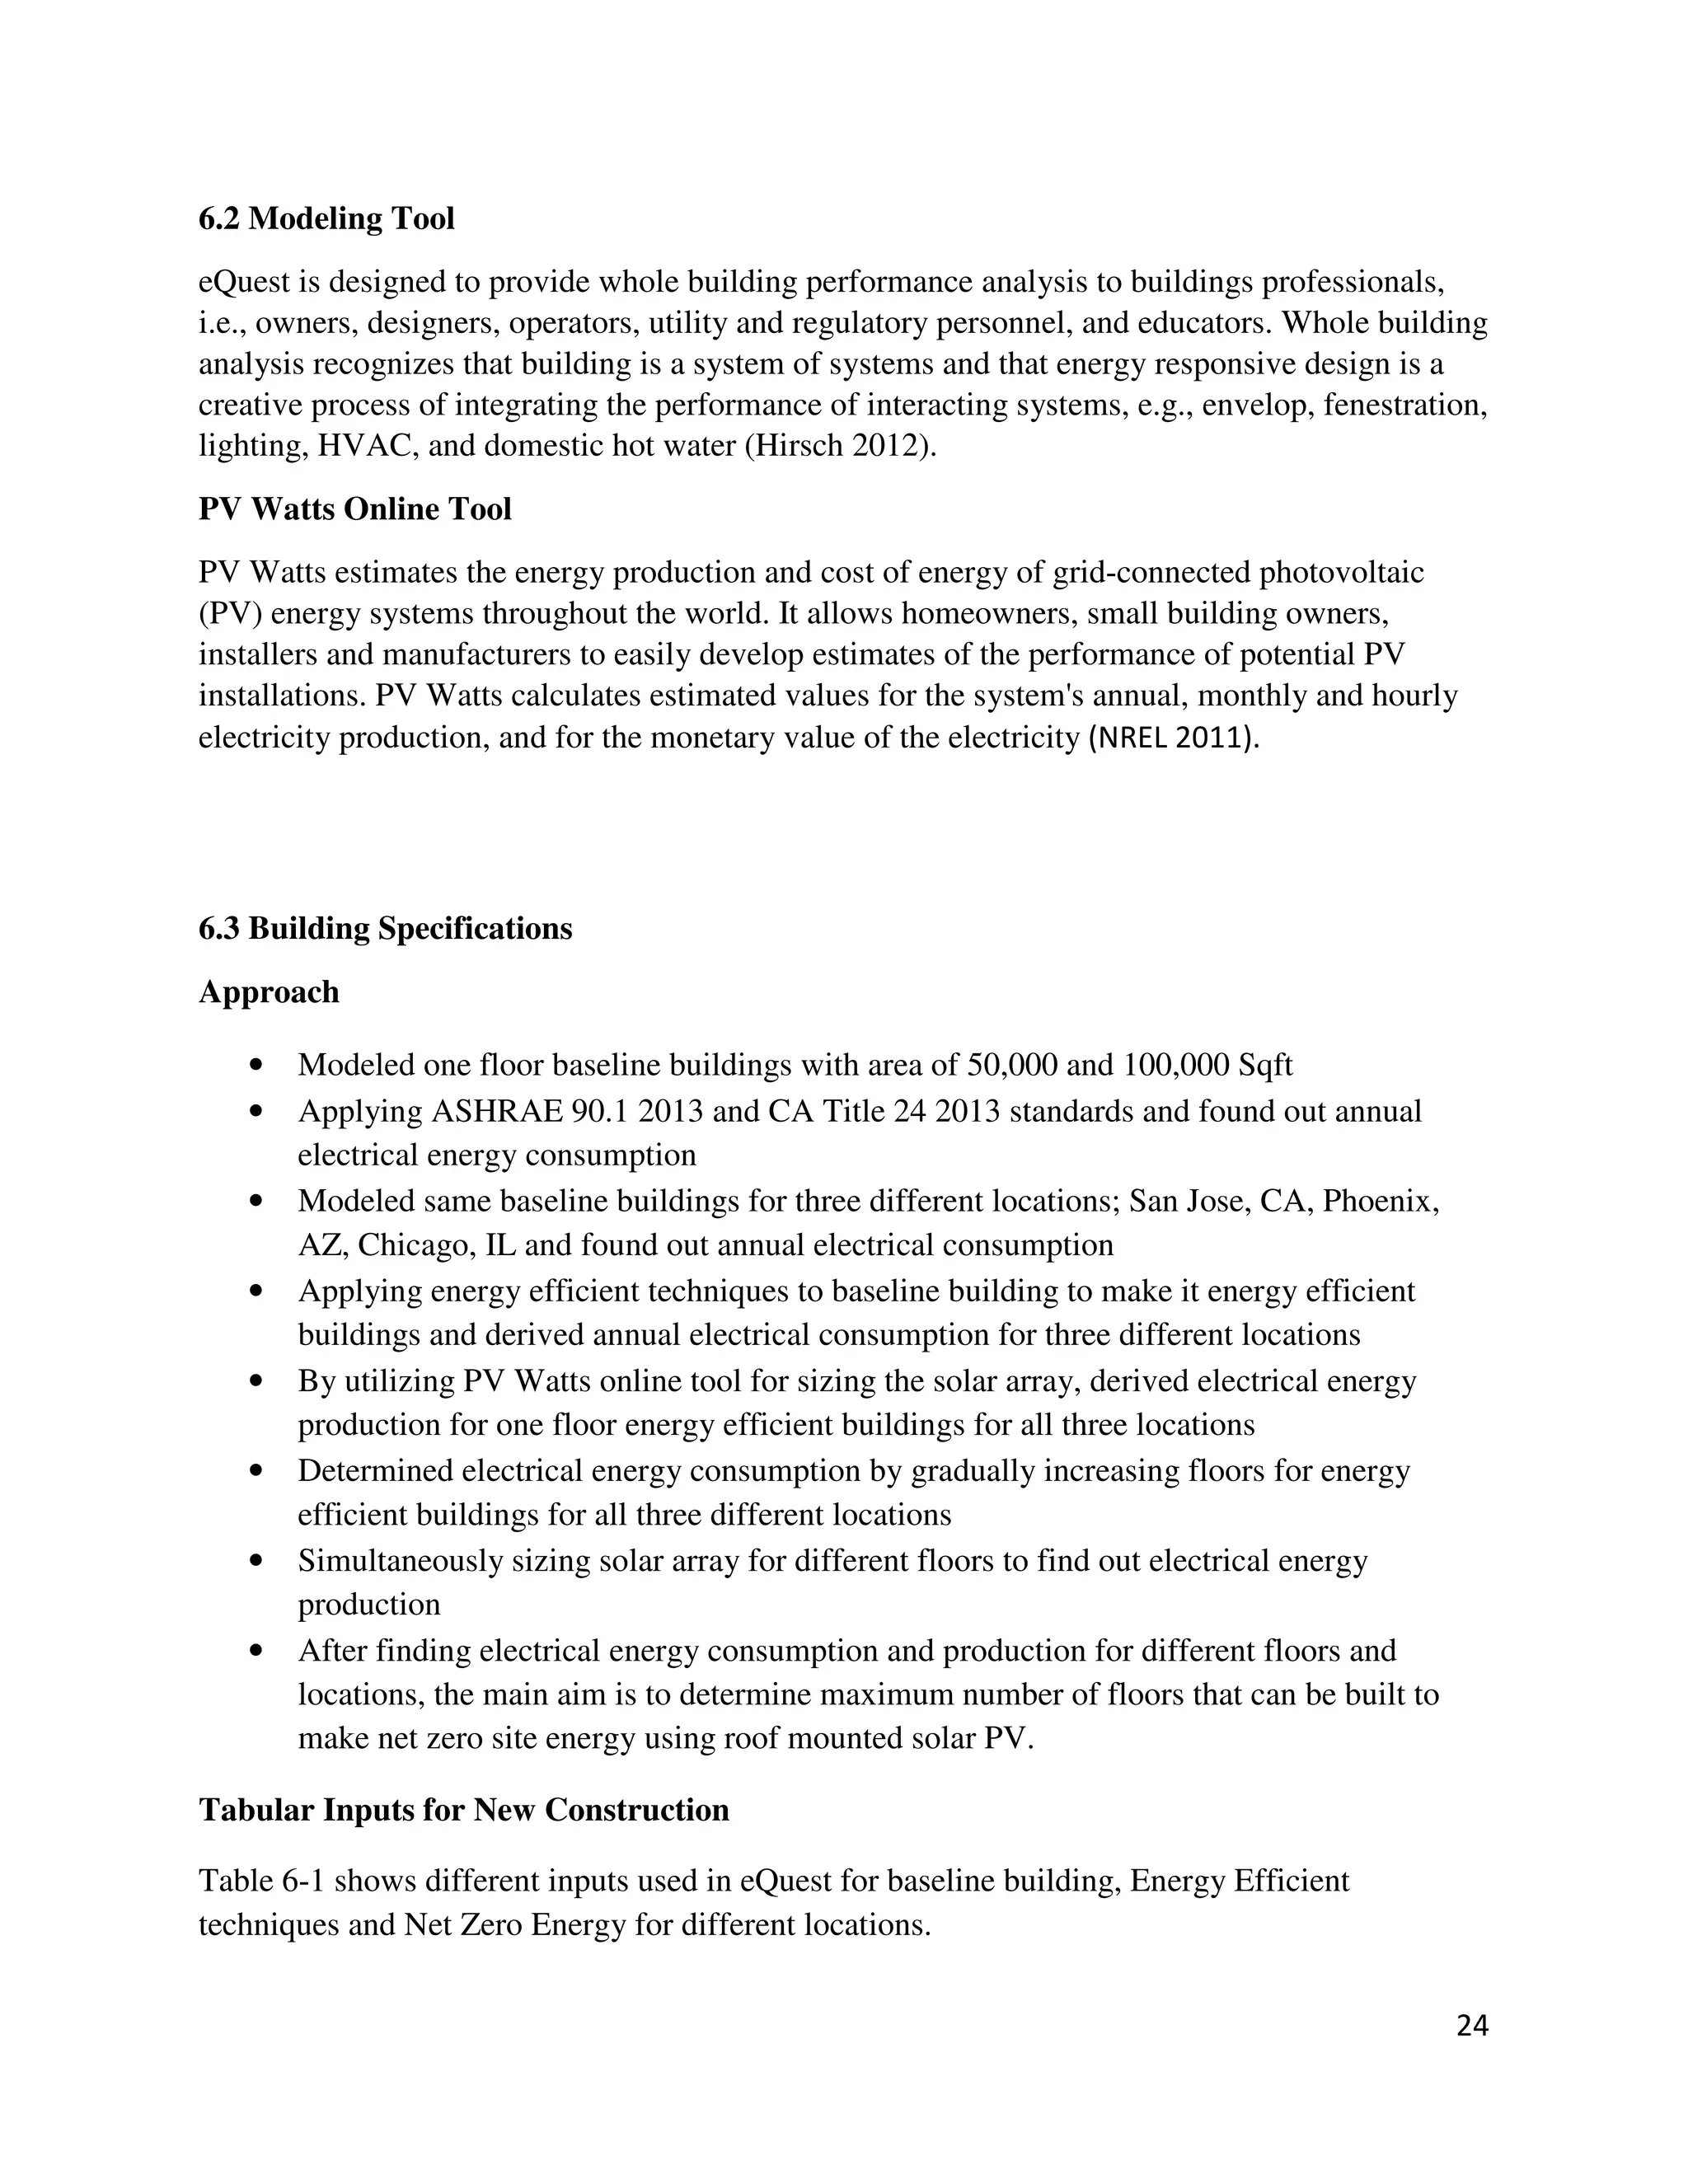
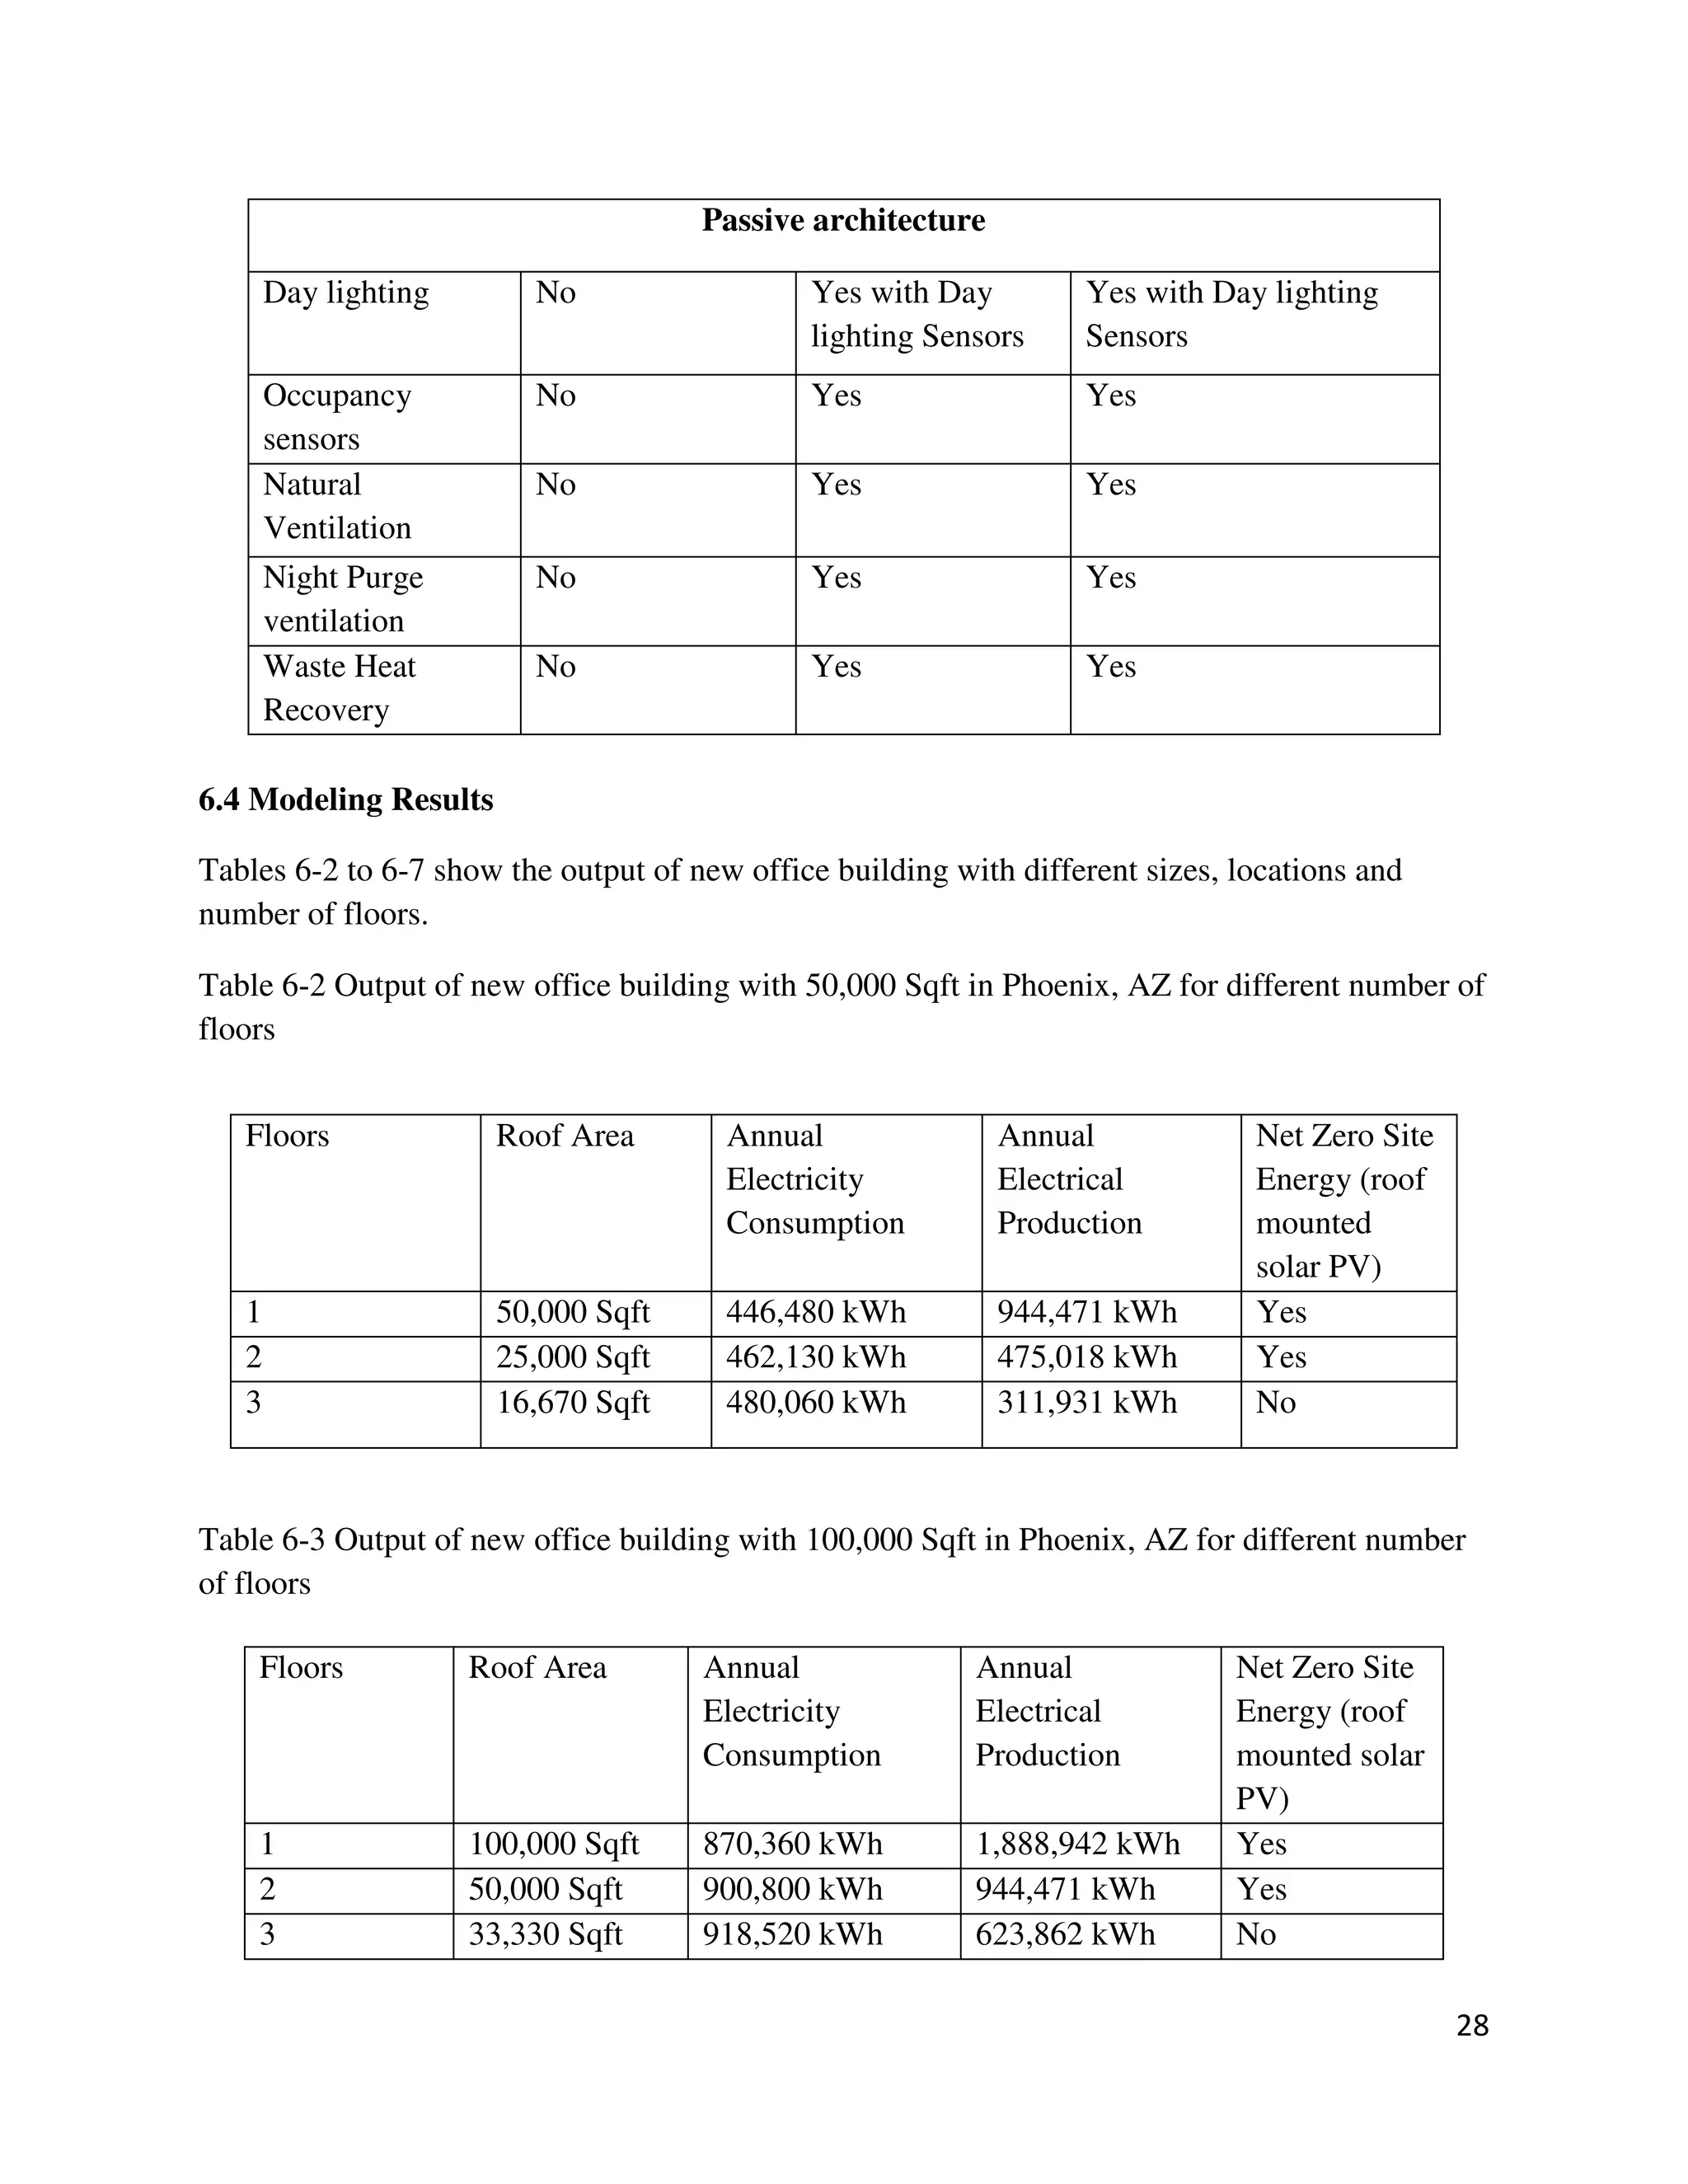
Tables 6-2 to 6-7 show the output of new office building with different sizes, locations and
number of floors.
Table 6-2 Output of new office building with 50,000 Sqft in Phoenix, AZ for different number of
floors
Table 6-3 Output of new office building with 100,000 Sqft in Phoenix, AZ for different number
of floors
Floors Roof Area Annual
Electricity
Consumption
Annual
Electrical
Production
Net Zero Site
Energy (roof
mounted
solar PV)
1 50,000 Sqft 446,480 kWh 944,471 kWh Yes
2 25,000 Sqft 462,130 kWh 475,018 kWh Yes
3 16,670 Sqft 480,060 kWh 311,931 kWh No
Floors Roof Area Annual
Electricity
Consumption
Annual
Electrical
Production
Net Zero Site
Energy (roof
mounted solar
PV)
1 100,000 Sqft 870,360 kWh 1,888,942 kWh Yes
2 50,000 Sqft 900,800 kWh 944,471 kWh Yes
3 33,330 Sqft 918,520 kWh 623,862 kWh No
29
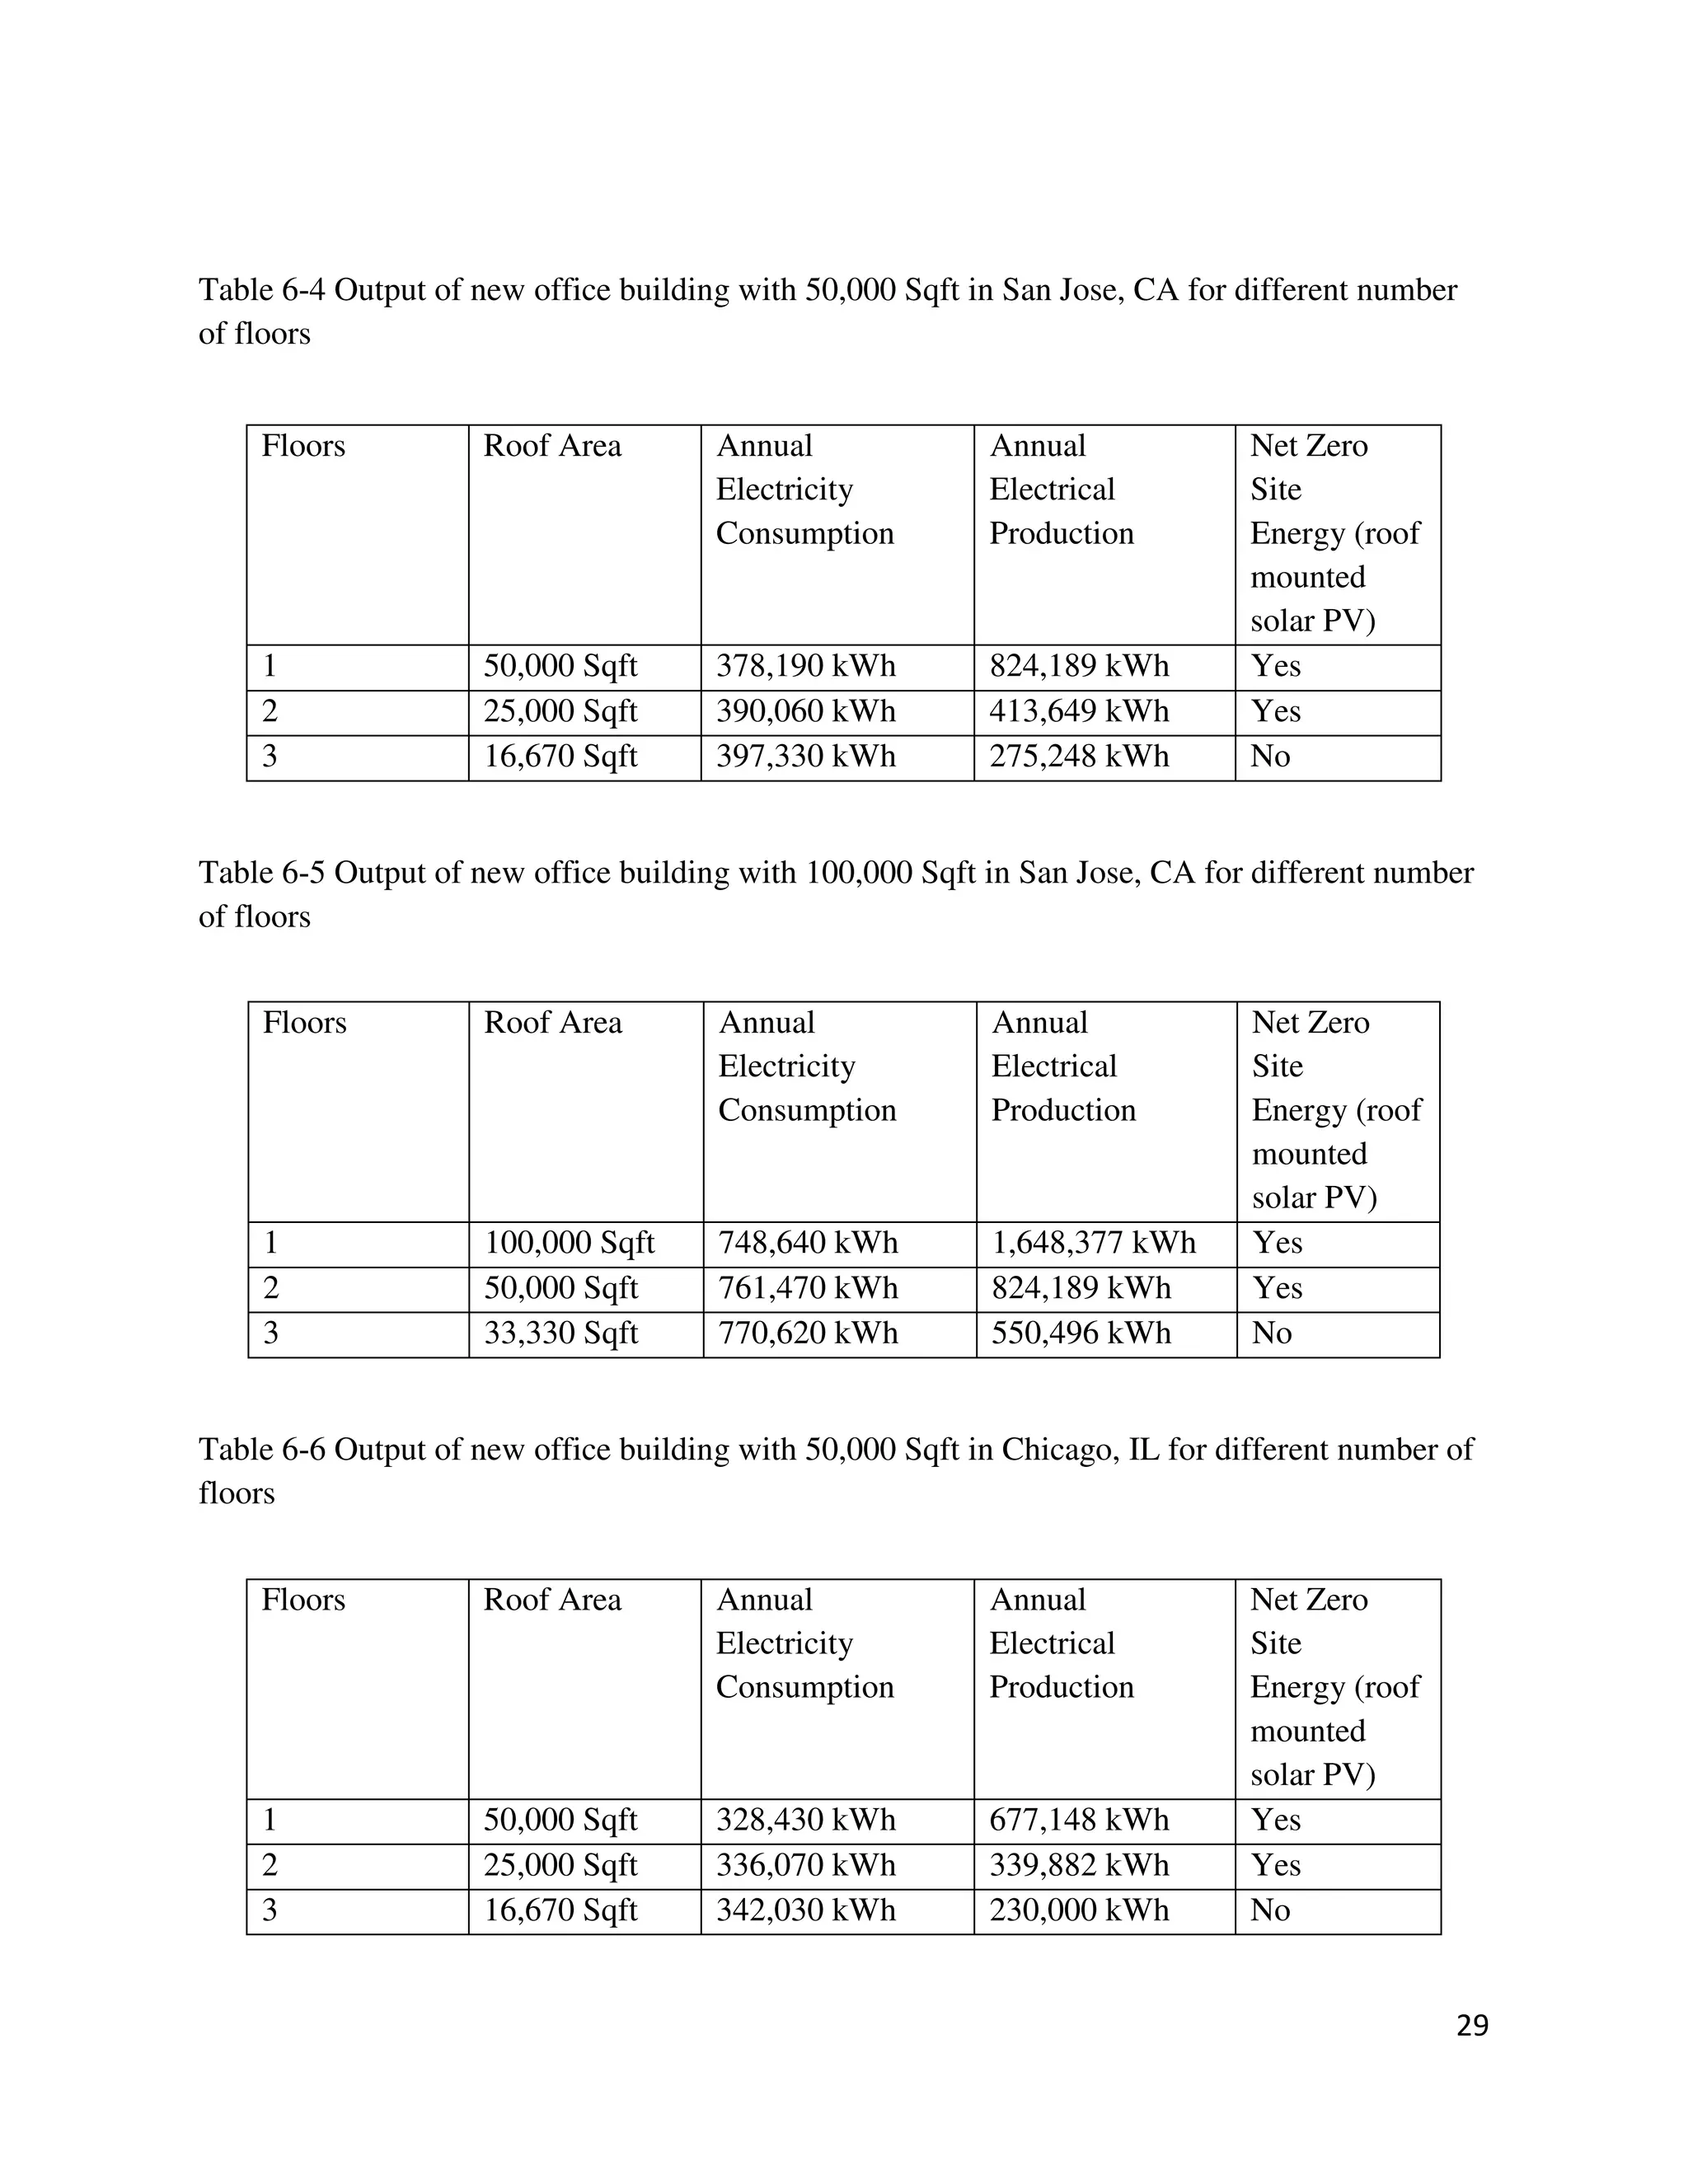
Table 6-4 Output of new office building with 50,000 Sqft in San Jose, CA for different number
of floors
Table 6-5 Output of new office building with 100,000 Sqft in San Jose, CA for different number
of floors
Table 6-6 Output of new office building with 50,000 Sqft in Chicago, IL for different number of
floors
Floors Roof Area Annual
Electricity
Consumption
Annual
Electrical
Production
Net Zero
Site
Energy (roof
mounted
solar PV)
1 50,000 Sqft 378,190 kWh 824,189 kWh Yes
2 25,000 Sqft 390,060 kWh 413,649 kWh Yes
3 16,670 Sqft 397,330 kWh 275,248 kWh No
Floors Roof Area Annual
Electricity
Consumption
Annual
Electrical
Production
Net Zero
Site
Energy (roof
mounted
solar PV)
1 100,000 Sqft 748,640 kWh 1,648,377 kWh Yes
2 50,000 Sqft 761,470 kWh 824,189 kWh Yes
3 33,330 Sqft 770,620 kWh 550,496 kWh No
Floors Roof Area Annual
Electricity
Consumption
Annual
Electrical
Production
Net Zero
Site
Energy (roof
mounted
solar PV)
1 50,000 Sqft 328,430 kWh 677,148 kWh Yes
2 25,000 Sqft 336,070 kWh 339,882 kWh Yes
3 16,670 Sqft 342,030 kWh 230,000 kWh No
30
Table 6-7 Output of new office building with 100,000 Sqft in Chicago, IL for different number
of floors
Net Zero Energy of Conventional Construction
• Building Type: Office building
• 1980s construction
• Area: 100,000 SqFt
• Location: Phoenix, AZ, San Jose, CA, Chicago, IL
• Modeling Tool: eQuest by Department of Energy
• Renewable Tool: PV Watts by NREL
• Occupancy: 100 SqFt/person
• No passive architecture
• Standard Chillers and Boilers
• Baseline lighting density (CA title 24, ASHRAE 90.1)
• Baseline building envelop (CA title 24, ASHRAE 90.1)
• No Variable Frequency Drive
The section from Tables 6-8 to 6-10 gives an output of conventional construction office building
for 100,000 Sqft with different locations and number of floors
Floors Roof Area Annual
Electricity
Consumption
Annual
Electrical
Production
Net Zero
Site
Energy (roof
mounted
solar PV)
1 100,000 Sqft 664,490 kWh 1,354,297 kWh Yes
2 50,000 Sqft 676,660 kWh 677,148 kWh Yes
3 33,330 Sqft 683,640 kWh 338,574 kWh No
31
Location: San Jose, CA
Table 6-8 Output of conventional office building with 100,000 Sqft in San Jose, CA for different
number of floors
Location: Phoenix, AZ
Table 6-9 Output of conventional office building with 100,000 Sqft in Phoenix, AZ for different
number of floors
Note: One floor can be converted into Net Zero Source Energy in both San Jose, CA and
Phoenix, AZ if annual gas consumption converted into electrical consumption.
Floors Roof Area Annual
Electricity
Consumption
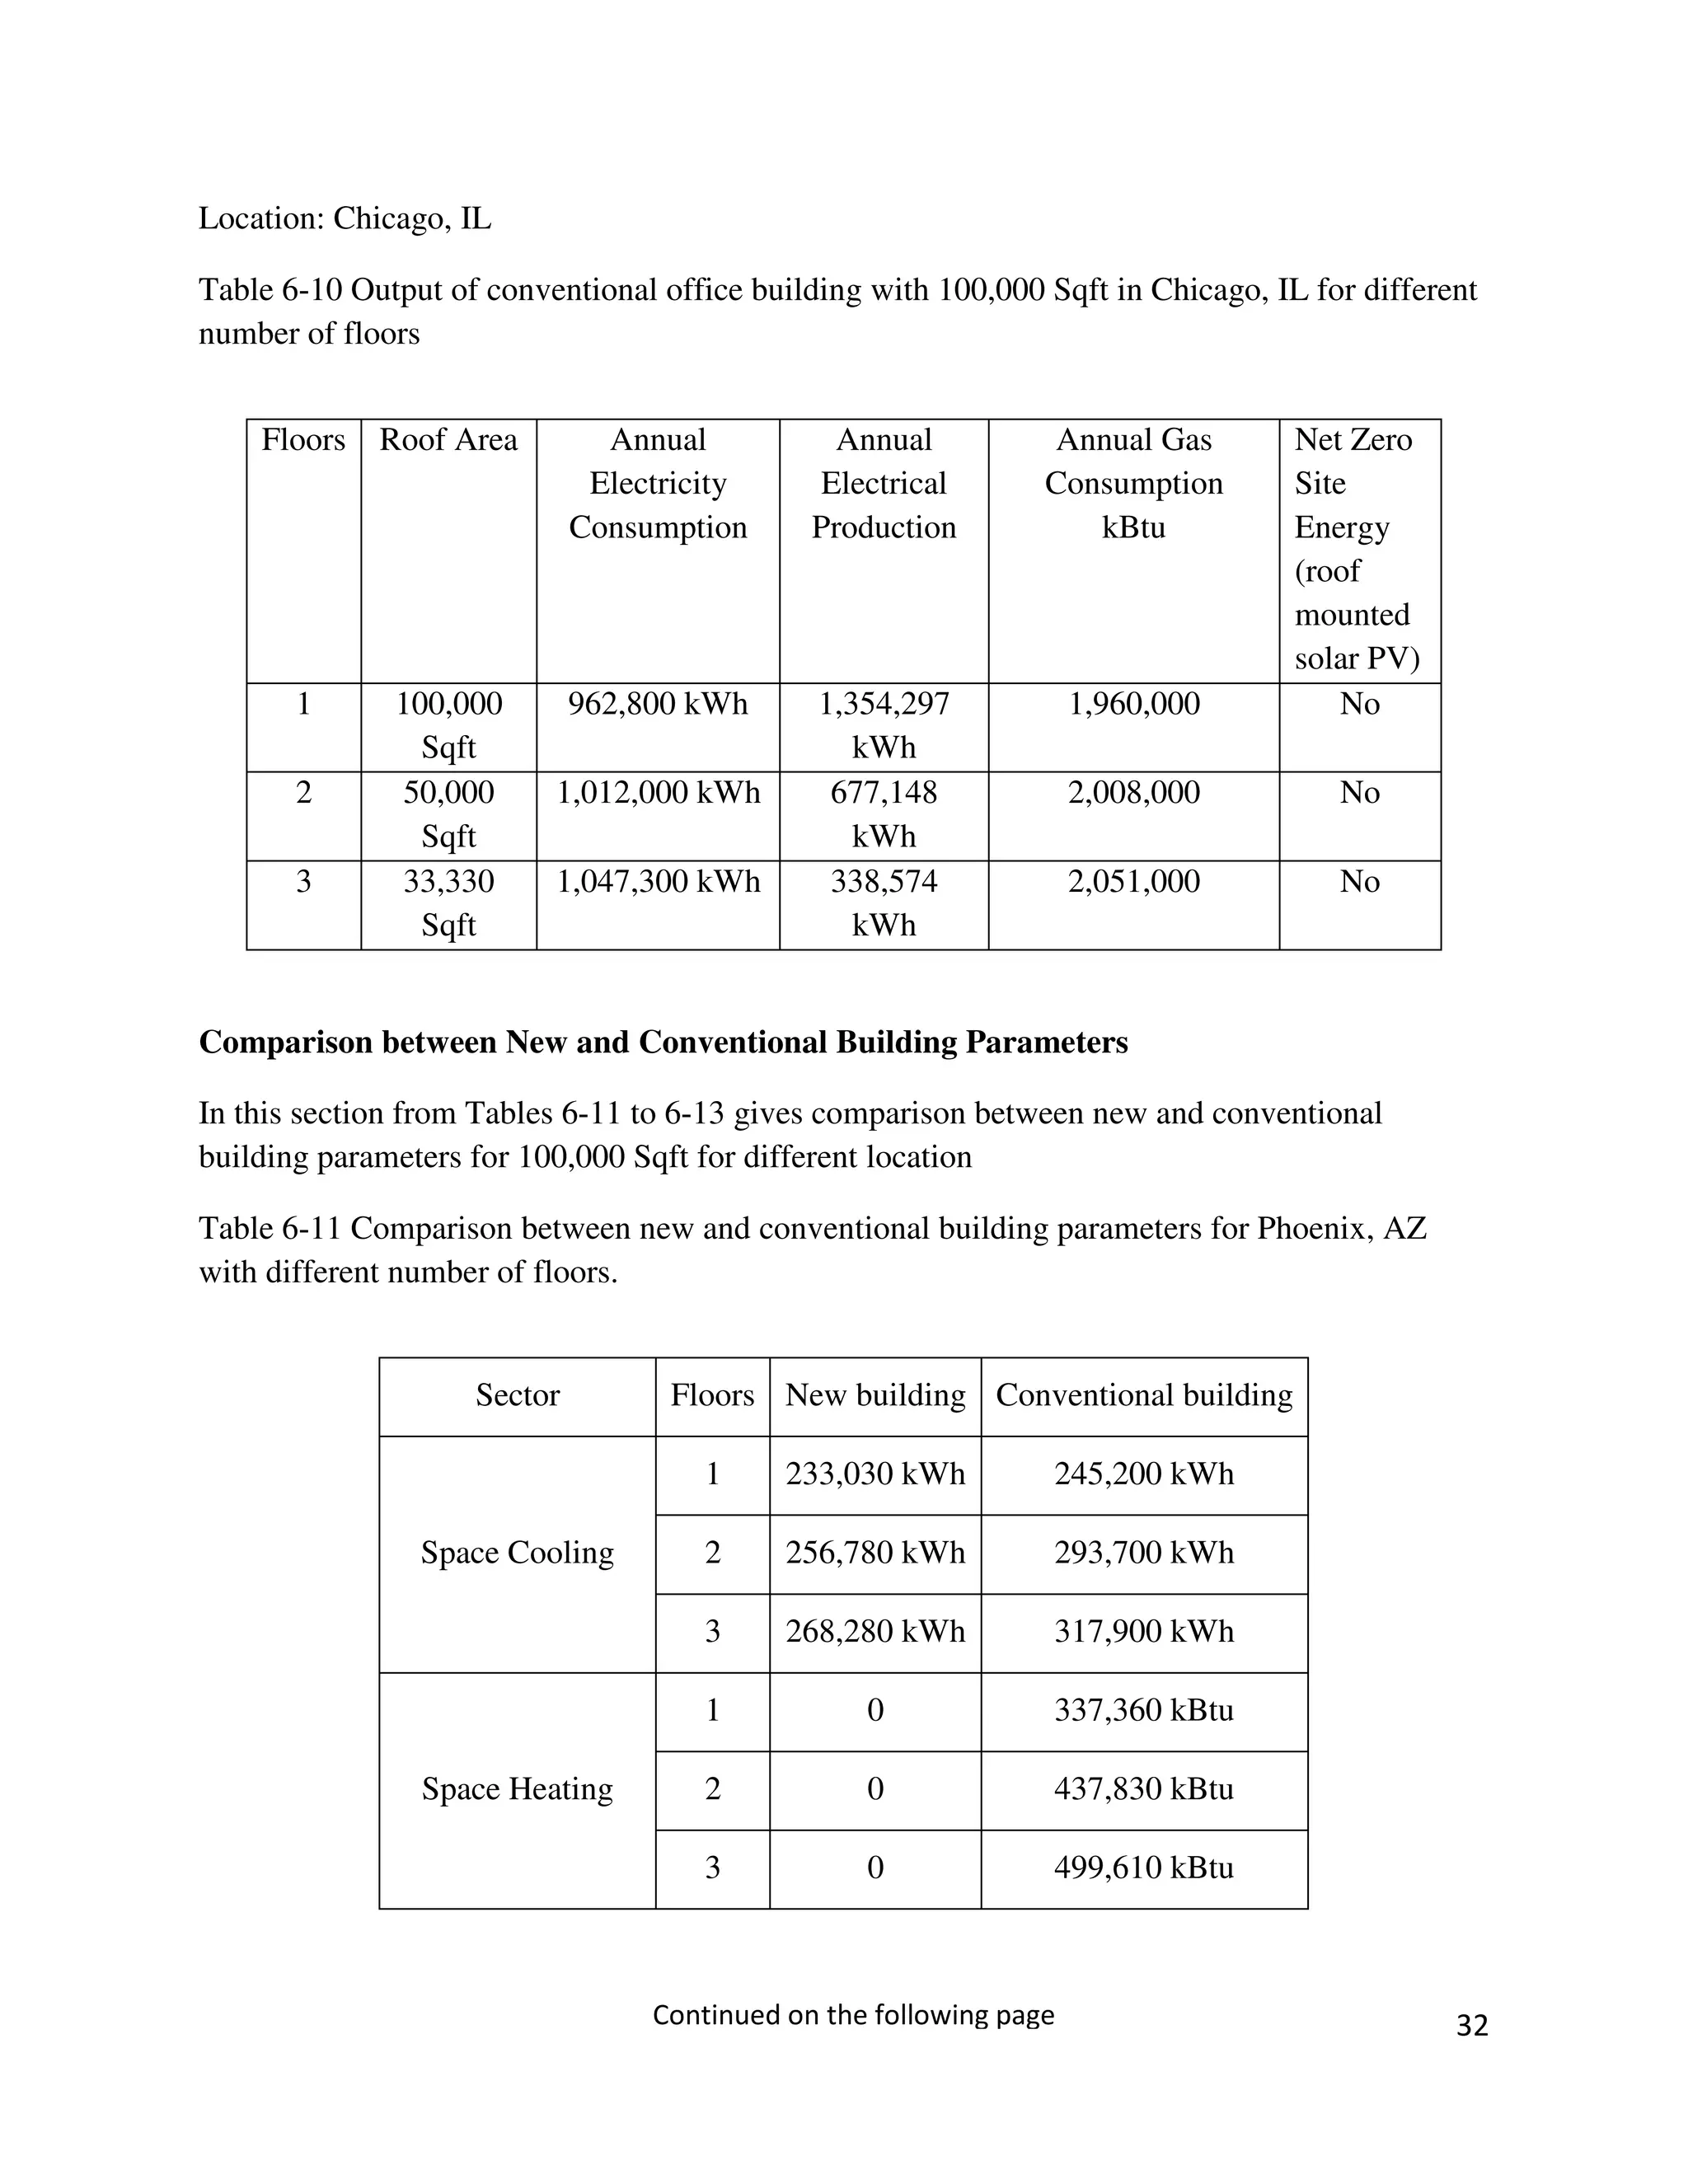
Annual
Electrical
Production
Annual Gas
Consumption
kBtu
Net
Zero Site
Energy
(roof
mounted
solar PV)
1 100,000
Sqft
903,150 kWh 1,648,377
kWh
1,248,900 Yes
2 50,000
Sqft
944,250 kWh 824,189
kWh
1,296,900 No
3 33,330
Sqft
972,840 kWh 550,496
kWh
1,370,300 No
Floors Roof Area Annual
Electricity
Consumption
Annual
Electrical
Production
Annual Gas
Consumption
kBtu
Net Zero
Site
Energy
(roof
mounted
solar PV)
1 100,000
Sqft
1,151,600 kWh 1,888,942
kWh
771,300 Yes
2 50,000
Sqft
1,215,500 kWh 944,471
kWh
831,840 No
3 33,330
Sqft
1,265,600 kWh 623,862
kWh
893,550 No
Continued on the following page
32
Location: Chicago, IL
Table 6-10 Output of conventional office building with 100,000 Sqft in Chicago, IL for different
number of floors
Comparison between New and Conventional Building Parameters
In this section from Tables 6-11 to 6-13 gives comparison between new and conventional
building parameters for 100,000 Sqft for different location
Table 6-11 Comparison between new and conventional building parameters for Phoenix, AZ
with different number of floors.
Floors Roof Area Annual
Electricity
Consumption
Annual
Electrical
Production
Annual Gas
Consumption
kBtu
Net Zero
Site
Energy
(roof
mounted
solar PV)
1 100,000
Sqft
962,800 kWh 1,354,297
kWh
1,960,000 No
2 50,000
Sqft
1,012,000 kWh 677,148
kWh
2,008,000 No
3 33,330
Sqft
1,047,300 kWh 338,574
kWh
2,051,000 No
Sector Floors New building Conventional building
Space Cooling
1 233,030 kWh 245,200 kWh
2 256,780 kWh 293,700 kWh
3 268,280 kWh 317,900 kWh
Space Heating
1 0 337,360 kBtu
2 0 437,830 kBtu
3 0 499,610 kBtu
Continued on the following page
33
Table 6-12 Comparison between new and conventional building parameters for San Jose, CA
with different number of floors.
Hot Water
1 68,230 kWh 393,930 kBtu
2 68,230 kWh 394,000 kBtu
3 68,230 kWh 393,940 kBtu
Ventilation Fans
1 34,580 kWh 98,200 kWh
2 43,170 kWh 113,900 kWh
3 51,470 kWh 120,600 kWh
Pump & Auxiliary
1 18,520 kWh 48,900 kWh
2 20,900 kWh 62,800 kWh
3 21,520 kWh 69,300 kWh
Sector Floors New building Conventional building
Space Cooling
1 141,510 kWh 155,520 kWh
2 155,550 kWh 179,700 kWh
3 162,860 kWh 191,800 kWh
Space Heating
1 0 773,200 kBtu
2 0 821,900 kBtu
3 0 895,400 kBtu
Hot Water
1 70,150 kWh 475,700 kBtu
2 70,150 kWh 475,000 kBtu
3 70,150 kWh 474,900 kBtu
34
The space heating shows negligibly small at San Jose, CA and Phoenix, AZ; most probably due
to higher thermal mass and higher U value of insulation. The same building was simulated using
boiler for space heating keeping all the other parameters same. The result was shown to be, 2800
kBtu. Repeated simulation were made and small values were shown for space heating which may
be an artifact of the simulation.
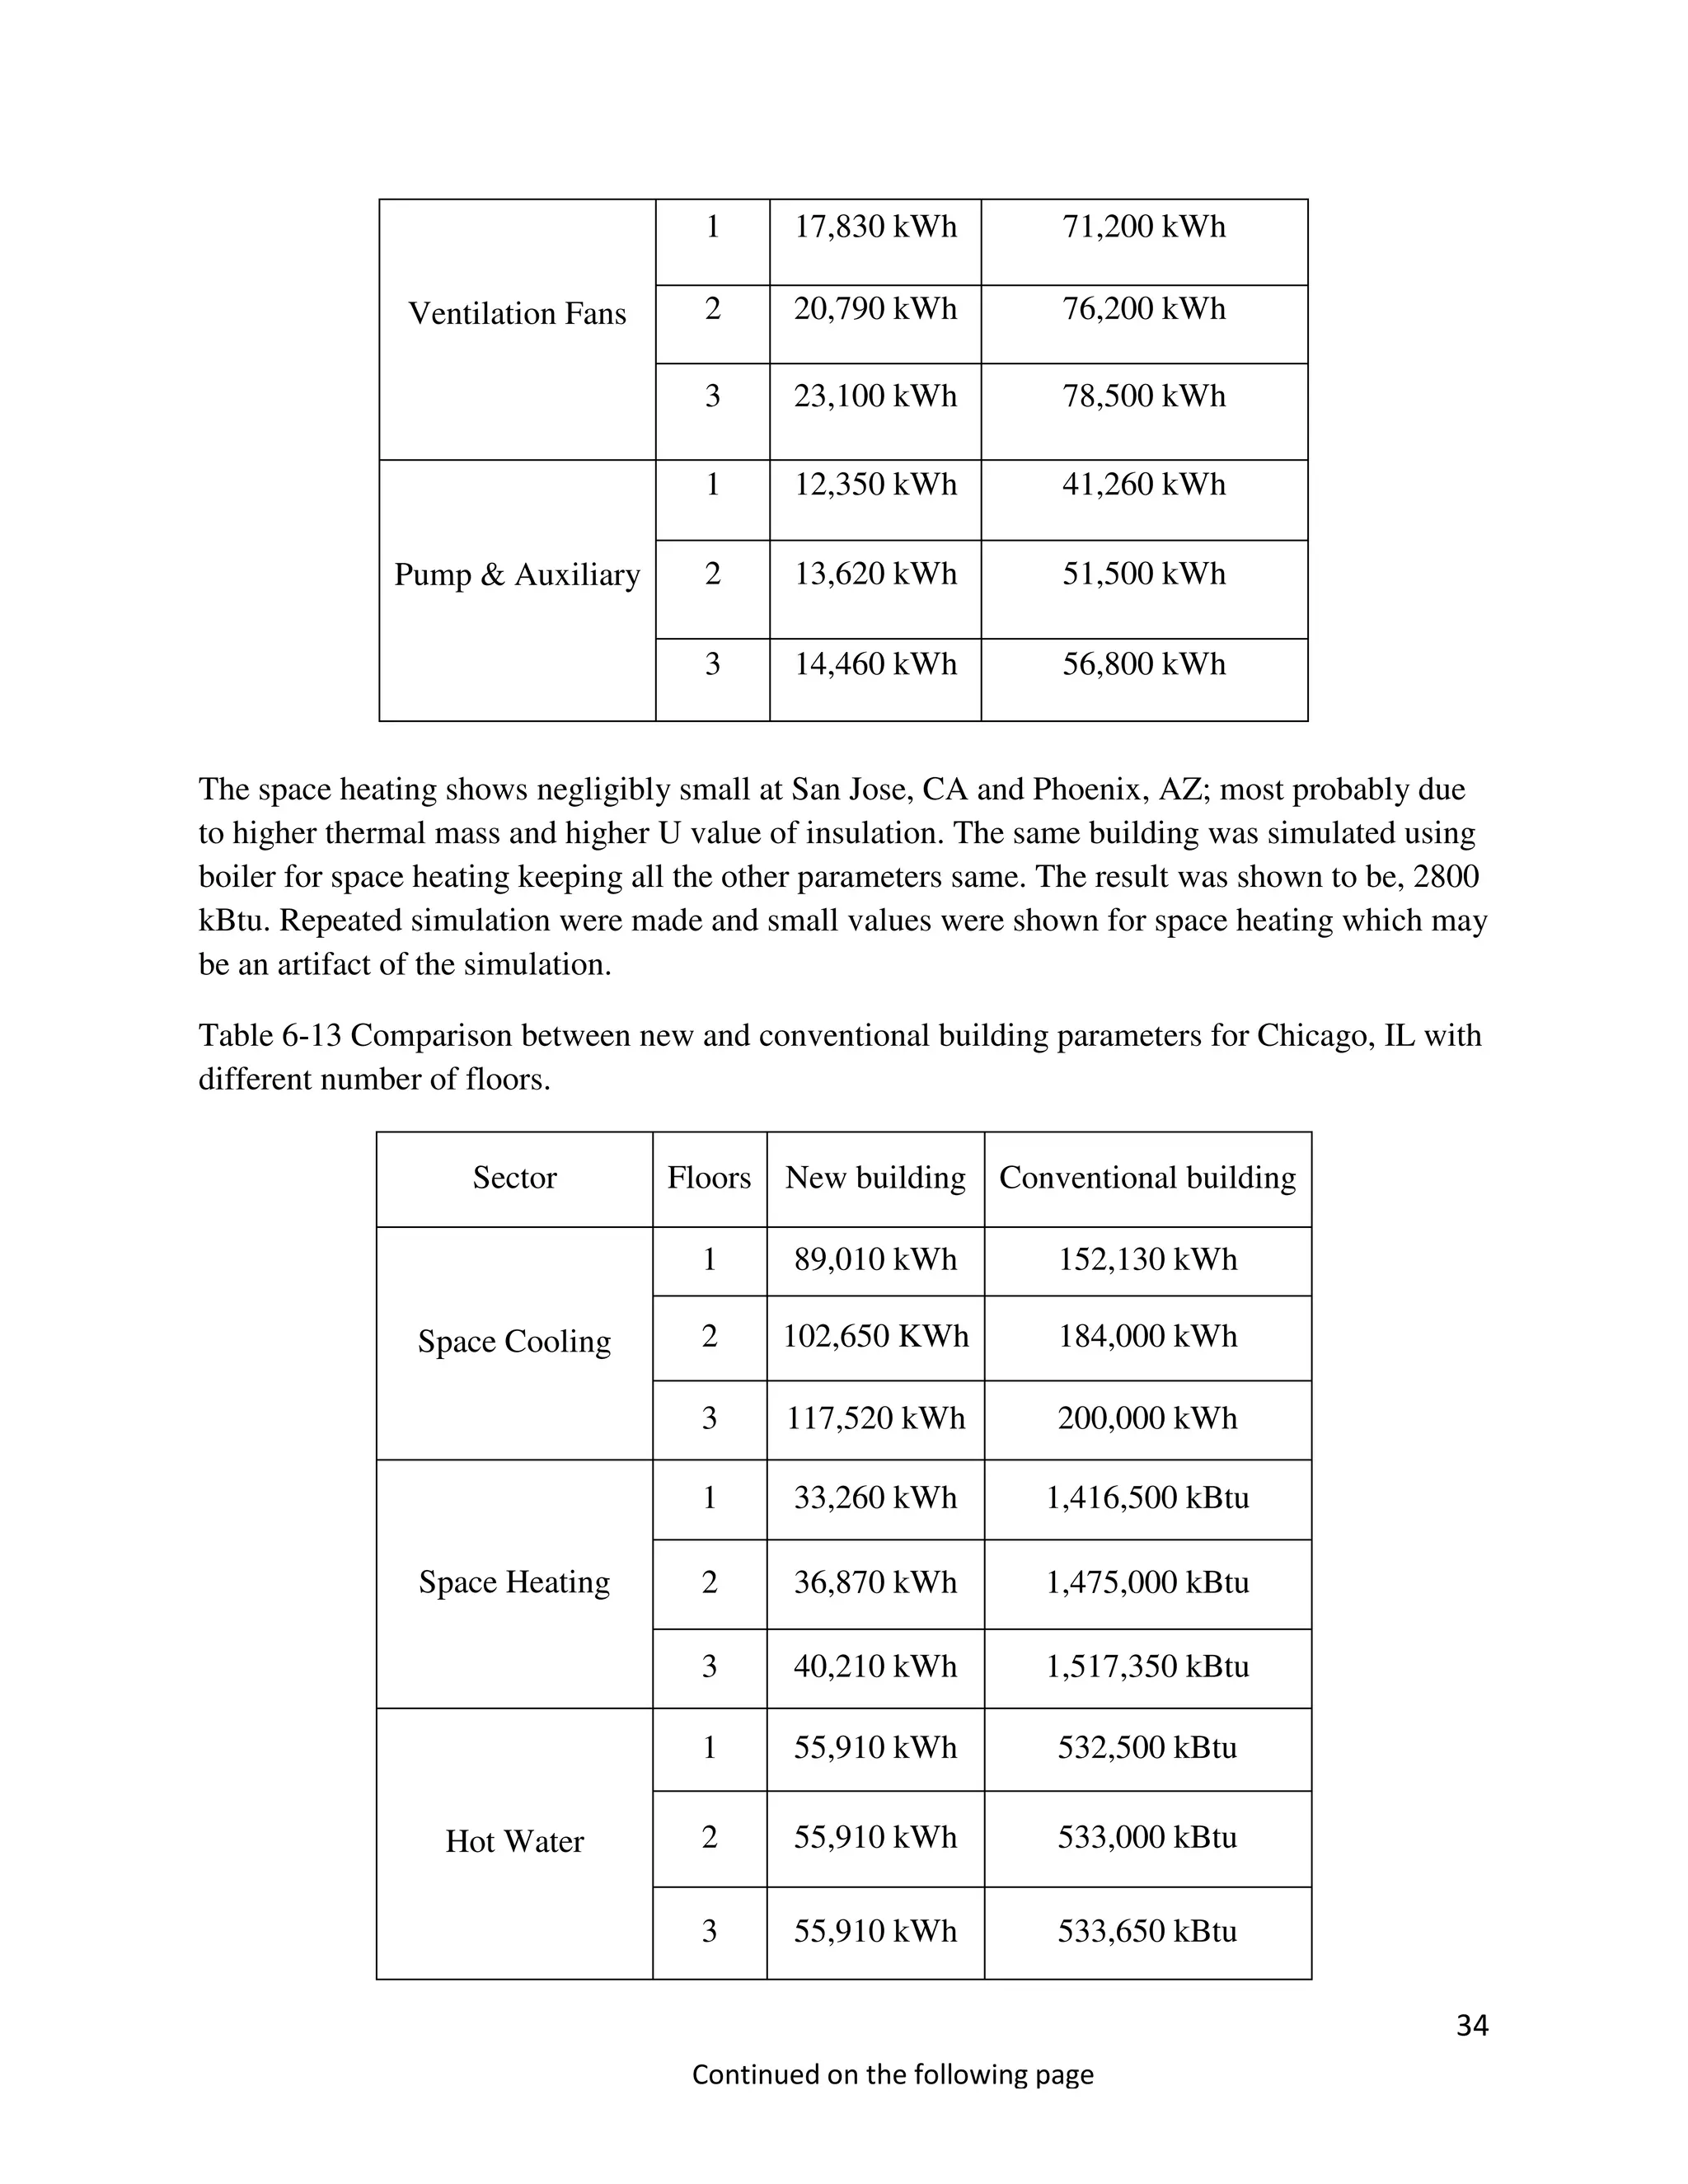
Table 6-13 Comparison between new and conventional building parameters for Chicago, IL with
different number of floors.
Ventilation Fans
1 17,830 kWh 71,200 kWh
2 20,790 kWh 76,200 kWh
3 23,100 kWh 78,500 kWh
Pump & Auxiliary
1 12,350 kWh 41,260 kWh
2 13,620 kWh 51,500 kWh
3 14,460 kWh 56,800 kWh
Sector Floors New building Conventional building
Space Cooling
1 89,010 kWh 152,130 kWh
2 102,650 KWh 184,000 kWh
3 117,520 kWh 200,000 kWh
Space Heating
1 33,260 kWh 1,416,500 kBtu
2 36,870 kWh 1,475,000 kBtu
3 40,210 kWh 1,517,350 kBtu
Hot Water
1 55,910 kWh 532,500 kBtu
2 55,910 kWh 533,000 kBtu
3 55,910 kWh 533,650 kBtu
Continued on the following page
35
Summarization of Results
New building: By roof mounted solar array and by using energy efficient techniques it is
possible to make buildings a net zero site energy, two floors can be built regardless of location
and area. For more floors, then it has to make use of surrounding space like a parking lot.
Conventional Building: By simulating and sizing solar array for conventional buildings with
same area and location, it is observed that only one floor can be zero net site energy using roof
mounted solar PV if natural gas consumption is converted into electrical consumption. With
comparatively high electrical energy consumption to that of new construction, further floors
cannot be make zero net site energy using roof mounted solar PV. As it is conventional
construction, there is no ground source heat pump installed in the building so has both electrical
and natural gas consumption. By having natural gas consumption, it is very difficult to make
more than one floor zero net site energy using roof mounted solar PV.
7. Simulation Verification
To verify simulation, I modeled similar building whose results are available to us. In this case I
modeled Research Support Facility (RSF) office, which is Net Zero Energy located in Colorado
(Hootman 2012). I used all the energy efficient techniques to verify my simulation project.
Project Data (Hootman 2012):
Building Area: 222,000 Sqft
Floors: 4 story building
Location: Denver, CO
Ventilation Fans
1 14,390 kWh 65,820 kWh
2 16,700 kWh 80,500 kWh
3 17,800 kWh 85,500 kWh
Pump & Auxiliary
1 10,080 kWh 50,270 kWh
2 11,490 kWh 61,300 kWh
3 12,410 kWh 67,300 kWh
36
Climate Zone: 5B; Cool, Dry
Occupant: 822
Occupied hours per week: 50 Hrs.
Roof Area: 69, 950 Sqft
Data Center Energy: 65 Watts/person for 1200 occupants on campus will be 683,280 kWh/year
Total Energy Consumption: 2254 MWh/yr
My simulation Output:
Data Center Energy: 65 Watts/person for 1200 occupants on campus will be 683,280 KWh/ year
Total Energy consumption: 2285 MWh
Table 6-14 Comparison between RSF building real data and my simulation output
Points RSF building real data Simulation output
Final Design Energy Use
intensity
33.2 kBtu/ft2/yr 35.12 kBtu/ft2/yr
Annual Energy consumption 2254 MWh/yr 2285 MWh/yr
By modeling RSF building and getting output similar to real data verifies all the energy efficient
techniques used in simulation project.
8. Future of Net Zero Energy Building
Net zero energy (NZE) is still a relatively new movement; only a small percentage of current
building construction has a goal of NZE. However, efforts are increasing, with a doubling in the
number of commercial NZE buildings over the last two years. Policies and programs can
dramatically change the landscape for Net Zero Energy (NZE) buildings. California Public
Utilities Commission (CPUC) adopted the big bold Initiative, which focused that all new
residential and commercial construction be NZE by 2020 and 2030 respectively. As per my
view, reduction, reuse, and renewables are three main steps towards zero net energy. Reduction
must come first, ideally by load reduction followed by efficiency measures. Reuse comes next,
with a focus on creatively putting waste energy in the systems back into beneficial use.
Renewable will produce energy which will help to achieve net zero design. Below are my
suggestions which can be helpful towards future of Net Zero Energy Buildings.
37
• Passive architecture is a fundamental prerequisite for net zero energy buildings.
Appropriate use of passive architecture can reduce in significant amount of heating and
cooling load.
• Use of ground source heat pump instead of boilers and chillers for heating, cooling, and
domestic hot water can reduce in significant amount of electrical consumption in the
buildings and there will not be any natural gas consumption in the buildings.
• Using energy efficient lighting fixtures and lighting controls can lower electrical
consumption
• Using variable speed drives can lower electrical consumption
• Waste heat recovery technique is also very useful towards energy reduction process
• Reduction in building plug loads and behavioral changes also very important towards net
zero energy.
9. References
Athienitis, A. 2006. Design and Optimization of Net Zero Energy Solar Homes. ASHRAE Report,
American Society of Heating, Refrigerating and Air-Conditioning Engineers Inc.
Griffith, B., N. Long, P. Torcellini, and R. Judkoff. 2007. Assessment of the Technical Potential for
Achieving Net Zero-Energy Buildings in the Commercial Sector. Technical Report,
National Renewable Laboratory.
California Public Utilities commission. 2008. Accessed December 6, 2015.
http://www.cpuc.ca.gov/NR/rdonlyres/C27FC108-A1FD-4D67-AA59-
7EA82011B257/0/3.pdf.
Codes, E. 2012. "Lighting Development, Adoption and Compliance Guide." Building Technology
program. September. Accessed December 2, 2015.
https://www.energycodes.gov/sites/default/files/documents/Lighting_Resource_Guide.
pdf.
Collyer, B. 2012. Zero Net Energy Program. Pacific Gas and Electric Company Report, San
Francisco: Pacific Gas and Electric Company.
Department of Energy. 2008. Accessed December 6, 2015.
http://energy.gov/energysaver/solar-water-heaters.
—. 2008. Accessed November 18, 2015. http://energy.gov/energysaver/heat-pump-systems.
38
—. 2009. eQUEST. Sepetmber. Accessed November 2015. http://www.doe2.com/equest/.
Haglund, K. 2012. Department Of Energy. Northenstar. November. Accessed November 18,
2015.
http://apps1.eere.energy.gov/buildings/publications/pdfs/building_america/measure_g
uide_windows.pdf.
Harrell, G. 2009. ENERGY MANAGEMENT SERVICES. PhD Thesis, Tennessee: National Renewable
Laboratory.
Hirsch. 2012. eQuest Introductory Tutorial. Tutorial, Camarillo: Department of Energy.
Hong, T., H. Lin. 2013. Occupant Behavior: Impact on Energy Use of Private Offices. Publish
Report, Ernest Orlando Lawrence Berkeley National Laboratory, 12.
Hootman, T. 2012. Net Zero Energy Design: Commercial buildings, New jersey: John Wiley &
Sons, Inc.
Kwatra, S., J. Amann, H. Saches. 2013. Miscellaneous Energy Loads in Building. Published
Report, Washington: American Council of Energy Efficienct Economy.
National Renewable Energy Laboratory (NREL). 2011. PV Watts. Accessed December 10, 2015.
http://pvwatts.nrel.gov/pvwatts.php.
Sheppy, M., C. Lobato, S. Pless, L. Polese, and P. Torcellini. 2012. Assessing and Reducing Plug
and Process Loads in Office Buildings. Fact Sheet, Denver: National Renewable Research
Laboratory.
Torcellini, P. 2006. Zero Energy Buildings: A Critical Look at the Definition. Published Report,
Denver: National Research Laboratory, 15.
Torcellini, P., S. Pless, and C. Lobato. 2010. Main Street Net-Zero Energy Buildings: The Zero
Energy Method in Concept and Practice. Case Study, Phoenix: National Research
Laboratry.

More Related Content

What's hot

Net zero energy buildings
Net zero energy buildingsNet zero energy buildings
Net zero energy buildings
sarojkhadka059
 
CEPT University, Ahmedabad - Net Zero Energy Building
CEPT University, Ahmedabad - Net Zero Energy BuildingCEPT University, Ahmedabad - Net Zero Energy Building
CEPT University, Ahmedabad - Net Zero Energy Building
Danfoss India
 
Zero energy buildings seminar
Zero energy buildings seminarZero energy buildings seminar
Zero energy buildings seminar
Sharan Raj
 
Mainstreaming Zero: Large Scale Commercial Net Zero Energy Buildings, AGC 2013
Mainstreaming Zero: Large Scale Commercial Net Zero Energy Buildings, AGC 2013Mainstreaming Zero: Large Scale Commercial Net Zero Energy Buildings, AGC 2013
Mainstreaming Zero: Large Scale Commercial Net Zero Energy Buildings, AGC 2013
Shanti Pless
 
Zero energy building
Zero energy buildingZero energy building
Zero energy building
Raghav Gupta
 
Zero energy building
Zero energy buildingZero energy building
Zero energy building
Priyankabudruk
 
Net zero energy building (ppt-2016)
Net zero energy building (ppt-2016)Net zero energy building (ppt-2016)
Net zero energy building (ppt-2016)
niruma
 
Zero energy buildings economical and environmental aspects
Zero energy buildings economical and environmental aspectsZero energy buildings economical and environmental aspects
Zero energy buildings economical and environmental aspects
MD ASIF AKBARI
 
Zero Energy Buildings
Zero Energy BuildingsZero Energy Buildings
Zero Energy Buildings
Jeffrey Funk
 
Zero Energy Commercial Buildings: Research For the Next Generation
Zero Energy Commercial Buildings: Research For the Next GenerationZero Energy Commercial Buildings: Research For the Next Generation
Zero Energy Commercial Buildings: Research For the Next Generation
Shanti Pless
 
Ccse Net Zero Energy
Ccse Net Zero EnergyCcse Net Zero Energy
Ccse Net Zero Energy
ccseerc
 
Zero Energy Building for NREL
Zero Energy Building for NRELZero Energy Building for NREL
Zero Energy Building for NREL
Tom Hootman
 
Defining the Nearly Zero Energy Building – Best practice brochure for municip...
Defining the Nearly Zero Energy Building – Best practice brochure for municip...Defining the Nearly Zero Energy Building – Best practice brochure for municip...
Defining the Nearly Zero Energy Building – Best practice brochure for municip...
MARIA SFYRAKI &ASSOCIATES
 
IRJET- A Review Paper on Net Zero Energy Building
IRJET-  	  A Review Paper on Net Zero Energy BuildingIRJET-  	  A Review Paper on Net Zero Energy Building
IRJET- A Review Paper on Net Zero Energy Building
IRJET Journal
 
Net zero energy building
Net zero energy buildingNet zero energy building
STUDY NET ZERO ENERGY BUILDING
STUDY NET ZERO ENERGY BUILDINGSTUDY NET ZERO ENERGY BUILDING
STUDY NET ZERO ENERGY BUILDING
amity university
 
ZERO ENERGY BUILDING (senthil)
ZERO ENERGY BUILDING (senthil)ZERO ENERGY BUILDING (senthil)
ZERO ENERGY BUILDING (senthil)
SENTHIL PANDI
 
Net zero or nearly zero energy buildings
Net zero or nearly zero energy buildings Net zero or nearly zero energy buildings
Net zero or nearly zero energy buildings
badekarbhavana
 
[Metropolia Student Project Seminar 24.5.] Zero Energy Buildings, Group B
[Metropolia Student Project Seminar 24.5.] Zero Energy Buildings, Group B[Metropolia Student Project Seminar 24.5.] Zero Energy Buildings, Group B
[Metropolia Student Project Seminar 24.5.] Zero Energy Buildings, Group BGBC Finland
 
Net zero energy building
Net zero energy buildingNet zero energy building
Net zero energy building
Dr K M SONI
 

What's hot (20)

Net zero energy buildings
Net zero energy buildingsNet zero energy buildings
Net zero energy buildings
 
CEPT University, Ahmedabad - Net Zero Energy Building
CEPT University, Ahmedabad - Net Zero Energy BuildingCEPT University, Ahmedabad - Net Zero Energy Building
CEPT University, Ahmedabad - Net Zero Energy Building
 
Zero energy buildings seminar
Zero energy buildings seminarZero energy buildings seminar
Zero energy buildings seminar
 
Mainstreaming Zero: Large Scale Commercial Net Zero Energy Buildings, AGC 2013
Mainstreaming Zero: Large Scale Commercial Net Zero Energy Buildings, AGC 2013Mainstreaming Zero: Large Scale Commercial Net Zero Energy Buildings, AGC 2013
Mainstreaming Zero: Large Scale Commercial Net Zero Energy Buildings, AGC 2013
 
Zero energy building
Zero energy buildingZero energy building
Zero energy building
 
Zero energy building
Zero energy buildingZero energy building
Zero energy building
 
Net zero energy building (ppt-2016)
Net zero energy building (ppt-2016)Net zero energy building (ppt-2016)
Net zero energy building (ppt-2016)
 
Zero energy buildings economical and environmental aspects
Zero energy buildings economical and environmental aspectsZero energy buildings economical and environmental aspects
Zero energy buildings economical and environmental aspects
 
Zero Energy Buildings
Zero Energy BuildingsZero Energy Buildings
Zero Energy Buildings
 
Zero Energy Commercial Buildings: Research For the Next Generation
Zero Energy Commercial Buildings: Research For the Next GenerationZero Energy Commercial Buildings: Research For the Next Generation
Zero Energy Commercial Buildings: Research For the Next Generation
 
Ccse Net Zero Energy
Ccse Net Zero EnergyCcse Net Zero Energy
Ccse Net Zero Energy
 
Zero Energy Building for NREL
Zero Energy Building for NRELZero Energy Building for NREL
Zero Energy Building for NREL
 
Defining the Nearly Zero Energy Building – Best practice brochure for municip...
Defining the Nearly Zero Energy Building – Best practice brochure for municip...Defining the Nearly Zero Energy Building – Best practice brochure for municip...
Defining the Nearly Zero Energy Building – Best practice brochure for municip...
 
IRJET- A Review Paper on Net Zero Energy Building
IRJET-  	  A Review Paper on Net Zero Energy BuildingIRJET-  	  A Review Paper on Net Zero Energy Building
IRJET- A Review Paper on Net Zero Energy Building
 
Net zero energy building
Net zero energy buildingNet zero energy building
Net zero energy building
 
STUDY NET ZERO ENERGY BUILDING
STUDY NET ZERO ENERGY BUILDINGSTUDY NET ZERO ENERGY BUILDING
STUDY NET ZERO ENERGY BUILDING
 
ZERO ENERGY BUILDING (senthil)
ZERO ENERGY BUILDING (senthil)ZERO ENERGY BUILDING (senthil)
ZERO ENERGY BUILDING (senthil)
 
Net zero or nearly zero energy buildings
Net zero or nearly zero energy buildings Net zero or nearly zero energy buildings
Net zero or nearly zero energy buildings
 
[Metropolia Student Project Seminar 24.5.] Zero Energy Buildings, Group B
[Metropolia Student Project Seminar 24.5.] Zero Energy Buildings, Group B[Metropolia Student Project Seminar 24.5.] Zero Energy Buildings, Group B
[Metropolia Student Project Seminar 24.5.] Zero Energy Buildings, Group B
 
Net zero energy building
Net zero energy buildingNet zero energy building
Net zero energy building
 

Viewers also liked

Air 2014 energy_efficiency_forum
Air 2014 energy_efficiency_forumAir 2014 energy_efficiency_forum
Air 2014 energy_efficiency_forum
Stantec
 
ZERO ENERGY BUILDING ENVELOPE COMPONENTS
ZERO ENERGY BUILDING ENVELOPE COMPONENTSZERO ENERGY BUILDING ENVELOPE COMPONENTS
ZERO ENERGY BUILDING ENVELOPE COMPONENTS
Kathmandu Engineering College
 
Zeor energy buliding
Zeor energy bulidingZeor energy buliding
Zeor energy buliding
Vrati Sharma
 
120426 res english_short
120426 res english_short120426 res english_short
120426 res english_shortFrank Emil Moen
 
[Nordic GBC Conference 2013] Aalto University - Experiences on Zero-Energy Bu...
[Nordic GBC Conference 2013] Aalto University - Experiences on Zero-Energy Bu...[Nordic GBC Conference 2013] Aalto University - Experiences on Zero-Energy Bu...
[Nordic GBC Conference 2013] Aalto University - Experiences on Zero-Energy Bu...GBC Finland
 
10_FINALproject_Arami.Flora.Mourad
10_FINALproject_Arami.Flora.Mourad10_FINALproject_Arami.Flora.Mourad
10_FINALproject_Arami.Flora.MouradArami Matevosyan
 
Role of Building Automation in nearly zero-energy buildings
Role of Building Automation in nearly zero-energy buildingsRole of Building Automation in nearly zero-energy buildings
Role of Building Automation in nearly zero-energy buildings
Leonardo ENERGY
 
10 tip to design Near Zero Energy Building
10 tip to design Near Zero Energy Building10 tip to design Near Zero Energy Building
10 tip to design Near Zero Energy Building
Alessandro Merigo
 
Net zero energy and beyond
Net zero energy and beyondNet zero energy and beyond
Net zero energy and beyond
Jim Schwartz
 
Solar energy two case studies
Solar energy   two case studiesSolar energy   two case studies
Solar energy two case studies
K Vivek Varkey
 
A groundbreaking evolution towards - ZERO ENERGY BUILDINGS
A groundbreaking evolution towards - ZERO ENERGY BUILDINGSA groundbreaking evolution towards - ZERO ENERGY BUILDINGS
A groundbreaking evolution towards - ZERO ENERGY BUILDINGS
advancedgreennetwork
 
Solar building design
Solar building designSolar building design
Solar building design
Raju Datla
 
Net Zero Energy Buildings
Net Zero Energy BuildingsNet Zero Energy Buildings
Net Zero Energy Buildings
Illinois ASHRAE
 
Ppt on zero energy building
Ppt on zero energy buildingPpt on zero energy building
Ppt on zero energy building
ganesh sharma
 
Net zero energy building (ppt-2016)
Net zero energy building (ppt-2016)Net zero energy building (ppt-2016)
Net zero energy building (ppt-2016)
niruma
 
Passive solar buildings
Passive solar buildingsPassive solar buildings
Passive solar buildingsSowmya Rangu
 

Viewers also liked (16)

Air 2014 energy_efficiency_forum
Air 2014 energy_efficiency_forumAir 2014 energy_efficiency_forum
Air 2014 energy_efficiency_forum
 
ZERO ENERGY BUILDING ENVELOPE COMPONENTS
ZERO ENERGY BUILDING ENVELOPE COMPONENTSZERO ENERGY BUILDING ENVELOPE COMPONENTS
ZERO ENERGY BUILDING ENVELOPE COMPONENTS
 
Zeor energy buliding
Zeor energy bulidingZeor energy buliding
Zeor energy buliding
 
120426 res english_short
120426 res english_short120426 res english_short
120426 res english_short
 
[Nordic GBC Conference 2013] Aalto University - Experiences on Zero-Energy Bu...
[Nordic GBC Conference 2013] Aalto University - Experiences on Zero-Energy Bu...[Nordic GBC Conference 2013] Aalto University - Experiences on Zero-Energy Bu...
[Nordic GBC Conference 2013] Aalto University - Experiences on Zero-Energy Bu...
 
10_FINALproject_Arami.Flora.Mourad
10_FINALproject_Arami.Flora.Mourad10_FINALproject_Arami.Flora.Mourad
10_FINALproject_Arami.Flora.Mourad
 
Role of Building Automation in nearly zero-energy buildings
Role of Building Automation in nearly zero-energy buildingsRole of Building Automation in nearly zero-energy buildings
Role of Building Automation in nearly zero-energy buildings
 
10 tip to design Near Zero Energy Building
10 tip to design Near Zero Energy Building10 tip to design Near Zero Energy Building
10 tip to design Near Zero Energy Building
 
Net zero energy and beyond
Net zero energy and beyondNet zero energy and beyond
Net zero energy and beyond
 
Solar energy two case studies
Solar energy   two case studiesSolar energy   two case studies
Solar energy two case studies
 
A groundbreaking evolution towards - ZERO ENERGY BUILDINGS
A groundbreaking evolution towards - ZERO ENERGY BUILDINGSA groundbreaking evolution towards - ZERO ENERGY BUILDINGS
A groundbreaking evolution towards - ZERO ENERGY BUILDINGS
 
Solar building design
Solar building designSolar building design
Solar building design
 
Net Zero Energy Buildings
Net Zero Energy BuildingsNet Zero Energy Buildings
Net Zero Energy Buildings
 
Ppt on zero energy building
Ppt on zero energy buildingPpt on zero energy building
Ppt on zero energy building
 
Net zero energy building (ppt-2016)
Net zero energy building (ppt-2016)Net zero energy building (ppt-2016)
Net zero energy building (ppt-2016)
 
Passive solar buildings
Passive solar buildingsPassive solar buildings
Passive solar buildings
 

Similar to Zero net energy of commercial building

FinalPaperS2015-CornellTech-Planning
FinalPaperS2015-CornellTech-PlanningFinalPaperS2015-CornellTech-Planning
FinalPaperS2015-CornellTech-PlanningIlia Savin
 
Research Support Facility: Three years of net zero operations, occupants, and...
Research Support Facility: Three years of net zero operations, occupants, and...Research Support Facility: Three years of net zero operations, occupants, and...
Research Support Facility: Three years of net zero operations, occupants, and...
Shanti Pless
 
Building Energy Simulation project by using eQuest
Building Energy Simulation project by using eQuestBuilding Energy Simulation project by using eQuest
Building Energy Simulation project by using eQuest
Asadullah Malik
 
Comparative Study on Day Lighting & Energy Modeling For Conventional and Gree...
Comparative Study on Day Lighting & Energy Modeling For Conventional and Gree...Comparative Study on Day Lighting & Energy Modeling For Conventional and Gree...
Comparative Study on Day Lighting & Energy Modeling For Conventional and Gree...
inventionjournals
 
Energy simulation & analysis of two residential buildings
Energy simulation & analysis of two residential buildingsEnergy simulation & analysis of two residential buildings
Energy simulation & analysis of two residential buildings
chirag aggarwal
 
Building integrated photovoltaic designs for commercial and industrial struc
Building integrated photovoltaic designs for commercial and industrial strucBuilding integrated photovoltaic designs for commercial and industrial struc
Building integrated photovoltaic designs for commercial and industrial struc
architect Eman
 
Progress report ppt 00.pptx
Progress report ppt 00.pptxProgress report ppt 00.pptx
Progress report ppt 00.pptx
KarthikMasky
 
dissertation on Net Zero Energy Buildings.pptx
dissertation on Net Zero Energy Buildings.pptxdissertation on Net Zero Energy Buildings.pptx
dissertation on Net Zero Energy Buildings.pptx
RidhiJain758831
 
Case study: Energy Savings With Window Film
Case study: Energy Savings With Window FilmCase study: Energy Savings With Window Film
Case study: Energy Savings With Window Film
GreenLightWindowFilmsCOSprings
 
Case study: Energy Savings From Window Film
Case study: Energy Savings From Window FilmCase study: Energy Savings From Window Film
Case study: Energy Savings From Window Film
CustomTintSolutionsSanAntonio
 
Case Study: Energy savings through window film
Case Study: Energy savings through window filmCase Study: Energy savings through window film
Case Study: Energy savings through window film
ScottishWindowTintingSanAntonio
 
A Research Paper on Retrofitting of Institutional Building into Green Buildin...
A Research Paper on Retrofitting of Institutional Building into Green Buildin...A Research Paper on Retrofitting of Institutional Building into Green Buildin...
A Research Paper on Retrofitting of Institutional Building into Green Buildin...
IRJET Journal
 
Energy simulation & analysis
Energy simulation & analysisEnergy simulation & analysis
Low rpm Generator for efficient energy harnessing from a two stage wind turbine
Low rpm Generator for efficient energy harnessing from a two stage wind turbineLow rpm Generator for efficient energy harnessing from a two stage wind turbine
Low rpm Generator for efficient energy harnessing from a two stage wind turbine
Aftabkhan575376
 
energysimulation01-170601095924.pdf
energysimulation01-170601095924.pdfenergysimulation01-170601095924.pdf
energysimulation01-170601095924.pdf
Shree Sowmya Chinta
 
NREL Commercial Buildings Research Group, ASHRAE June 2013 Research Keynote
NREL Commercial Buildings Research Group, ASHRAE June 2013 Research Keynote NREL Commercial Buildings Research Group, ASHRAE June 2013 Research Keynote
NREL Commercial Buildings Research Group, ASHRAE June 2013 Research Keynote
Shanti Pless
 
Presentation.pptx
Presentation.pptxPresentation.pptx
Presentation.pptx
HARSHBARNELA1
 
Intern Report - Le Xuan Dat
Intern Report - Le Xuan DatIntern Report - Le Xuan Dat
Intern Report - Le Xuan DatDat Le Xuan
 

Similar to Zero net energy of commercial building (20)

FinalPaperS2015-CornellTech-Planning
FinalPaperS2015-CornellTech-PlanningFinalPaperS2015-CornellTech-Planning
FinalPaperS2015-CornellTech-Planning
 
Research Support Facility: Three years of net zero operations, occupants, and...
Research Support Facility: Three years of net zero operations, occupants, and...Research Support Facility: Three years of net zero operations, occupants, and...
Research Support Facility: Three years of net zero operations, occupants, and...
 
Building Energy Simulation project by using eQuest
Building Energy Simulation project by using eQuestBuilding Energy Simulation project by using eQuest
Building Energy Simulation project by using eQuest
 
Comparative Study on Day Lighting & Energy Modeling For Conventional and Gree...
Comparative Study on Day Lighting & Energy Modeling For Conventional and Gree...Comparative Study on Day Lighting & Energy Modeling For Conventional and Gree...
Comparative Study on Day Lighting & Energy Modeling For Conventional and Gree...
 
Energy simulation & analysis of two residential buildings
Energy simulation & analysis of two residential buildingsEnergy simulation & analysis of two residential buildings
Energy simulation & analysis of two residential buildings
 
report 2
report 2report 2
report 2
 
Building integrated photovoltaic designs for commercial and industrial struc
Building integrated photovoltaic designs for commercial and industrial strucBuilding integrated photovoltaic designs for commercial and industrial struc
Building integrated photovoltaic designs for commercial and industrial struc
 
Progress report ppt 00.pptx
Progress report ppt 00.pptxProgress report ppt 00.pptx
Progress report ppt 00.pptx
 
dissertation on Net Zero Energy Buildings.pptx
dissertation on Net Zero Energy Buildings.pptxdissertation on Net Zero Energy Buildings.pptx
dissertation on Net Zero Energy Buildings.pptx
 
energyproject
energyprojectenergyproject
energyproject
 
Case study: Energy Savings With Window Film
Case study: Energy Savings With Window FilmCase study: Energy Savings With Window Film
Case study: Energy Savings With Window Film
 
Case study: Energy Savings From Window Film
Case study: Energy Savings From Window FilmCase study: Energy Savings From Window Film
Case study: Energy Savings From Window Film
 
Case Study: Energy savings through window film
Case Study: Energy savings through window filmCase Study: Energy savings through window film
Case Study: Energy savings through window film
 
A Research Paper on Retrofitting of Institutional Building into Green Buildin...
A Research Paper on Retrofitting of Institutional Building into Green Buildin...A Research Paper on Retrofitting of Institutional Building into Green Buildin...
A Research Paper on Retrofitting of Institutional Building into Green Buildin...
 
Energy simulation & analysis
Energy simulation & analysisEnergy simulation & analysis
Energy simulation & analysis
 
Low rpm Generator for efficient energy harnessing from a two stage wind turbine
Low rpm Generator for efficient energy harnessing from a two stage wind turbineLow rpm Generator for efficient energy harnessing from a two stage wind turbine
Low rpm Generator for efficient energy harnessing from a two stage wind turbine
 
energysimulation01-170601095924.pdf
energysimulation01-170601095924.pdfenergysimulation01-170601095924.pdf
energysimulation01-170601095924.pdf
 
NREL Commercial Buildings Research Group, ASHRAE June 2013 Research Keynote
NREL Commercial Buildings Research Group, ASHRAE June 2013 Research Keynote NREL Commercial Buildings Research Group, ASHRAE June 2013 Research Keynote
NREL Commercial Buildings Research Group, ASHRAE June 2013 Research Keynote
 
Presentation.pptx
Presentation.pptxPresentation.pptx
Presentation.pptx
 
Intern Report - Le Xuan Dat
Intern Report - Le Xuan DatIntern Report - Le Xuan Dat
Intern Report - Le Xuan Dat
 

Recently uploaded

Fundamentals of Electric Drives and its applications.pptx
Fundamentals of Electric Drives and its applications.pptxFundamentals of Electric Drives and its applications.pptx
Fundamentals of Electric Drives and its applications.pptx
manasideore6
 
Pile Foundation by Venkatesh Taduvai (Sub Geotechnical Engineering II)-conver...
Pile Foundation by Venkatesh Taduvai (Sub Geotechnical Engineering II)-conver...Pile Foundation by Venkatesh Taduvai (Sub Geotechnical Engineering II)-conver...
Pile Foundation by Venkatesh Taduvai (Sub Geotechnical Engineering II)-conver...
AJAYKUMARPUND1
 
AP LAB PPT.pdf ap lab ppt no title specific
AP LAB PPT.pdf ap lab ppt no title specificAP LAB PPT.pdf ap lab ppt no title specific
AP LAB PPT.pdf ap lab ppt no title specific
BrazilAccount1
 
CME397 Surface Engineering- Professional Elective
CME397 Surface Engineering- Professional ElectiveCME397 Surface Engineering- Professional Elective
CME397 Surface Engineering- Professional Elective
karthi keyan
 
H.Seo, ICLR 2024, MLILAB, KAIST AI.pdf
H.Seo,  ICLR 2024, MLILAB,  KAIST AI.pdfH.Seo,  ICLR 2024, MLILAB,  KAIST AI.pdf
H.Seo, ICLR 2024, MLILAB, KAIST AI.pdf
MLILAB
 
Cosmetic shop management system project report.pdf
Cosmetic shop management system project report.pdfCosmetic shop management system project report.pdf
Cosmetic shop management system project report.pdf
Kamal Acharya
 
space technology lecture notes on satellite
space technology lecture notes on satellitespace technology lecture notes on satellite
space technology lecture notes on satellite
ongomchris
 
NO1 Uk best vashikaran specialist in delhi vashikaran baba near me online vas...
NO1 Uk best vashikaran specialist in delhi vashikaran baba near me online vas...NO1 Uk best vashikaran specialist in delhi vashikaran baba near me online vas...
NO1 Uk best vashikaran specialist in delhi vashikaran baba near me online vas...
Amil Baba Dawood bangali
 
The role of big data in decision making.
The role of big data in decision making.The role of big data in decision making.
The role of big data in decision making.
ankuprajapati0525
 
HYDROPOWER - Hydroelectric power generation
HYDROPOWER - Hydroelectric power generationHYDROPOWER - Hydroelectric power generation
HYDROPOWER - Hydroelectric power generation
Robbie Edward Sayers
 
Final project report on grocery store management system..pdf
Final project report on grocery store management system..pdfFinal project report on grocery store management system..pdf
Final project report on grocery store management system..pdf
Kamal Acharya
 
Planning Of Procurement o different goods and services
Planning Of Procurement o different goods and servicesPlanning Of Procurement o different goods and services
Planning Of Procurement o different goods and services
JoytuBarua2
 
RAT: Retrieval Augmented Thoughts Elicit Context-Aware Reasoning in Long-Hori...
RAT: Retrieval Augmented Thoughts Elicit Context-Aware Reasoning in Long-Hori...RAT: Retrieval Augmented Thoughts Elicit Context-Aware Reasoning in Long-Hori...
RAT: Retrieval Augmented Thoughts Elicit Context-Aware Reasoning in Long-Hori...
thanhdowork
 
block diagram and signal flow graph representation
block diagram and signal flow graph representationblock diagram and signal flow graph representation
block diagram and signal flow graph representation
Divya Somashekar
 
road safety engineering r s e unit 3.pdf
road safety engineering  r s e unit 3.pdfroad safety engineering  r s e unit 3.pdf
road safety engineering r s e unit 3.pdf
VENKATESHvenky89705
 
Design and Analysis of Algorithms-DP,Backtracking,Graphs,B&B
Design and Analysis of Algorithms-DP,Backtracking,Graphs,B&BDesign and Analysis of Algorithms-DP,Backtracking,Graphs,B&B
Design and Analysis of Algorithms-DP,Backtracking,Graphs,B&B
Sreedhar Chowdam
 
The Benefits and Techniques of Trenchless Pipe Repair.pdf
The Benefits and Techniques of Trenchless Pipe Repair.pdfThe Benefits and Techniques of Trenchless Pipe Repair.pdf
The Benefits and Techniques of Trenchless Pipe Repair.pdf
Pipe Restoration Solutions
 
Hierarchical Digital Twin of a Naval Power System
Hierarchical Digital Twin of a Naval Power SystemHierarchical Digital Twin of a Naval Power System
Hierarchical Digital Twin of a Naval Power System
Kerry Sado
 
Railway Signalling Principles Edition 3.pdf
Railway Signalling Principles Edition 3.pdfRailway Signalling Principles Edition 3.pdf
Railway Signalling Principles Edition 3.pdf
TeeVichai
 
AKS UNIVERSITY Satna Final Year Project By OM Hardaha.pdf
AKS UNIVERSITY Satna Final Year Project By OM Hardaha.pdfAKS UNIVERSITY Satna Final Year Project By OM Hardaha.pdf
AKS UNIVERSITY Satna Final Year Project By OM Hardaha.pdf
SamSarthak3
 

Recently uploaded (20)

Fundamentals of Electric Drives and its applications.pptx
Fundamentals of Electric Drives and its applications.pptxFundamentals of Electric Drives and its applications.pptx
Fundamentals of Electric Drives and its applications.pptx
 
Pile Foundation by Venkatesh Taduvai (Sub Geotechnical Engineering II)-conver...
Pile Foundation by Venkatesh Taduvai (Sub Geotechnical Engineering II)-conver...Pile Foundation by Venkatesh Taduvai (Sub Geotechnical Engineering II)-conver...
Pile Foundation by Venkatesh Taduvai (Sub Geotechnical Engineering II)-conver...
 
AP LAB PPT.pdf ap lab ppt no title specific
AP LAB PPT.pdf ap lab ppt no title specificAP LAB PPT.pdf ap lab ppt no title specific
AP LAB PPT.pdf ap lab ppt no title specific
 
CME397 Surface Engineering- Professional Elective
CME397 Surface Engineering- Professional ElectiveCME397 Surface Engineering- Professional Elective
CME397 Surface Engineering- Professional Elective
 
H.Seo, ICLR 2024, MLILAB, KAIST AI.pdf
H.Seo,  ICLR 2024, MLILAB,  KAIST AI.pdfH.Seo,  ICLR 2024, MLILAB,  KAIST AI.pdf
H.Seo, ICLR 2024, MLILAB, KAIST AI.pdf
 
Cosmetic shop management system project report.pdf
Cosmetic shop management system project report.pdfCosmetic shop management system project report.pdf
Cosmetic shop management system project report.pdf
 
space technology lecture notes on satellite
space technology lecture notes on satellitespace technology lecture notes on satellite
space technology lecture notes on satellite
 
NO1 Uk best vashikaran specialist in delhi vashikaran baba near me online vas...
NO1 Uk best vashikaran specialist in delhi vashikaran baba near me online vas...NO1 Uk best vashikaran specialist in delhi vashikaran baba near me online vas...
NO1 Uk best vashikaran specialist in delhi vashikaran baba near me online vas...
 
The role of big data in decision making.
The role of big data in decision making.The role of big data in decision making.
The role of big data in decision making.
 
HYDROPOWER - Hydroelectric power generation
HYDROPOWER - Hydroelectric power generationHYDROPOWER - Hydroelectric power generation
HYDROPOWER - Hydroelectric power generation
 
Final project report on grocery store management system..pdf
Final project report on grocery store management system..pdfFinal project report on grocery store management system..pdf
Final project report on grocery store management system..pdf
 
Planning Of Procurement o different goods and services
Planning Of Procurement o different goods and servicesPlanning Of Procurement o different goods and services
Planning Of Procurement o different goods and services
 
RAT: Retrieval Augmented Thoughts Elicit Context-Aware Reasoning in Long-Hori...
RAT: Retrieval Augmented Thoughts Elicit Context-Aware Reasoning in Long-Hori...RAT: Retrieval Augmented Thoughts Elicit Context-Aware Reasoning in Long-Hori...
RAT: Retrieval Augmented Thoughts Elicit Context-Aware Reasoning in Long-Hori...
 
block diagram and signal flow graph representation
block diagram and signal flow graph representationblock diagram and signal flow graph representation
block diagram and signal flow graph representation
 
road safety engineering r s e unit 3.pdf
road safety engineering  r s e unit 3.pdfroad safety engineering  r s e unit 3.pdf
road safety engineering r s e unit 3.pdf
 
Design and Analysis of Algorithms-DP,Backtracking,Graphs,B&B
Design and Analysis of Algorithms-DP,Backtracking,Graphs,B&BDesign and Analysis of Algorithms-DP,Backtracking,Graphs,B&B
Design and Analysis of Algorithms-DP,Backtracking,Graphs,B&B
 
The Benefits and Techniques of Trenchless Pipe Repair.pdf
The Benefits and Techniques of Trenchless Pipe Repair.pdfThe Benefits and Techniques of Trenchless Pipe Repair.pdf
The Benefits and Techniques of Trenchless Pipe Repair.pdf
 
Hierarchical Digital Twin of a Naval Power System
Hierarchical Digital Twin of a Naval Power SystemHierarchical Digital Twin of a Naval Power System
Hierarchical Digital Twin of a Naval Power System
 
Railway Signalling Principles Edition 3.pdf
Railway Signalling Principles Edition 3.pdfRailway Signalling Principles Edition 3.pdf
Railway Signalling Principles Edition 3.pdf
 
AKS UNIVERSITY Satna Final Year Project By OM Hardaha.pdf
AKS UNIVERSITY Satna Final Year Project By OM Hardaha.pdfAKS UNIVERSITY Satna Final Year Project By OM Hardaha.pdf
AKS UNIVERSITY Satna Final Year Project By OM Hardaha.pdf
 

Zero net energy of commercial building

  • 1. Net Zero Energy Design of Commercial Buildings A Research Report submitted to the faculty of San Francisco State University In partial fulfillment of The requirements for The Degree Master of Science In Engineering: Energy Systems By Ruchir Hemant Shah San Francisco, California December 2015
  • 3. ii CERTIFICATION OF APPROVAL I certify that I have read Net Energy Design of Commercial Buildings by Ruchir H. Shah, and that in my opinion this work meets the criteria for approving a research project report submitted in partial fulfillment of the requirement for the degree Master of Science in Energy Systems at San Francisco State University. Ahmad Ganji, Ph.D. Professor A. S. (Ed) Cheng, Ph.D. Professor
  • 4. iii Net Zero Energy Design of Commercial Buildings Ruchir Hemant Shah San Francisco, California 2015 The vision of Net Zero Energy Buildings (NZEBs) is compelling. In theory, the amount of energy consumed by the building for an entire year should be less than or equal to the amount of energy produced by the onsite renewable source. The main aim of my project is to build maximum number of floors in the building and make it zero net site energy using roof-top solar photovoltaic (PV) panels. To check weather effect, project is simulated in three different weather conditions. Results obtained from the simulation in this project under the three weather conditions show that a maximum of two floors can be designed in new energy efficient buildings to make them zero net site energy using roof mounted solar PV. The simulation results indicate that only one floor can be built as a net zero source energy building if natural gas consumption converted into electrical energy consumption. To design more than two floors in new construction or to design more than one floor in existing building to make net zero energy, we need to use building site for energy production, in addition to the roof-top. Analysis methods for design and implementation of NZEBs are also discussed. The discussion is followed by several ways to achieve large-scale, replicable NZEBs performance. Various passive and renewable energy strategies are implemented, including full daylighting, high-performance lighting, natural ventilation, infiltration and thermal mass. Ground source heat pumps have been used for space conditioning as well domestic water heating. I certify that the Abstract is a correct representation of the content of this thesis. Chair, Project Committee Date
  • 5. iv PREFACE AND/OR ACKNOWLEDGEMENTS I want to thank Professor Ahmad Ganji for his immense support and guidance in the accomplishment of my project. I would like to thank him further for meeting with me every week and helping me solve all the doubts and providing detailed solutions. This helped me developed a lot of insights on NZE and gain conceptual knowledge during the span of this project. Professor Ganji was extremely helpful and generous throughout the project development. I would also like to thank Professor A.S Cheng to be my other committee chair professor for his assistance. I truly thank professor Cheng to support me during my entire stay at San Francisco State University.
  • 6. v TABLE OF CONTENTS Table of Contents………………………………………………………………………………...V List of Figures………………………………………………………………………………….VII List of Tables………………………………………………………………………………….VIII 1. Introduction……………………………………………………………………………………1 1.1. Problem Definition……………………………………………………………………….1 1.2. Project Scope………………………………………………………………………..........1 2. Climate Assessment…………………………………………………………………………....2 3. Energy Efficient Buildings………………………………………………………………….....3 3.1. Passive Design…………………………………………………………………………….4 3.2. Building Envelop………………………………………………………………………….8 3.3. Mechanical Systems………………………………………………………………………10 3.3.1. Traditional System…………………………………………………………………11 3.3.2. Heat Pumps………………………………………………………………………...11 3.4. Domestic Hot Water……………………………………………………………………...16 3.5. Lighting…………………………………………………………………………………..17 4. Renewable Energy…………………………………………………………………………….19 4.1. Solar Electric Generation…………………………………………………………………19 4.2. Solar Water Heating………………………………………………………………………20 5. Plug Loads and Occupancy……………………………………………………………………21 6. Modeling Simulation …………………………………………………………………………22 6.1 Building Specification…………………………………………………………………….22 6.2 Modeling Tool…………………………………………………………………………….23
  • 7. vi 6.3 Model Specification……………………………………………………………………….24 6.4. Modeling Results…………………………………………………………………………27 7. Simulation Verification………………………………………………………………………..34 8. Future of Net Zero Energy Building………………………………………………………......35 9. References……………………………………………………………………………………..36
  • 8. vii LIST OF FIGURES Figures Page 1. Night Purge Ventilation………………………………………………………5 2. Daylighting…………………………………………………………………... 7 3. Natural Ventilation…………………………………………………………... 8 4. Horizontal Closed loop Ground Source Heat pump System………………… 9 5. Vertical Closed loop Ground Source Heat pump System…………………….13 6. Pond/Lake Closed loop Ground Source Heat pump System………………….14 7. Open Loop Ground Source Heat Pump……………………………………… 15 8. Window Technology………………………………………………………….16 9. Commercial Building Use Breakdown……………………………………….21 10. Building Schematic…………………………………………………………..22
  • 9. viii LIST OF TABLES Table 6-1 Tabular inputs used in eQuest for baseline building, Energy Efficient techniques and Net Zero Energy for different location………………………...24 Table 6-2 Output of new office building with 50,000 Sqft in Phoenix, AZ for different floors…………………………………………………………………………….28 Table 6-3 Output of new office building with 100,000 Sqft in Phoenix, AZ for different floors…………………………………………………………………………….28 Table 6-4 Output of new office building with 50,000 Sqft in San Jose, CA for different floors…………………………………………………………………………….28 Table 6-5 Output of new office building with 100,000 Sqft in San Jose, CA for different floors…………………………………………………………………………….28 Table 6-6 Output of new office building with 50,000 Sqft in Chicago, IL for different floors…………………………………………………………………………….29 Table 6-7 Output of new office building with 100,000 Sqft in Chicago, IL for different floors…………………………………………………………………………….29 Table 6-8 Output of conventional office building with 100,000 Sqft in San Jose, CA for different floors…………………………………………………………………..30 Table 6-9 Output of conventional office building with 100,000 Sqft in Phoenix, AZ for different floors……………………………………………………………………30 Table 6-10 Output of conventional office building with 100,000 Sqft in Chicago, IL for different floors…………………………………………………………………...31 Table 6-11 Comparison between new and existing building parameters for Phoenix, AZ with different floors…………………………………………………………………...31 Table 6-12 Comparison between new and existing building parameters for San Jose, CA with different floors…………………………………………………………………...32 Table 6-13 Comparison between new and existing building parameters for Chicago, IL with different floors…………………………………………………………………...33 Table 6-14 Comparison between RSF building real data and my simulation output………...35
  • 10. 1 1. Introduction Buildings have a significant impact on energy use and the environment. Commercial and residential buildings use almost 40% of the primary energy in the United State (EIA 2005). The energy used by the building sector continues to increase, primarily because new buildings are constructed faster than existing ones are retired. Electricity consumption in the commercial building sector doubled between 1980 and 2000 and is expected to increase another 50% by 2025 (EIA 2005). To address the growing energy use in the commercial building sector, an influential community of industry leaders and researchers has committed to pushing the boundaries of building performance to develop net-zero energy buildings (NZEBs). Big bold goals adopted by California Public Utilities Commission (CPUC) in 2007-08 was, all new residential construction in California will be zero net energy by 2020. All new commercial construction in California will be zero net energy by 2030 (CPUC 2008). 1.1 Problem Definition At its core, the amount of energy consumed by building for entire year should be less than or equal to amount of energy produce by onsite renewable energy sources. The National Renewable Energy Laboratory (NREL) has defined four ways of measuring and defining net zero energy for buildings; net zero site energy, net zero source energy, net zero energy emissions, net zero energy cost. Net Zero Site Energy building produces at least as much renewable energy as it uses over the course of the year when accounted for the site (Torcellini 2006) Net Zero Source Energy building produces or purchases at least as much renewable energy as it uses over the course of a year when accounted for at the energy source (Torcellini 2006). Net Zero Energy Emission building produces or purchases enough emission-free renewable energy to offset emissions from all energy used in the building over the course of a year (Torcellini 2006). Net Zero Cost Building receives at least as much financial credit for exported renewable energy as it is charged for energy and energy services by the utility over the course of the year (Torcellini 2006). From the above definitions, the modeling simulation in this report is based on net zero site energy using roof mounted solar PV. 1.2 Project Scope The project is carried out to determine how many floors can be built in an energy efficient commercial building to make it a net zero site energy building with roof-top PV system as the energy source. The results are verified in different climates for all the buildings compliant with current standards. Two office buildings are taken into consideration each having 50,000 Sqft and 100,000 Sqft areas with maximum number of floors viable. The modelling is carried out in given
  • 11. 2 climatic conditions for the cities of San Jose, CA, Chicago, IL and Phoenix, AZ. The modeling simulation is developed using a ground source heat pump for heating and cooling source .Several passive architecture energy efficient techniques such as daylighting, energy efficient building envelope, lighting controls and natural ventilation are applied. In modeling of conventional buildings, CA Title 24 and ASHRAE 90.1 standards are utilized to check net zero energy possibilities. The results are compared with a new building to show the effects of energy efficient techniques. 2. Climate Assessment Climate is critical variable in the design of a net zero energy project. It influences external thermal loads of a project and it is also a free source of energy. Simply we can say that net zero energy project must be climate responsive. Climate classes are: A. Tropical B. Arid C. Temperate D. Cold E. Polar A. Tropical Tropical climates are characterized by yearlong hot and moist weather with rainfall and humidity. Example location: Miami, FL Design Response: • Reduce cooling load with passive strategies, such as minimizing solar radiation, reduce thermal conduction, reducing internal heat gain. • Daylight lowers lighting load and internal heat gain. Natural Ventilation is useful for some tropical climates. • Light colors for exterior surface will reflect rather than absorbs solar radiation. B. Arid Characterized by lack of precipitation. Can be hot or cold. Example locations: Nevada, Arizona, New Mexico. Design response: • Hot climates are cooling dominated and cold climates are heating dominated. • Night purge ventilation can also be effective for moderate cooling. • Provide natural ventilation and solar shading during cooling season.
  • 12. 3 C. Temperate Characterized by warm summer and cool winter. Example location: California Design response: • Hot climates are cooling dominated and cold climates are heating dominated. • Night purge ventilation can also be effective for moderate cooling. • Provide natural ventilation and solar shading during cooling season. D. Cold Characterized by cold winter with snow. Example location: Rochester, NY Design response: • Reduce heat transfer through conduction with well insulated building envelop • Hot climates are cooling dominated and cold climates are heating dominated. • Provide natural ventilation and solar shading during cooling season. E. Polar Extremely cold weather often with no summer season and typically treeless. No Human population. Example location: Arctic The simulation is performed for Phoenix, AZ as arid, San Jose, CA as temperate and Chicago, IL as cool and humid. 3. Energy Efficient Buildings Energy efficient buildings are the ones that use a minimum amount of energy throughout the year. To achieve energy efficiency, passive and active architecture strategies play vital roles. Passive architecture includes, daylighting, natural ventilation, air tightness of the building, and efficient building envelopes. Active architecture contains mechanical systems in the building like Heating Ventilation Air Conditioning (HVAC) and Domestic Hot Water (DHW). This section will provide a brief introduction of passive and active architectures, lighting systems in the building and their roles in energy efficient buildings. 3.1 Passive Design Passive design is defined as the use of architecture and climate to provide heating, cooling, ventilation and lighting. In other words technique which does not require any active systems. It is one of the most important parameters to a get free source of energy in net zero energy building for heating and cooling. However, we cannot rely totally on passive design to provide heating
  • 13. 4 and cooling so we still need active systems in the building, but the main aim is to minimize the use of active system’s usage (Hootman 2012). Passive Strategies Types This section includes different passive strategy types like, thermal mass, night purge, super insulation, air tightness, daylighting, and daylighting. Thermal Mass: In building design, thermal mass is a property of the mass of a building which enables it to store heat, providing "inertia" against temperature fluctuations. Thermal mass will absorb thermal energy when the surroundings are higher in temperature than the mass, and give thermal energy back when the surroundings are cooler, without reaching thermal equilibrium. Ideal materials for thermal mass are those materials that have: • High specific heat capacity, • High density Any solid, liquid, or gas that has mass will have some thermal mass. A common misconception is that only concrete or earth soil has thermal mass; even air has thermal mass (Hootman 2012). Night Purge: Night-Purge Ventilation (or "night flushing") keeps windows and other passive ventilation openings closed during the day, but open at night to flush warm air out of the building and cool thermal mass for the next day. Night-purge ventilation is useful when daytime air temperatures are so high that bringing unconditioned air into the building would not cool people down, but where night time air is cool or cold. This strategy can provide passive ventilation in weather that might normally be considered too hot for it (Hootman 2012). Night flushing works by opening up pathways for wind ventilation and stack ventilation throughout the night, to cool down the thermal mass in a building by convection. Early in the morning, the building is closed and kept sealed throughout the day to prevent warm outside air from entering. During the day, the cool mass absorbs heat from occupants and other internal loads. This is done largely by radiation, but convection and conduction also play roles (Hootman 2012). Figure 1 will give more idea about night purge ventilation.
  • 14. 5 Figure 1. Night Purge Ventilation Superinsulation: Superinsulation is an approach to building design, construction, and retrofitting that dramatically reduces heat loss (and gain) by using much higher levels of insulation and air tightness than normal. Superinsulation is one of the ancestors of the passive house approach (Hootman 2012). It is possible and increasingly desirable, to retrofit superinsulation to existing houses or buildings. The easiest way is often to add layers of continuous rigid exterior insulation and sometimes by building new exterior walls that allow more space for insulation. A vapor barrier can be installed on the outside of the original framing but may not be needed. An improved continuous air barrier is almost always worth adding, as conventional homes tend to be leaky, and such an air barrier can be important for energy savings and durability (Hootman 2012). Air Tightness: can be defined as the resistance to inward or outward air leakage through unintentional leakage points or areas in the building envelope. This air leakage is driven by
  • 15. 6 differential pressures across the building envelope due to the combined effects of the stack, external wind and mechanical ventilation systems. Air tightness is the fundamental building property that impacts infiltration. An airtight building has several positive impacts when combined with an appropriate ventilation system (whether natural, mechanical, or hybrid) (Hootman 2012). Daylighting: Daylighting is the controlled admission of direct and diffuse Sunlight into a building to reduce electric lighting and saving energy. A key feature of energy efficient commercial building design is maximizing the use of natural daylight to supplant electric lighting in interior spaces. Natural light entering through windows and skylights is not only free, but can also provide occupants with a feeling of connection to the outdoors. Moreover, when properly designed to minimize direct beam penetration, the use of natural daylight provides the most light for the least amount of internal heat gain an important quality given that even in northern climates mechanical cooling of interior spaces is often needed for much of the year. The dynamism of daylight provides visual and thermal comfort, but is also central to the regulation of human circadian rhythms. Daylight enhances our mood and focus, improves immune system function, and can even suppress drowsiness (Hootman 2012). Figure 2 will show office room with daylighting.
  • 16. 7 Figure 2. Daylighting Natural Ventilation: Natural ventilation is the process of supplying air to and removing air from an indoor space without using mechanical systems. It refers to the flow of external air to an indoor space as a result of pressure differences arising from natural forces. There are two types of natural ventilation occurring in buildings: wind driven ventilation and buoyancy-driven ventilation. Wind driven ventilation arises from the different pressures created by wind around a building or structure, and openings being formed at the perimeter which then permit flow through the building. Buoyancy-driven ventilation occurs as a result of the directional buoyancy force that results from temperature differences between the interior and exterior. Since the internal heat gains which create temperature differences between the interior and exterior are created by natural processes including the heat from people, and wind effects are variable, naturally ventilated buildings are sometimes called "breathing buildings" (Hootman 2012). Figure 3 will give more idea about building with natural ventilation.
  • 17. 8 Figure 3. Natural Ventilation 3.2 Building Envelop Building envelop plays a massive role in the implementation of passive strategies, and so should be integrated with mechanical and electrical design. The building envelop is a critical element in the energy performance of any building, but it is absolutely vital for the performance of net zero buildings. This section will describe important element involved in building envelop and their effects in energy performance. Walls: Energy efficient walls are built to minimize heat transfer. The R value, the measure of a material’s ability to stop the flow of heat is used to compare building material. The higher the R value greater the material will protect against energy loss. The total R value of wall takes into consideration all products from which wall is made. Insulation also plays an important role for energy efficient building. Thermally massive material have high density and a high specific heat capacity. Material such as, concrete, stone, masonry and water have the capability to store heat and release heat back into the environment once the ambient temperature cools. One of the primary benefits of thermal mass is its capability to even out temperature swings in the interior environment. Thermal mass
  • 18. 9 can also be used on the exterior envelop in the hot climate as a means of showing down temperature swings through the envelope (Hootman 2012). Windows: When selecting windows for energy efficiency, it's important to first consider their energy performance ratings in relation to climate and building design. A window's energy efficiency is dependent upon all of its components. Frames conduct heat, contributing to a window's overall energy efficiency, particularly its U-factor. Glazing or glass technologies have become very sophisticated, and designers often specify different types of glazing or glass for different windows, based on orientation, climate and building design (Haglund 2012). Figure 4 will give details of energy efficient window technology. Figure 4 Window Technology Another important consideration is how the windows operate, because some operating types have lower air leakage rates than others, which will improve energy efficiency.
  • 19. 10 Single glazing is a very poor insulator, with an R-value of about 1 (equivalent to U-1). Increasing the number of panes in a window improves the insulating value of the window, so clear double glazing has an R-value of about 2 (equivalent to U-0.5), and clear triple glazing has an R-value of about 3 (equivalent to U-0.33). The values for double or triple glazing can be further improved by including one or two low-e coatings and an inert gas fill between the panes. The best double- glazed windows have a whole-window U-factor of about 0.27, while the best triple-glazed windows which are used in present simulation have a whole-window U-factor of about 0.17 (Haglund 2012). Infiltration: Infiltration is the unintentional or accidental introduction of outside air into a building, typically through cracks in the building envelope and through use of doors for passage. Infiltration is sometimes called air leakage. The leakage of room air out of a building, intentionally or not, is called exfiltration. Infiltration is caused by wind, negative pressurization of the building, and by air buoyancy forces known commonly as the stack effect (Athienitis 2006). Because infiltration is uncontrolled, and admits unconditioned air, it is generally considered undesirable except for ventilation air purposes. Typically, infiltration is minimized to reduce dust, to increase thermal comfort, and to decrease energy consumption. For all buildings, infiltration can be reduced via sealing cracks in a building's envelope, and for new construction or major renovations, by installing continuous air retarders. In buildings where forced ventilation is provided, their HVAC designers typically choose to slightly pressurize the buildings by admitting more outside air than exhausting so that infiltration is dramatically reduced (Athienitis 2006). Reduced air infiltration combined with proper ventilation cannot only reduce energy bills, but it can also improve the quality of indoor air. Outdoor air that leaks indoor makes it difficult to maintain comfort and energy efficiency. As per Department of Energy (DOE) air leakage accounts for 25–40% of the energy used for heating and cooling in a typical building (Athienitis 2006). 3.3 Mechanical Systems The design of energy efficient building systems or mechanical systems for a net zero energy project is depends upon the passive architecture of the building. For most commercial building types, we cannot expect climate responsive architecture with passive strategies to meet all the desired interior function of the light, comfort, air quality and hot water all the time. Mechanical systems required to provide these functions when passive strategies alone are insufficient (Collyer 2012). This section includes a brief discussion of mechanical systems in conventional and new construction buildings.
  • 20. 11 3.3.1 Conventional Mechanical Systems For heating in conventional buildings boilers are used to generate steam or hot water and can be fired by natural gas, fuel oil, or coal. Their combustion efficiencies varies from 78% to 86%. Furnaces can be used for residential and small commercial heating systems. Furnaces use natural gas, fuel oil, and electricity for the heat source. Natural gas furnaces are available in condensing and non-condensing models (Graham 2014). In large commercial and institutional buildings, devices used to produce cool water are called chillers. The water is pumped to air handling units to cool the air. They use either mechanical refrigeration processes or absorption processes. Mechanical refrigeration chillers may have one or more compressors. These compressors can be powered by electric motors, fossil fuel engines, or turbines. Absorption chillers are heat-operated devices that produce chilled water via an absorption cycle. Absorption chillers can be direct-fired, using natural gas or fuel oil, or indirect- fired. Large and medium-sized air-cooled electric chillers have 0.95-0.85 kW/ton (COP of 3.7 to 4.1) (Graham 2014). 3.3.2 Heat Pumps For climates with moderate heating and cooling needs, heat pumps offer an energy-efficient alternative to furnaces and air conditioners. Like refrigerators, heat pumps use electricity to move heat from a cool space to a warm space, making the cool space cooler and the warm space warmer. During the heating season, heat pumps move heat from the cooler outdoors into the warmer environment and during the cooling season, heat pumps move heat from cooler environment into the warm outdoors. Because they move heat rather than generate heat, heat pumps can provide equivalent space conditioning at as little as one quarter of the cost of operating conventional heating or cooling appliances (Energy 2008). Classifications and operations of heat pumps are described in the following sections. Air Source Heat Pumps An air-source heat pump can provide efficient heating and cooling for the home. When properly installed, an air-source heat pump can deliver one-and-a-half to three times more heat energy to a home than the electrical energy it consumes. This is possible because a heat pump moves heat rather than converting it from a fuel like combustion heating systems do (Energy 2008). Air-source heat pumps have been used for many years in nearly all parts of the United States, but until recently they have not been used in areas that experienced extended periods of subfreezing temperatures. However, in recent years, air-source heat pump technology has advanced so that it now offers a real space heating alternative in colder regions (Energy 2008).
  • 21. 12 Ground Source Heat Pump Geothermal heat pumps (GSHPs), sometimes referred to as GeoExchange, earth-coupled, ground-source, or water-source heat pumps, have been in use since the late 1940s. They use the constant temperature of the earth as the exchange medium instead of the outside air temperature. This allows the system to reach fairly high Coefficient of Performance (COP) on the coldest winter nights, compared to air-source heat pumps on cool days (Energy 2008). Although many parts of the country experience seasonal temperature extremes -- from burning heat in the summer to sub-zero cold in the winter. A few feet below the earth's surface the ground remains at a relatively constant temperature. Depending on latitude, ground temperatures range from 45°F (7°C) to 75°F (21°C). Like a cave, this ground temperature is warmer than the air above it during the winter and cooler than the air in the summer. The GSHPs takes advantage of this by exchanging heat with the earth through a ground heat exchanger (Energy 2008). As with any heat pump, geothermal and water-source heat pumps are able to heat, cool, and, if so equipped, supply the building with hot water. Relative to air-source heat pumps, they are quieter, last longer, need little maintenance, and do not depend on the temperature of the outside air (Energy 2008). A dual-source heat pump combines an air-source heat pump with a geothermal heat pump. These appliances combine the best of both systems. Dual-source heat pumps have higher COP than air- source units, but are not as efficient as geothermal units. The main advantage of dual-source systems is that they cost much less to install than a single geothermal unit, and work almost as well (Energy 2008). Even though the installation price of a geothermal system can be several times that of an air- source system of the same heating and cooling capacity, the additional costs are returned as energy savings in 5 to 10 years. System life is estimated at 25 years for the inside components and 50+ years for the ground loop. There are approximately 50,000 geothermal heat pumps installed in the United States each year (Energy 2008). There are four basic types of ground loop systems. Three of these -- horizontal, vertical, and pond/lake -- are closed-loop systems. The fourth type of system is the open-loop option. Which one of these is best depends on the climate, soil conditions, available land, and local installation costs at the site (Energy 2008). During a given modeling simulation project, closed loop vertical system is used. All of these approaches can be used for residential and commercial building applications.
  • 22. 13 Ground Loop Most closed-loop geothermal heat pumps circulate an antifreeze solution through a closed loop usually made of plastic tubing that is buried in the ground or submerged in water. A heat exchanger transfers heat between the refrigerant in the heat pump and the antifreeze solution in the closed loop. The loop can be in a horizontal, vertical, or pond/lake configuration (Energy 2008). One variant of this approach, called direct exchange, does not use a heat exchanger and instead pumps the refrigerant through copper tubing that is buried in the ground in a horizontal or vertical configuration. Direct exchange systems require a larger compressor and work best in moist soils (sometimes requiring additional irrigation to keep the soil moist), should avoid installing in soils corrosive to the copper tubing. Because these systems circulate refrigerant through the ground, local environmental regulations may prohibit their use in some locations (Energy 2008). Horizontal Ground Loop This type of installation is generally more cost-effective for residential installations, particularly for new construction where sufficient land is available. It requires drains at least four feet deep. The most common layouts either use two pipes, one buried at six feet, and the other at four feet, or two pipes placed side-by-side at five feet in the ground in a two-foot wide trench (Energy 2008). Figure 5 will show closed loop horizontal system arrangements. Figure 5. Horizontal Closed loop Ground Source Heat pump System
  • 23. 14 Vertical Ground Loop Large commercial buildings and schools often use vertical systems because the land area required for horizontal loops would be prohibitive. Vertical loops are also used where the soil is too shallow for trenching, and they minimize the disturbance to existing landscaping. For a vertical system, holes (approximately four inches in diameter) are drilled about 20 feet apart and 100 to 400 feet deep. Into these holes go two pipes that are connected at the bottom with a U- bend to form a loop. The vertical loops are connected with horizontal pipe (i.e., manifold), placed in trenches, and connected to the heat pump in the building (Energy 2008). Figure 6 will show vertical closed loop system arrangements. Figure 6. Vertical Closed loop Ground Source Heat pump System Pond/Lake Loop If the site has a sufficient water body, this may be the lowest cost option. A supply line pipe is run underground from the building to the water and coiled into circles at least eight feet under the surface to prevent freezing. The coils should only be placed in a water source that meets minimum volume, depth, and quality criteria (Energy 2008). Figure 7 will show closed loop pond/lake arrangements.
  • 24. 15 Figure 7. Pond/Lake Closed loop Ground Source Heat pump System Open loop Systems This type of system uses well or surface body water as the heat exchange fluid that circulates directly through the ground heat pump system. Once it has circulated through the system, the water returns to the ground through the well, a recharge well, or surface discharge. This option is obviously practical only where there is an adequate supply of relatively clean water, and all local codes and regulations regarding groundwater discharge are met (Energy 2008). Figure 8 will show open loop system arrangements.
  • 25. 16 Figure 8. Open Loop Ground Source Heat Pump Hybrid Systems Hybrid systems using several geothermal resources, or a combination of a geothermal resource with outdoor air (i.e., a cooling tower), are another technology option. Hybrid approaches are particularly effective where cooling needs are significantly larger than heating needs. Where local geology permits, the "standing column well" is another option. In this variation of an open- loop system, one or more deep vertical wells are drilled. Water is drawn from the bottom of a standing column and returned to the top. During periods of peak heating and cooling, the system can bleed a portion of the return water rather than re-injecting it all, causing water inflow to the column from the surrounding aquifer. The bleed cycle cools the column during heat rejection, heats it during heat extraction, and reduces the required bore depth (Energy 2008). 3.4 Domestic Hot Water In conventional commercial buildings hot water is used for space heating and domestic hot water, and energy consumption for heating the water in commercial building is less as compare to other facilities like hotels, restaurants. Here ground source heat pump is used to heat water used for space heating and for domestic hot water.
  • 26. 17 Low Energy Hot Water: The following ideas can save energy used to produce hot water (Hootman 2012). Minimize water consumption is the best approach to reducing energy use. Installing low flow hot water fixtures and appliances is good way to reduce the amount of water consumption (Hootman 2012). Using Heat pump instead of boilers or electric heater. As per research heat pump are more efficient than boilers and electric heater (Hootman 2012). In domestic hot water, placing the heater close to the sink by using point of use water heater (Hootman 2012). Using a hot water recirculation loop with a close connection of the point of use (Hootman 2012). Grouping hot water fixtures close to heater locations (Hootman 2012). 3.5 Lighting Systems Lighting power density (LPD) limits are a major part of all current building energy codes. LPD sets maximum limit for the installed power over a specified area which is expressed in Watts per Square Foot (W/ft2). The LPD limit values found in energy codes are typically based on a space- type lighting model systems consisting currently available lighting product characteristics, light loss factors, building construction data, and professional design experience. These factors are used to calculate appropriate values for each building space type (Codes 2012). This Section includes description of indoor and outdoor lighting controls. Indoor Lighting Control Interior lighting is one of the largest electricity energy end-uses in many commercial buildings and controls can have a significant effect on their energy use. Interior lighting controls give occupants control over the electric lighting in a space, and can be used to manage building lighting automatically. Effectively controlling the space lighting results not only in occupant comfort, but also in energy savings. Efficient lamps and light fixtures reduce the total installed lighting power whereas controls generally reduce the amount of lighting used or the amount of time for which lighting is used. Lighting controls can be classified as those required across the entire building and those that must be applied space by space (Codes 2012).
  • 27. 18 Manual Control The basic control provided in all spaces is a wall switch that allows occupants to turn general lighting on and off. This manual control device must be easily accessible and must be located such that the lights it controls are seen easily from the control location. Manual controls provide a minimum level of comfort for occupants. Manual control is not required in spaces such as corridors, stairwells, or other spaces where turning the lights off would be damaging for entry and security (Codes 2012). Under ASHRAE Standard 90.1, for spaces smaller than 10,000 Sqft, one manual control device is required for every 2,500 Sqft. For spaces larger than 10,000 Sqft, one manual control device is required for every 10,000 Sqft (Codes 2012). Automatic Shutoff Control On/off controls and lighting reduction controls are manual controls that are needed in most spaces. However, these controls rely on occupants to obtain energy savings. There is no guarantee that these controls will save energy. When occupants are not present in a space and during the night, there is ample opportunity to turn lights off. Automatic lighting controls are required to control the lighting during these unoccupied periods. Automatic controls also guarantee energy savings from lighting (Codes 2012). Energy codes require that all building spaces be controlled by an automatic control device that shuts off general lighting. This control device must turn off lights in response to a time-based operation schedule, occupancy sensors that detect the absence of the occupants, or a signal from the building’s energy management system or some other system that indicates that the space is empty (Codes 2012). In ASHRAE Standard 90.1, the occupant must be able to reduce the lighting power to between 30% and 70% of full power using the manual control device. The International Energy Conservation Code (IECC) requires this stepped reduction to be lower than or equal to 50% of full power. Spaces such as corridors, stairways, electrical/mechanical rooms, public lobbies, restrooms, storage rooms, and sleeping units are exempted. Also exempted are spaces with only one luminaire with a rated power of less than 100 W and spaces with an LPD allowance of less than 0.6 W/ft2. The IECC exempts areas within spaces that are controlled either by an occupancy sensor or by daylighting controls (Codes 2012). Exterior lighting control The following controls are required by ASHRAE Standard 90.1. • Building façade and landscape lighting is required to be shut off between midnight or business closing, whichever is later, and 6 a.m. or business opening, whichever is earlier. The façade and landscape lighting at this building must be turned off from 2 a.m. through 6 a.m. (Codes 2012)
  • 28. 19 • All other lighting must be reduced by at least 30% of full power using either occupancy sensors to turn lights off within 15 minutes of sensing zero occupancy, or from midnight or one hour from close of business, whichever is later, until 6 a.m. or business opening, whichever is earlier (Codes 2012). 4. Renewable Energy Renewable energy is generally defined as energy that comes from resources which are naturally replenished on a human timescale, such as sunlight, wind, rain, tides, waves, and geothermal heat. Renewable energy replaces conventional fuels in four distinct areas: electricity generation, air and water heating/cooling, motor fuels, and rural (off-grid) energy services. To that end, this topic provides general guidance on planning renewable energy systems for net zero energy buildings, with focus on early planning and concepts needed to achieve effective integration into a net zero energy building (Hootman 2012). This topic heavily leans on solar electricity from photovoltaic systems as an important source of renewable energy for net zero energy buildings and brief discussion on solar water heating. 4.1 Solar Electric Generation Solar power is the conversion of sunlight into electricity, either directly using photovoltaics (PV), or indirectly using Concentrated Solar Power (CSP). Concentrated solar power systems use lenses or mirrors and tracking systems to focus a large area of sunlight into a small beam. Photovoltaics convert light into an electric current using the photovoltaic effect (Hootman 2012). A photovoltaic or PV system, is a powerful system designed to supply usable solar power by means of photovoltaics. It consists of an arrangement of several components, including solar panels to absorb and convert sunlight into electricity, a solar inverter to change the electric current from DC to AC, as well as mounting, cabling and other electrical accessories to set up a working system. It may also use a solar tracking system to improve the system's overall performance and include an integrated battery solution, as prices for storage devices are expected to decline PV systems range from small, rooftop-mounted or building-integrated systems with capacities from a few to several tens of kilowatts, to large utility-scale power stations of hundreds of megawatts. Nowadays, most PV systems are grid-connected, while off-grid or stand- alone systems only account for a small portion of the market (Hootman 2012). Classification of solar cells briefly describes in following section. Monocrystalline Solar Cells This type of solar cell is made from thin wafers of silicon cut from artificially grown crystals. These cells are created from single crystals grown in isolation, making them the most expensive of the three varieties (approximately 35% more expensive than equivalent polycrystalline cells),
  • 29. 20 but they have the highest efficiency rating between 15-24% (Hootman 2012). Monocrystalline Silicon is used in this project. Polycrystalline Solar Cells This type of solar cell is also made from thin wafers of silicon cut from artificially grown crystals, but instead of single crystals, these cells are made from multiple interlocking silicon crystals grown together, hence they are cheaper to produce, but their efficiency is lower than the monocrystalline Solar cells, currently at 13-18% (Hootman 2012). Thin Film Solar Cells These are the cheapest type of solar cell to produce, are relatively new to market and are produced very differently to the two other types. Instead of using crystals, Silicon is deposited very thinly on a backing substrate. There are two real benefits of the amorphous solar cell; firstly the layer of silicon is so thin it allows the solar cells to be flexible and secondly, they are more efficient in low light levels (like during winter). This however comes at a price; they have the lowest efficiency rating of all three types – approximately 7% – 9%, requiring approximately double the panel area to produce the same output. In addition, as this is a relatively new science, there is no agreed industry wide production technique, so they are not as robust as the other two types (Hootman 2012). Array Sizing and Energy Calculation There is an online tool which is very user friendly called PV Watts. This tool is supported by the National Renewable Laboratory (NREL). The calculator estimates the electricity production of a grid-connected roof- or ground-mounted photovoltaic system based on a few simple inputs. To use the calculator, type the address or geographic coordinates of the system's location, specify the system size and array orientation, and provide some information about the system's cost and electricity rates. PV Watts calculates estimated values for the system's annual, monthly and hourly electricity production, and for the monetary value of the electricity. (NREL 2011) 4.2 Solar Water Heating Solar water heating (SWH) is the conversion of sunlight into renewable energy for water heating using a solar thermal collector. Solar water heating systems consist of various technologies that are increasingly used worldwide. Since solar water heating is not included in the target simulated buildings, they are not discussed in this report.
  • 30. 21 5. Plug Loads and Occupancy Plug and process loads (PPLs) account for 33% of U.S. commercial building electricity consumption (McKenney, et. al. 2010). Minimizing these loads is a significant challenge in the design and operation of an energy-efficient building. (Lobato et al. 2011). (Lobato et al. 2012) define PPLs as energy loads that are not related to general lighting, heating, ventilation, cooling, and water heating, and that typically do not provide comfort to the occupants. The percentage of total building energy use from PPLs is increasing. According to the U.S. Department of Energy (DOE), by 2030, commercial building energy consumption is expected to increase by 24%; PPL energy consumption is anticipated to increase by 49% in the same time frame (DOE 2010). These trends illustrate the importance of PPL energy reduction to achieve an overall goal of reducing whole-building energy consumption (Griffith 2007). Figure 9 will show commercial building energy use breakdown. Figure 9. Commercial Building Energy Use Breakdown (Griffith 2007) Occupant Behavior Occupant behavior affects the building energy use directly and indirectly by opening/closing windows, turning on/off or dimming lights, turning on/off office equipment, turning on/off heating, ventilation, and air-conditioning (HVAC) systems, and setting indoor thermal, acoustic, and visual comfort criteria. Measured energy use of buildings demonstrated large discrepancies even between buildings with same functions and located in similar climates. Among various factors contributing to the discrepancies, occupant behavior is a driving factor. Occupant behavior is also one of the most significant sources of uncertainty in the prediction of building energy use by simulation programs due to the complexity and inherent uncertainty of occupant behavior. With the trend towards low energy buildings that reduce fossil fuel use and carbon
  • 31. 22 emissions, getting occupants actively involved during the design and operation of buildings is a key to achieving high energy performance without scarifying occupant comfort or productivity. Pilot projects demonstrated that low energy systems, such as natural ventilation, shading to control solar heat gains and glare, daylighting to dim lights, and demand controlled ventilation, especially need the interactions and collaborations of occupants. Energy savings from 5 to 30% were achieved by behavioral studies that motivate changes to occupant behavior (Tianzhen Hong 2013). 6. Modeling Simulation Results This section includes, conventional and new building specifications, description of modeling tools used in the project, building validation, which contains my simulation approach and tabular inputs used for baseline buildings and energy efficient buildings. It also includes simulation results for new buildings, older buildings and their comparison. 6.1 Building Specification • Building Type: Office buildings • Occupancy: 100Sqft/person • Area: 50,000 Sqft and 100,000 SqFt • Location: Phoenix, AZ, San Jose, CA, Chicago, IL • Baseline: ASHRAE 90.1 2013, California Title 24 2013 • Modeling Tool: eQuest by Department of Energy • Renewable Tool: PV Watts by NREL • Internal Loads: Task lighting, area lighting, miscellaneous loads, and occupancy • Miscellaneous Loads: Cooking equipment’s, plug loads, and computer server Building Schematic Figure 10. Building Schematic
  • 32. 23 In new construction for heating and cooling, ground source vertical closed loop heat pump is used. Due to use of a ground source heat pump, there is only electrical energy consumption in the building. The following energy efficient techniques used in the simulation. Default values in eQuest have been selected for energy efficient features. • Daylighting • Natural ventilation • Energy efficient building envelop • Energy efficient lighting and plug loads • Variable frequency drives • Ground source heat pump for heating and cooling • Ground source heat pumps for domestic hot water Conventional construction, which is built in 1980s uses chillers and boilers for cooling and heating. HVAC System type is multi zone air handler with hot water heating. No energy efficiency techniques were used. Following are the details. • No daylighting • No natural ventilation • Building envelop as per CA Title 24 1980 for location in California and ASHRAE 90.1 1980 for other locations • Lighting and plug loads as per CA Title 24 1980 for location in California and ASHRAE 90.1 1980 for other locations • No variable frequency drives • Both electrical and natural gas consumption in the building. Natural gas used for both domestic hot water and space heating For sizing of solar array following parameters were used. • DC system size depends on roof area of buildings. Calculated as, Size (kW) = Array Area (m²) × 1 kW/m² × Module Efficiency (%) • Monocrystalline PV module • Fixed array type • Array tilt 20 degree • Azimuth angle 180 degree • 60% of building roof area is covered with Solar array Note: For a fixed array, the azimuth angle is the angle clockwise from true north describing the direction that the array faces. An azimuth angle of 180° is for a south-facing array, and an azimuth angle of zero degrees is for a north-facing array. All the new buildings are south facing azimuth angle will be 180 degree for south facing array.
  • 33. 24 6.2 Modeling Tool eQuest is designed to provide whole building performance analysis to buildings professionals, i.e., owners, designers, operators, utility and regulatory personnel, and educators. Whole building analysis recognizes that building is a system of systems and that energy responsive design is a creative process of integrating the performance of interacting systems, e.g., envelop, fenestration, lighting, HVAC, and domestic hot water (Hirsch 2012). PV Watts Online Tool PV Watts estimates the energy production and cost of energy of grid-connected photovoltaic (PV) energy systems throughout the world. It allows homeowners, small building owners, installers and manufacturers to easily develop estimates of the performance of potential PV installations. PV Watts calculates estimated values for the system's annual, monthly and hourly electricity production, and for the monetary value of the electricity (NREL 2011). 6.3 Building Specifications Approach • Modeled one floor baseline buildings with area of 50,000 and 100,000 Sqft • Applying ASHRAE 90.1 2013 and CA Title 24 2013 standards and found out annual electrical energy consumption • Modeled same baseline buildings for three different locations; San Jose, CA, Phoenix, AZ, Chicago, IL and found out annual electrical consumption • Applying energy efficient techniques to baseline building to make it energy efficient buildings and derived annual electrical consumption for three different locations • By utilizing PV Watts online tool for sizing the solar array, derived electrical energy production for one floor energy efficient buildings for all three locations • Determined electrical energy consumption by gradually increasing floors for energy efficient buildings for all three different locations • Simultaneously sizing solar array for different floors to find out electrical energy production • After finding electrical energy consumption and production for different floors and locations, the main aim is to determine maximum number of floors that can be built to make net zero site energy using roof mounted solar PV. Tabular Inputs for New Construction Table 6-1 shows different inputs used in eQuest for baseline building, Energy Efficient techniques and Net Zero Energy for different locations.
  • 34. 25 Table 6-1 Tabular inputs used in eQuest for baseline building, Energy Efficient techniques and Net Zero Energy for different locations (San Jose, CA Chicago, IL and Phoenix, AZ) Components Baseline Energy Efficiency Techniques Net Zero Energy Cooling: DX Coil EER: 10.4 (ASHRAE 90.1), EER: 13.4 (B. Griffith, 2007) EER: 13.4 (B. Griffith, 2007) EER: 9.6 (CA Title 24) Heating: Ground Source Heat pump COP: 3.1 (ASHRAE 90.1), COP: 4.2 (B. Griffith, 2007) COP: 4.2 (B. Griffith, 2007) COP: 2.9 (CA Title 24) Variable Volume Fan Efficiency: 50% (ASHRAE 90.1) Efficiency: 70% (B. Griffith, 2007) Efficiency: 70% (B. Griffith, 2007) Efficiency: 50% (ASHRAE 90.1) Domestic Hot Water Heater Fuel Electricity Electricity Electricity Heater Type Heat pump Heat pump Heat pump COP 7 (ASHRAE 90.1) 7 (ASHRAE 90.1) 7 (ASHRAE 90.1) 7 (CA Title 24) 7 (CA Title 24) 7 (CA Title 24) Ground Source Heat pump GSHP loop Head 71.6 ft.(ASHRAE 90.1) 71.6 ft. (ASHRAE 90.1) 71.6 ft. (ASHRAE 90.1) 71.6 ft. (CA Title 24) 71.6 ft. (CA Title 24) 71.6 ft. (CA Title 24) Ground Heat Exchange (GHX) type Vertical well Vertical well Vertical well Loop temp: 30 F min and 110 F Max (ASHRAE 90.1) 30 F min and 110 F Max (ASHRAE 90.1) 30 F min and 110 F Max (ASHRAE 90.1) Continued on the following page
  • 35. 26 30 F min and 110 F Max (CA Title 24) 30 F min and 110 F Max (CA Title 24) 30 F min and 110 F Max. (CA Title 24) Loop Flow Constant with no Variable speed drive (VSD) Variable with Variable speed drive (VSD) Variable with variable speed drive (VSD) Building Envelop Window to wall ratio 52.3% (ASHRAE 90.1) 30% (B. Griffith, 2007) 30% (B. Griffith, 2007) 52.3% (CA Title 24) Window Glass Type Double clear (ASHRAE 90.1) Triple clear /Tint (B. Griffith, 2007) Triple clear /Tint (B. Griffith, 2007) Double clear (CA Title 24) Vertical Glazing with U Factor 0.57 (ASHRAE 90.1) Btu/h.Ft2.F, 0.40 (B. Griffith, 2007) Btu/h.Ft2.F 0.40 (B. Griffith,2007)Btu/h.Ft2.F 0.59 Btu/h.Ft2.F (CA Title 24) Steel Frame wall U Factor 0.084 (ASHRAE 90.1) Btu/h.Ft2.F, 0.064 (B. Griffith, 2007) Btu/h.Ft2.F 0.064 (B. Griffith, 2007) Btu/h.Ft2.F 0.082 Btu/h.Ft2.F, (CA Title 24) Roof Metal frame 0.055 Btu/h.Ft2.F (ASHRAE 90.1), 0.065 Btu/h.Ft2.F (CA Title 24) 0.023 Btu/h.Ft2.F (B. Griffith, 2007) 0.023 Btu/h.Ft2.F (B. Griffith, 2007) Floors wood Framed 0.051 Btu/h.Ft2.F (ASHRAE 90.1), 0.047 Btu/h.Ft2.F (B. Griffith, 2007) 0.047 Btu/h.Ft2.F (B. Griffith, 2007) 0.071 Btu/h.Ft2.F (CA Title 24) Windows Double Pane (ASHRAE 90.1) Triple pane Triple pane Double Pane (CA Title 24) Continued on the following page
  • 36. 27 Lighting Systems Area Lighting Fluorescent light Fluorescent light Fluorescent light Office 1.10 W/Ft2 (ASHRAE 90.1) 0.5 W/Ft2 (B. Griffith, 2007) 0.5 W/Ft2 (B. Griffith, 2007) 1.10 W/Ft2 (CA Title 24) Corridor 0.66 W/Ft2 (ASHRAE 90.1) 0.5 W/Ft2 (B. Griffith, 2007) 0.5 W/Ft2 (B. Griffith, 2007) 0.66 W/Ft2 (CA Title 24) Lobby 1.30 W/Ft2 (ASHRAE 90.1) 0.5 W/Ft2 (B. Griffith, 2007) 0.5 W/Ft2 (B. Griffith, 2007) 1.10 W/Ft2 (CA Title 24) Rest rooms 0.98 W/Ft2 (ASHRAE 90.1) 0.7 W/Ft2 (B. Griffith, 2007) 0.7 W/Ft2 (B. Griffith, 2007) 0.98 W/Ft2 (CA Title 24) Conference rooms 1.30 W/Ft2 (ASHRAE 90.1) 0.6 W/Ft2 (B. Griffith, 2007) 0.6 W/Ft2 (B. Griffith, 2007) 1.40 W/Ft2 (CA Title 24) Mechanical/ Electrical room 1.50 W/Ft2 (ASHRAE 90.1) 0.5 W/Ft2 (B. Griffith, 2007) 0.5 W/Ft2 (B. Griffith, 2007) 0.70 W/Ft2 (CA Title 24) Computer Server Room 1.50 W/Ft2 (ASHRAE 90.1) 1.1 W/Ft2 (B. Griffith, 2007) 1.1 W/Ft2 (B. Griffith, 2007) 0.70 W/Ft2 (CA Title 24) Miscellaneous load 0.75 W/Ft2 (Default eQuest) 0.6 W/Ft2 (B. Griffith, 2007) 0.6 W/Ft2 (B. Griffith, 2007) Continued on the following page
  • 37. 28 Passive architecture Day lighting No Yes with Day lighting Sensors Yes with Day lighting Sensors Occupancy sensors No Yes Yes Natural Ventilation No Yes Yes Night Purge ventilation No Yes Yes Waste Heat Recovery No Yes Yes 6.4 Modeling Results Tables 6-2 to 6-7 show the output of new office building with different sizes, locations and number of floors. Table 6-2 Output of new office building with 50,000 Sqft in Phoenix, AZ for different number of floors Table 6-3 Output of new office building with 100,000 Sqft in Phoenix, AZ for different number of floors Floors Roof Area Annual Electricity Consumption Annual Electrical Production Net Zero Site Energy (roof mounted solar PV) 1 50,000 Sqft 446,480 kWh 944,471 kWh Yes 2 25,000 Sqft 462,130 kWh 475,018 kWh Yes 3 16,670 Sqft 480,060 kWh 311,931 kWh No Floors Roof Area Annual Electricity Consumption Annual Electrical Production Net Zero Site Energy (roof mounted solar PV) 1 100,000 Sqft 870,360 kWh 1,888,942 kWh Yes 2 50,000 Sqft 900,800 kWh 944,471 kWh Yes 3 33,330 Sqft 918,520 kWh 623,862 kWh No
  • 38. 29 Table 6-4 Output of new office building with 50,000 Sqft in San Jose, CA for different number of floors Table 6-5 Output of new office building with 100,000 Sqft in San Jose, CA for different number of floors Table 6-6 Output of new office building with 50,000 Sqft in Chicago, IL for different number of floors Floors Roof Area Annual Electricity Consumption Annual Electrical Production Net Zero Site Energy (roof mounted solar PV) 1 50,000 Sqft 378,190 kWh 824,189 kWh Yes 2 25,000 Sqft 390,060 kWh 413,649 kWh Yes 3 16,670 Sqft 397,330 kWh 275,248 kWh No Floors Roof Area Annual Electricity Consumption Annual Electrical Production Net Zero Site Energy (roof mounted solar PV) 1 100,000 Sqft 748,640 kWh 1,648,377 kWh Yes 2 50,000 Sqft 761,470 kWh 824,189 kWh Yes 3 33,330 Sqft 770,620 kWh 550,496 kWh No Floors Roof Area Annual Electricity Consumption Annual Electrical Production Net Zero Site Energy (roof mounted solar PV) 1 50,000 Sqft 328,430 kWh 677,148 kWh Yes 2 25,000 Sqft 336,070 kWh 339,882 kWh Yes 3 16,670 Sqft 342,030 kWh 230,000 kWh No
  • 39. 30 Table 6-7 Output of new office building with 100,000 Sqft in Chicago, IL for different number of floors Net Zero Energy of Conventional Construction • Building Type: Office building • 1980s construction • Area: 100,000 SqFt • Location: Phoenix, AZ, San Jose, CA, Chicago, IL • Modeling Tool: eQuest by Department of Energy • Renewable Tool: PV Watts by NREL • Occupancy: 100 SqFt/person • No passive architecture • Standard Chillers and Boilers • Baseline lighting density (CA title 24, ASHRAE 90.1) • Baseline building envelop (CA title 24, ASHRAE 90.1) • No Variable Frequency Drive The section from Tables 6-8 to 6-10 gives an output of conventional construction office building for 100,000 Sqft with different locations and number of floors Floors Roof Area Annual Electricity Consumption Annual Electrical Production Net Zero Site Energy (roof mounted solar PV) 1 100,000 Sqft 664,490 kWh 1,354,297 kWh Yes 2 50,000 Sqft 676,660 kWh 677,148 kWh Yes 3 33,330 Sqft 683,640 kWh 338,574 kWh No
  • 40. 31 Location: San Jose, CA Table 6-8 Output of conventional office building with 100,000 Sqft in San Jose, CA for different number of floors Location: Phoenix, AZ Table 6-9 Output of conventional office building with 100,000 Sqft in Phoenix, AZ for different number of floors Note: One floor can be converted into Net Zero Source Energy in both San Jose, CA and Phoenix, AZ if annual gas consumption converted into electrical consumption. Floors Roof Area Annual Electricity Consumption Annual Electrical Production Annual Gas Consumption kBtu Net Zero Site Energy (roof mounted solar PV) 1 100,000 Sqft 903,150 kWh 1,648,377 kWh 1,248,900 Yes 2 50,000 Sqft 944,250 kWh 824,189 kWh 1,296,900 No 3 33,330 Sqft 972,840 kWh 550,496 kWh 1,370,300 No Floors Roof Area Annual Electricity Consumption Annual Electrical Production Annual Gas Consumption kBtu Net Zero Site Energy (roof mounted solar PV) 1 100,000 Sqft 1,151,600 kWh 1,888,942 kWh 771,300 Yes 2 50,000 Sqft 1,215,500 kWh 944,471 kWh 831,840 No 3 33,330 Sqft 1,265,600 kWh 623,862 kWh 893,550 No Continued on the following page
  • 41. 32 Location: Chicago, IL Table 6-10 Output of conventional office building with 100,000 Sqft in Chicago, IL for different number of floors Comparison between New and Conventional Building Parameters In this section from Tables 6-11 to 6-13 gives comparison between new and conventional building parameters for 100,000 Sqft for different location Table 6-11 Comparison between new and conventional building parameters for Phoenix, AZ with different number of floors. Floors Roof Area Annual Electricity Consumption Annual Electrical Production Annual Gas Consumption kBtu Net Zero Site Energy (roof mounted solar PV) 1 100,000 Sqft 962,800 kWh 1,354,297 kWh 1,960,000 No 2 50,000 Sqft 1,012,000 kWh 677,148 kWh 2,008,000 No 3 33,330 Sqft 1,047,300 kWh 338,574 kWh 2,051,000 No Sector Floors New building Conventional building Space Cooling 1 233,030 kWh 245,200 kWh 2 256,780 kWh 293,700 kWh 3 268,280 kWh 317,900 kWh Space Heating 1 0 337,360 kBtu 2 0 437,830 kBtu 3 0 499,610 kBtu Continued on the following page
  • 42. 33 Table 6-12 Comparison between new and conventional building parameters for San Jose, CA with different number of floors. Hot Water 1 68,230 kWh 393,930 kBtu 2 68,230 kWh 394,000 kBtu 3 68,230 kWh 393,940 kBtu Ventilation Fans 1 34,580 kWh 98,200 kWh 2 43,170 kWh 113,900 kWh 3 51,470 kWh 120,600 kWh Pump & Auxiliary 1 18,520 kWh 48,900 kWh 2 20,900 kWh 62,800 kWh 3 21,520 kWh 69,300 kWh Sector Floors New building Conventional building Space Cooling 1 141,510 kWh 155,520 kWh 2 155,550 kWh 179,700 kWh 3 162,860 kWh 191,800 kWh Space Heating 1 0 773,200 kBtu 2 0 821,900 kBtu 3 0 895,400 kBtu Hot Water 1 70,150 kWh 475,700 kBtu 2 70,150 kWh 475,000 kBtu 3 70,150 kWh 474,900 kBtu
  • 43. 34 The space heating shows negligibly small at San Jose, CA and Phoenix, AZ; most probably due to higher thermal mass and higher U value of insulation. The same building was simulated using boiler for space heating keeping all the other parameters same. The result was shown to be, 2800 kBtu. Repeated simulation were made and small values were shown for space heating which may be an artifact of the simulation. Table 6-13 Comparison between new and conventional building parameters for Chicago, IL with different number of floors. Ventilation Fans 1 17,830 kWh 71,200 kWh 2 20,790 kWh 76,200 kWh 3 23,100 kWh 78,500 kWh Pump & Auxiliary 1 12,350 kWh 41,260 kWh 2 13,620 kWh 51,500 kWh 3 14,460 kWh 56,800 kWh Sector Floors New building Conventional building Space Cooling 1 89,010 kWh 152,130 kWh 2 102,650 KWh 184,000 kWh 3 117,520 kWh 200,000 kWh Space Heating 1 33,260 kWh 1,416,500 kBtu 2 36,870 kWh 1,475,000 kBtu 3 40,210 kWh 1,517,350 kBtu Hot Water 1 55,910 kWh 532,500 kBtu 2 55,910 kWh 533,000 kBtu 3 55,910 kWh 533,650 kBtu Continued on the following page
  • 44. 35 Summarization of Results New building: By roof mounted solar array and by using energy efficient techniques it is possible to make buildings a net zero site energy, two floors can be built regardless of location and area. For more floors, then it has to make use of surrounding space like a parking lot. Conventional Building: By simulating and sizing solar array for conventional buildings with same area and location, it is observed that only one floor can be zero net site energy using roof mounted solar PV if natural gas consumption is converted into electrical consumption. With comparatively high electrical energy consumption to that of new construction, further floors cannot be make zero net site energy using roof mounted solar PV. As it is conventional construction, there is no ground source heat pump installed in the building so has both electrical and natural gas consumption. By having natural gas consumption, it is very difficult to make more than one floor zero net site energy using roof mounted solar PV. 7. Simulation Verification To verify simulation, I modeled similar building whose results are available to us. In this case I modeled Research Support Facility (RSF) office, which is Net Zero Energy located in Colorado (Hootman 2012). I used all the energy efficient techniques to verify my simulation project. Project Data (Hootman 2012): Building Area: 222,000 Sqft Floors: 4 story building Location: Denver, CO Ventilation Fans 1 14,390 kWh 65,820 kWh 2 16,700 kWh 80,500 kWh 3 17,800 kWh 85,500 kWh Pump & Auxiliary 1 10,080 kWh 50,270 kWh 2 11,490 kWh 61,300 kWh 3 12,410 kWh 67,300 kWh
  • 45. 36 Climate Zone: 5B; Cool, Dry Occupant: 822 Occupied hours per week: 50 Hrs. Roof Area: 69, 950 Sqft Data Center Energy: 65 Watts/person for 1200 occupants on campus will be 683,280 kWh/year Total Energy Consumption: 2254 MWh/yr My simulation Output: Data Center Energy: 65 Watts/person for 1200 occupants on campus will be 683,280 KWh/ year Total Energy consumption: 2285 MWh Table 6-14 Comparison between RSF building real data and my simulation output Points RSF building real data Simulation output Final Design Energy Use intensity 33.2 kBtu/ft2/yr 35.12 kBtu/ft2/yr Annual Energy consumption 2254 MWh/yr 2285 MWh/yr By modeling RSF building and getting output similar to real data verifies all the energy efficient techniques used in simulation project. 8. Future of Net Zero Energy Building Net zero energy (NZE) is still a relatively new movement; only a small percentage of current building construction has a goal of NZE. However, efforts are increasing, with a doubling in the number of commercial NZE buildings over the last two years. Policies and programs can dramatically change the landscape for Net Zero Energy (NZE) buildings. California Public Utilities Commission (CPUC) adopted the big bold Initiative, which focused that all new residential and commercial construction be NZE by 2020 and 2030 respectively. As per my view, reduction, reuse, and renewables are three main steps towards zero net energy. Reduction must come first, ideally by load reduction followed by efficiency measures. Reuse comes next, with a focus on creatively putting waste energy in the systems back into beneficial use. Renewable will produce energy which will help to achieve net zero design. Below are my suggestions which can be helpful towards future of Net Zero Energy Buildings.
  • 46. 37 • Passive architecture is a fundamental prerequisite for net zero energy buildings. Appropriate use of passive architecture can reduce in significant amount of heating and cooling load. • Use of ground source heat pump instead of boilers and chillers for heating, cooling, and domestic hot water can reduce in significant amount of electrical consumption in the buildings and there will not be any natural gas consumption in the buildings. • Using energy efficient lighting fixtures and lighting controls can lower electrical consumption • Using variable speed drives can lower electrical consumption • Waste heat recovery technique is also very useful towards energy reduction process • Reduction in building plug loads and behavioral changes also very important towards net zero energy. 9. References Athienitis, A. 2006. Design and Optimization of Net Zero Energy Solar Homes. ASHRAE Report, American Society of Heating, Refrigerating and Air-Conditioning Engineers Inc. Griffith, B., N. Long, P. Torcellini, and R. Judkoff. 2007. Assessment of the Technical Potential for Achieving Net Zero-Energy Buildings in the Commercial Sector. Technical Report, National Renewable Laboratory. California Public Utilities commission. 2008. Accessed December 6, 2015. http://www.cpuc.ca.gov/NR/rdonlyres/C27FC108-A1FD-4D67-AA59- 7EA82011B257/0/3.pdf. Codes, E. 2012. "Lighting Development, Adoption and Compliance Guide." Building Technology program. September. Accessed December 2, 2015. https://www.energycodes.gov/sites/default/files/documents/Lighting_Resource_Guide. pdf. Collyer, B. 2012. Zero Net Energy Program. Pacific Gas and Electric Company Report, San Francisco: Pacific Gas and Electric Company. Department of Energy. 2008. Accessed December 6, 2015. http://energy.gov/energysaver/solar-water-heaters. —. 2008. Accessed November 18, 2015. http://energy.gov/energysaver/heat-pump-systems.
  • 47. 38 —. 2009. eQUEST. Sepetmber. Accessed November 2015. http://www.doe2.com/equest/. Haglund, K. 2012. Department Of Energy. Northenstar. November. Accessed November 18, 2015. http://apps1.eere.energy.gov/buildings/publications/pdfs/building_america/measure_g uide_windows.pdf. Harrell, G. 2009. ENERGY MANAGEMENT SERVICES. PhD Thesis, Tennessee: National Renewable Laboratory. Hirsch. 2012. eQuest Introductory Tutorial. Tutorial, Camarillo: Department of Energy. Hong, T., H. Lin. 2013. Occupant Behavior: Impact on Energy Use of Private Offices. Publish Report, Ernest Orlando Lawrence Berkeley National Laboratory, 12. Hootman, T. 2012. Net Zero Energy Design: Commercial buildings, New jersey: John Wiley & Sons, Inc. Kwatra, S., J. Amann, H. Saches. 2013. Miscellaneous Energy Loads in Building. Published Report, Washington: American Council of Energy Efficienct Economy. National Renewable Energy Laboratory (NREL). 2011. PV Watts. Accessed December 10, 2015. http://pvwatts.nrel.gov/pvwatts.php. Sheppy, M., C. Lobato, S. Pless, L. Polese, and P. Torcellini. 2012. Assessing and Reducing Plug and Process Loads in Office Buildings. Fact Sheet, Denver: National Renewable Research Laboratory. Torcellini, P. 2006. Zero Energy Buildings: A Critical Look at the Definition. Published Report, Denver: National Research Laboratory, 15. Torcellini, P., S. Pless, and C. Lobato. 2010. Main Street Net-Zero Energy Buildings: The Zero Energy Method in Concept and Practice. Case Study, Phoenix: National Research Laboratry.