Download as PDF, PPTX
![Focusing on Net Zero in commercial buildings
US Energy Consumption by Sector
• Macro drivers for energy efficiency
– Rising energy costs
– Growing GHG emissions
– Sustainability goals/image
~5 M bldgs … highest
energy intensity
Identified as top 3
issues for building
owners
[Energy Efficiency
Indicator survey]
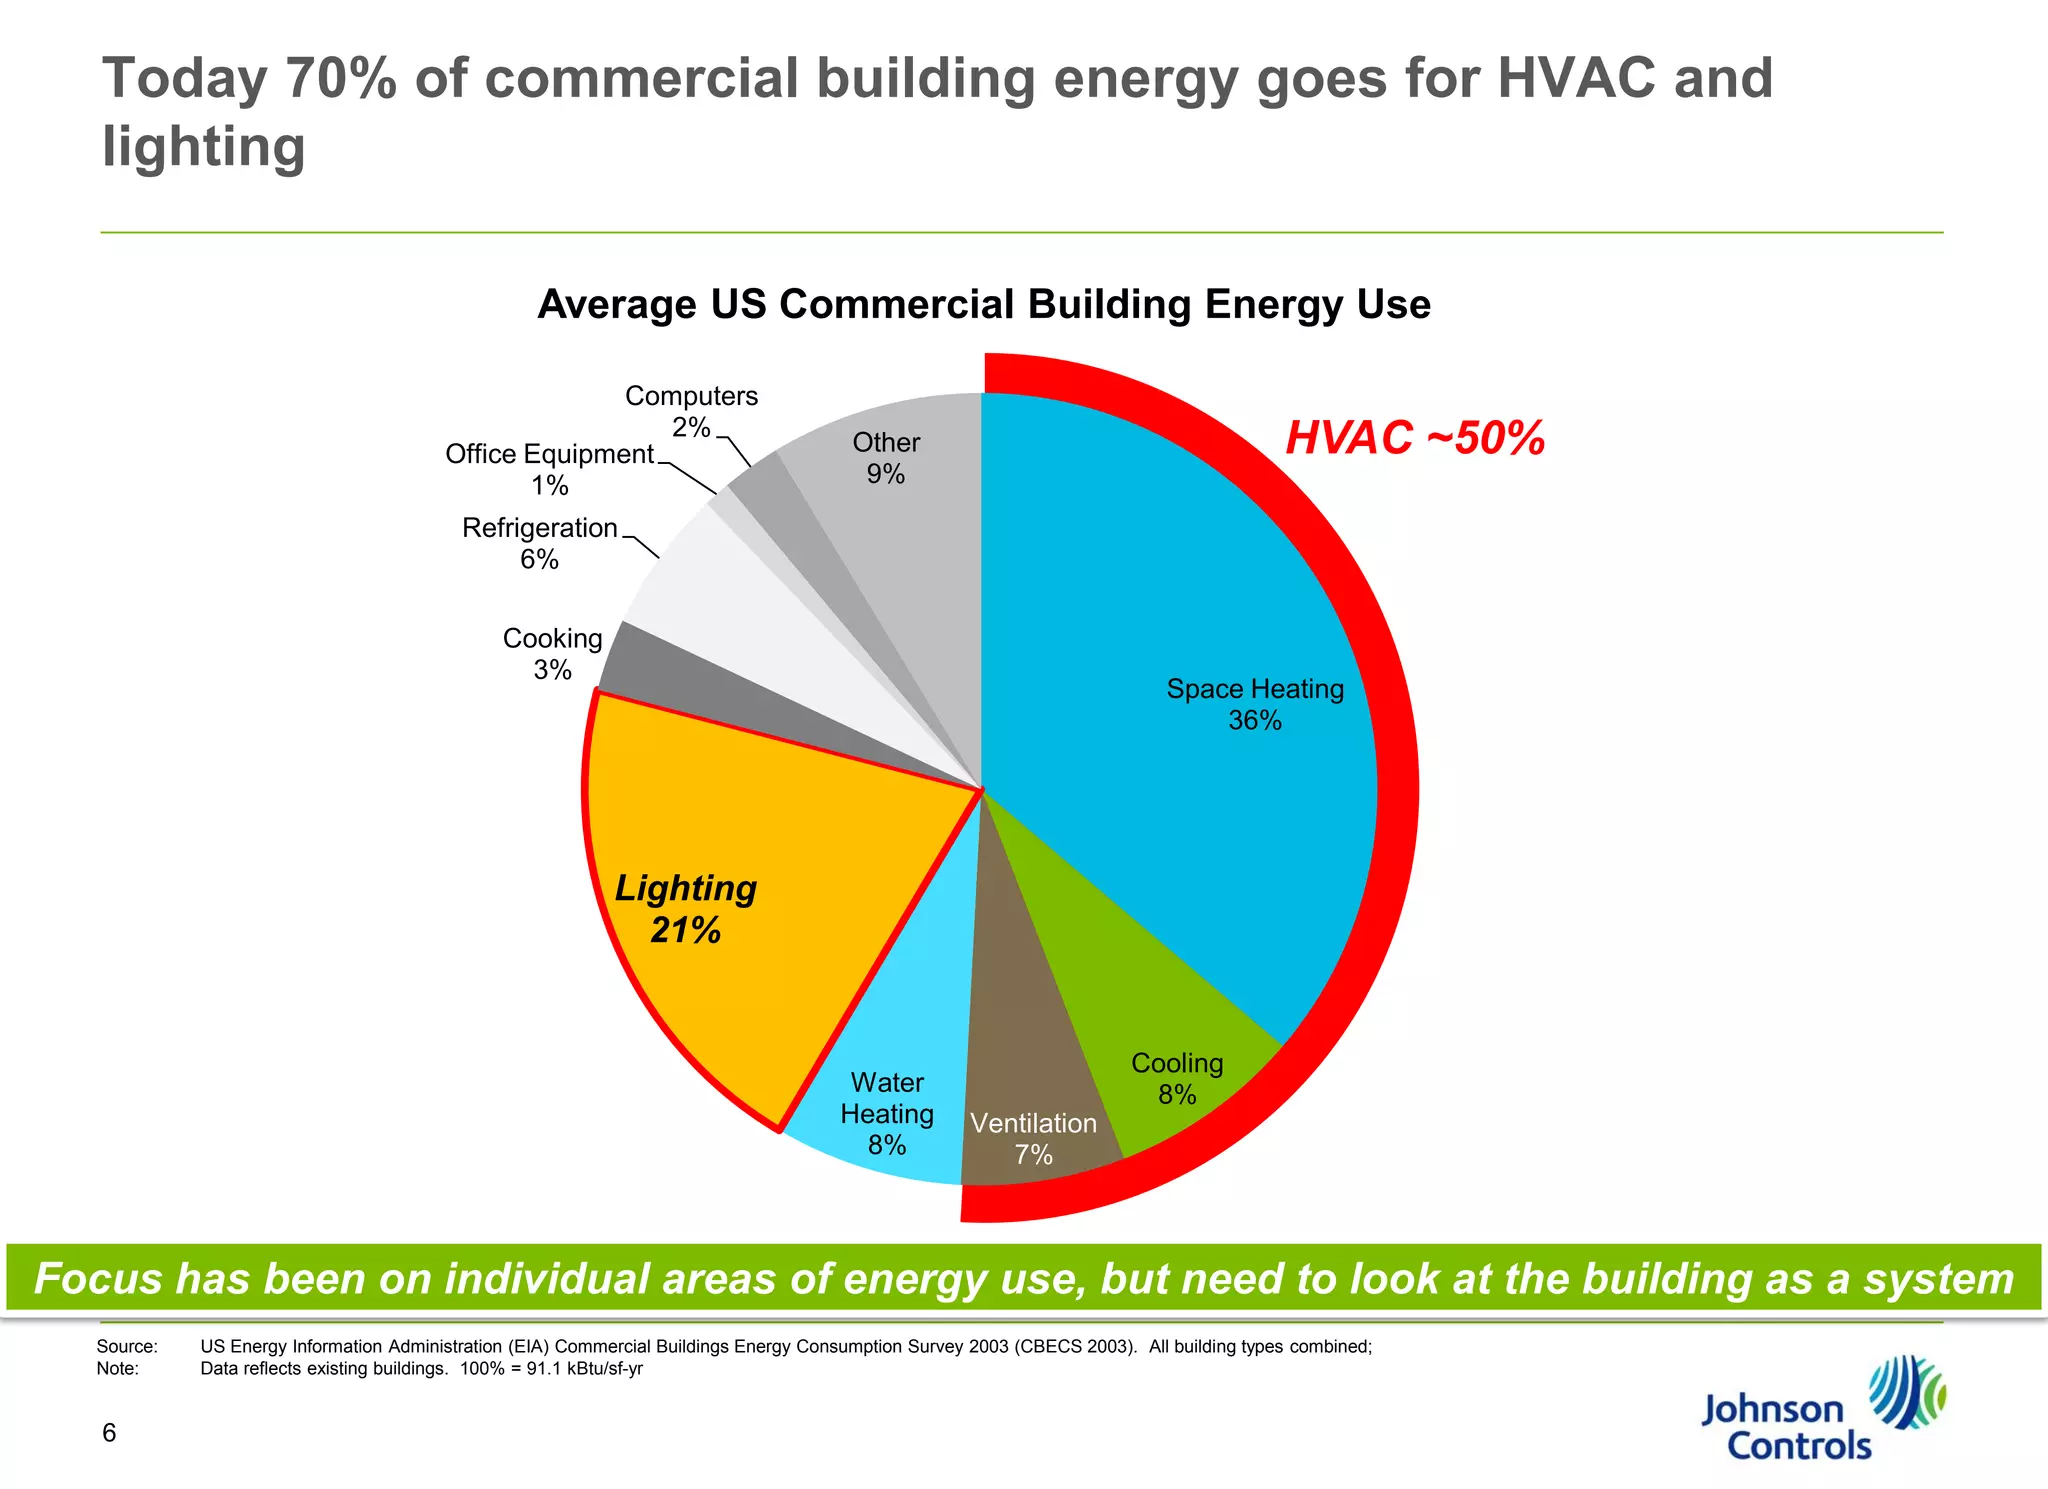
• Buildings consume more energy
than any other sector … ~40%
• Commercial buildings are the most
energy intense
Transportation
28%
Commercial
18%
250 M+
vehicles
Residential
22%
– 4.5X residential energy use per sq-ft
• Commercial building energy use
growing faster than other sectors
~115 M
households
Industrial
32%
Buildings 40%
Commercial building sector has highest energy intensity
Sources: 1) Architecture 2030; 2) US Energy Information Administration; 3) US Environmental Protection Agency; 4) Institute for Building Efficiency’s Energy Efficiency
3](https://image.slidesharecdn.com/netzeroenergyandbeyond-140228115303-phpapp02/75/Net-zero-energy-and-beyond-3-2048.jpg)
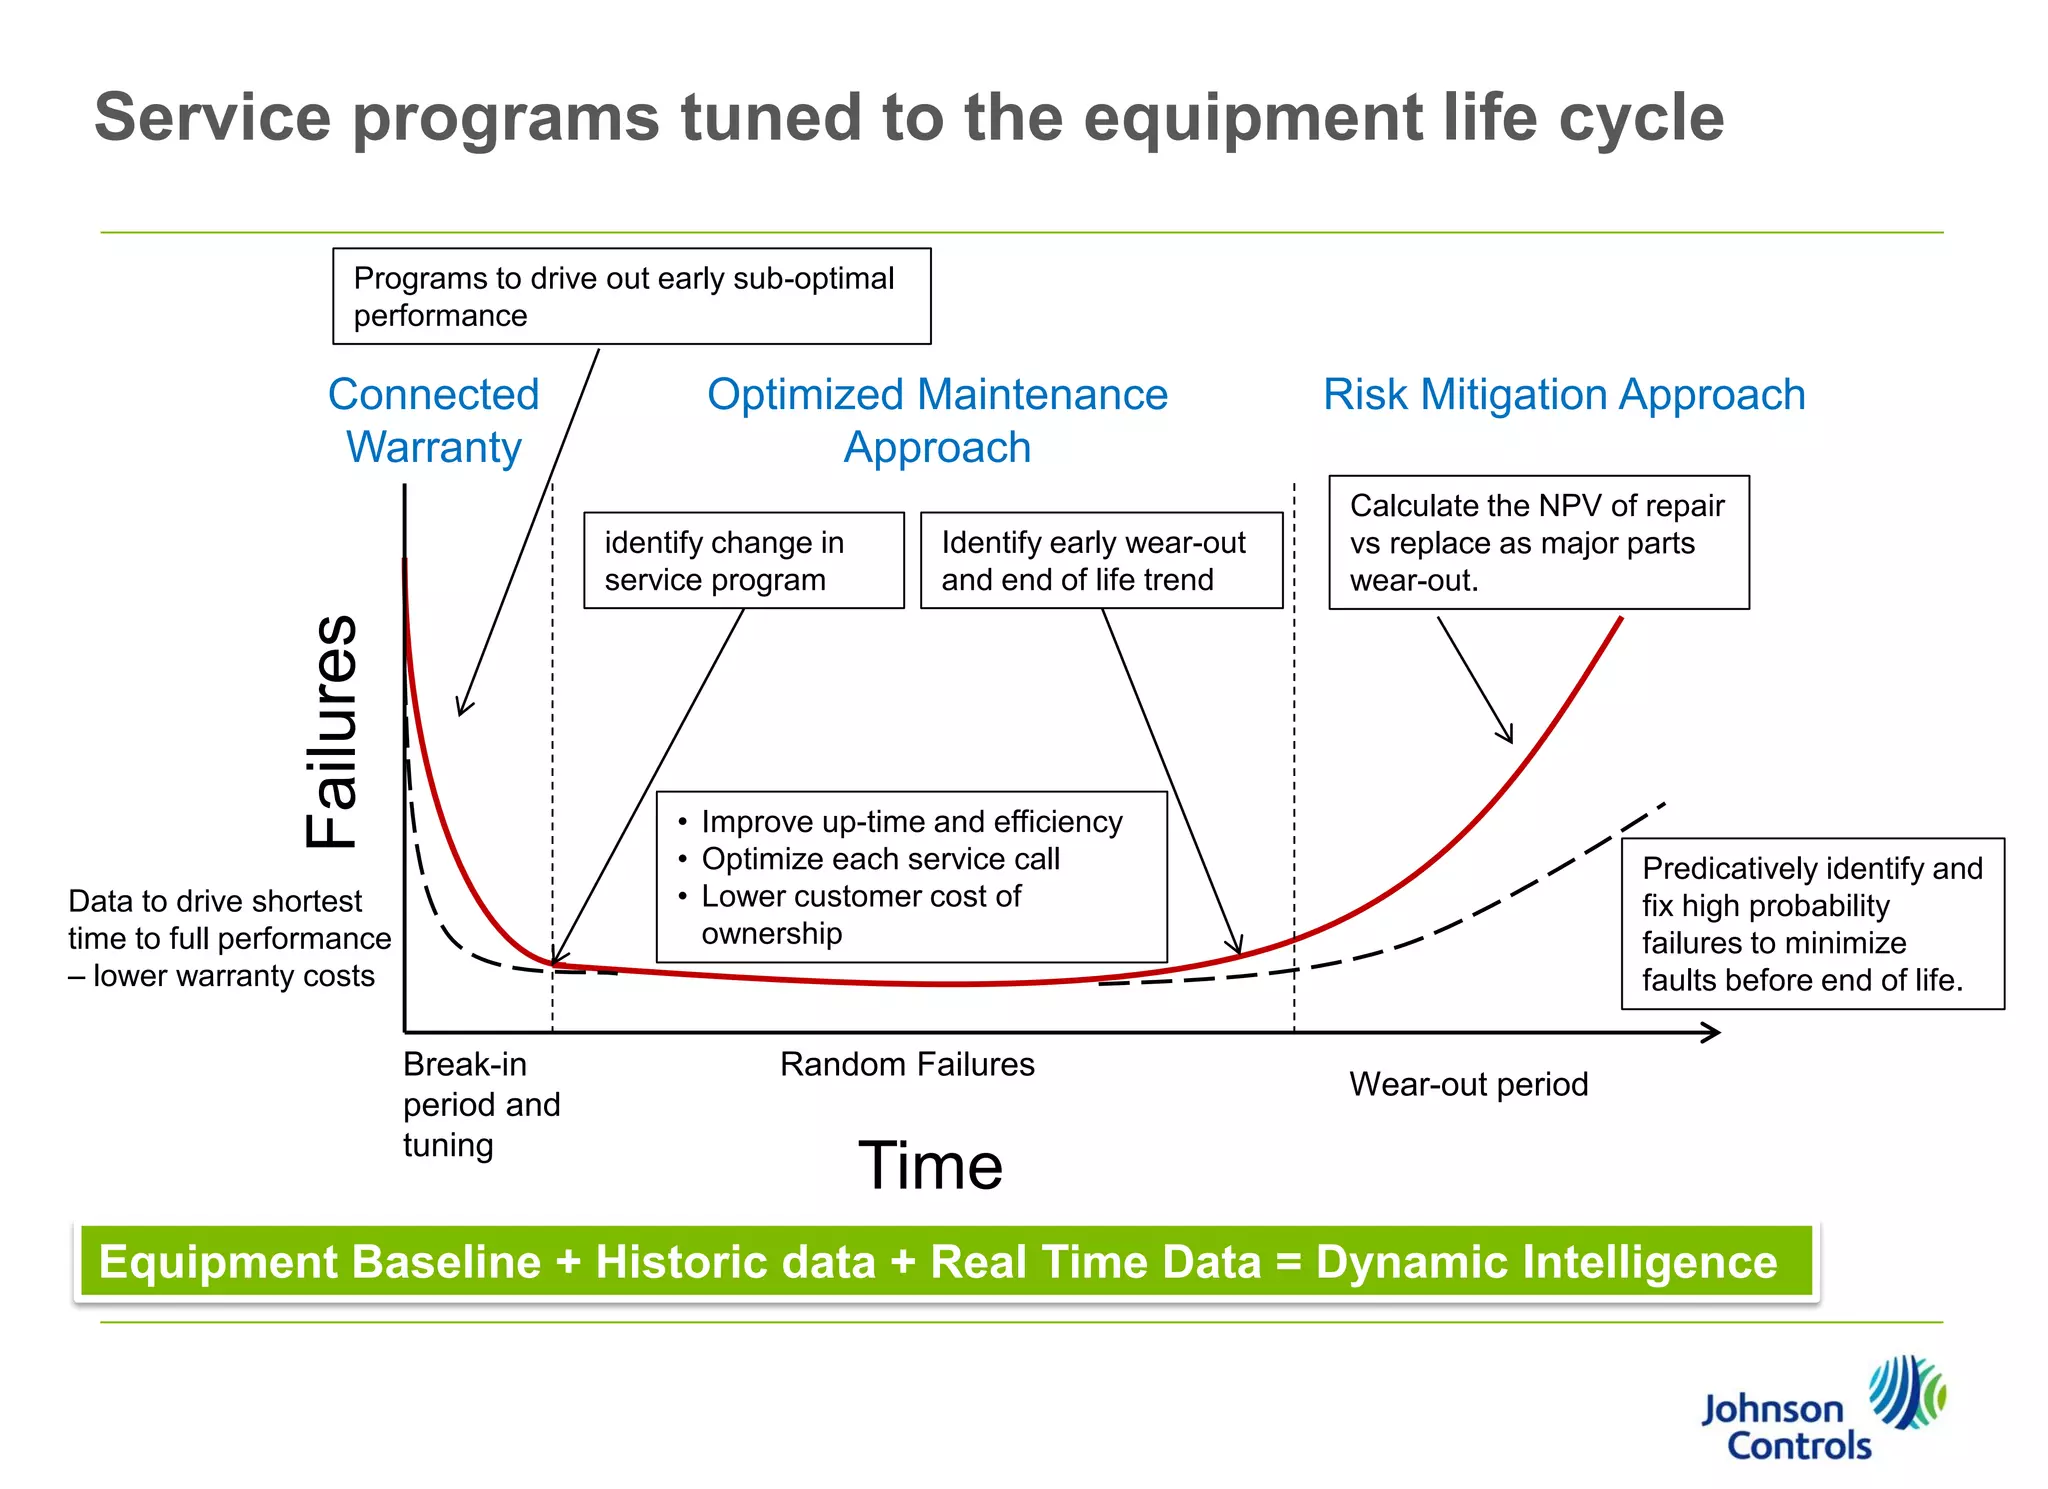
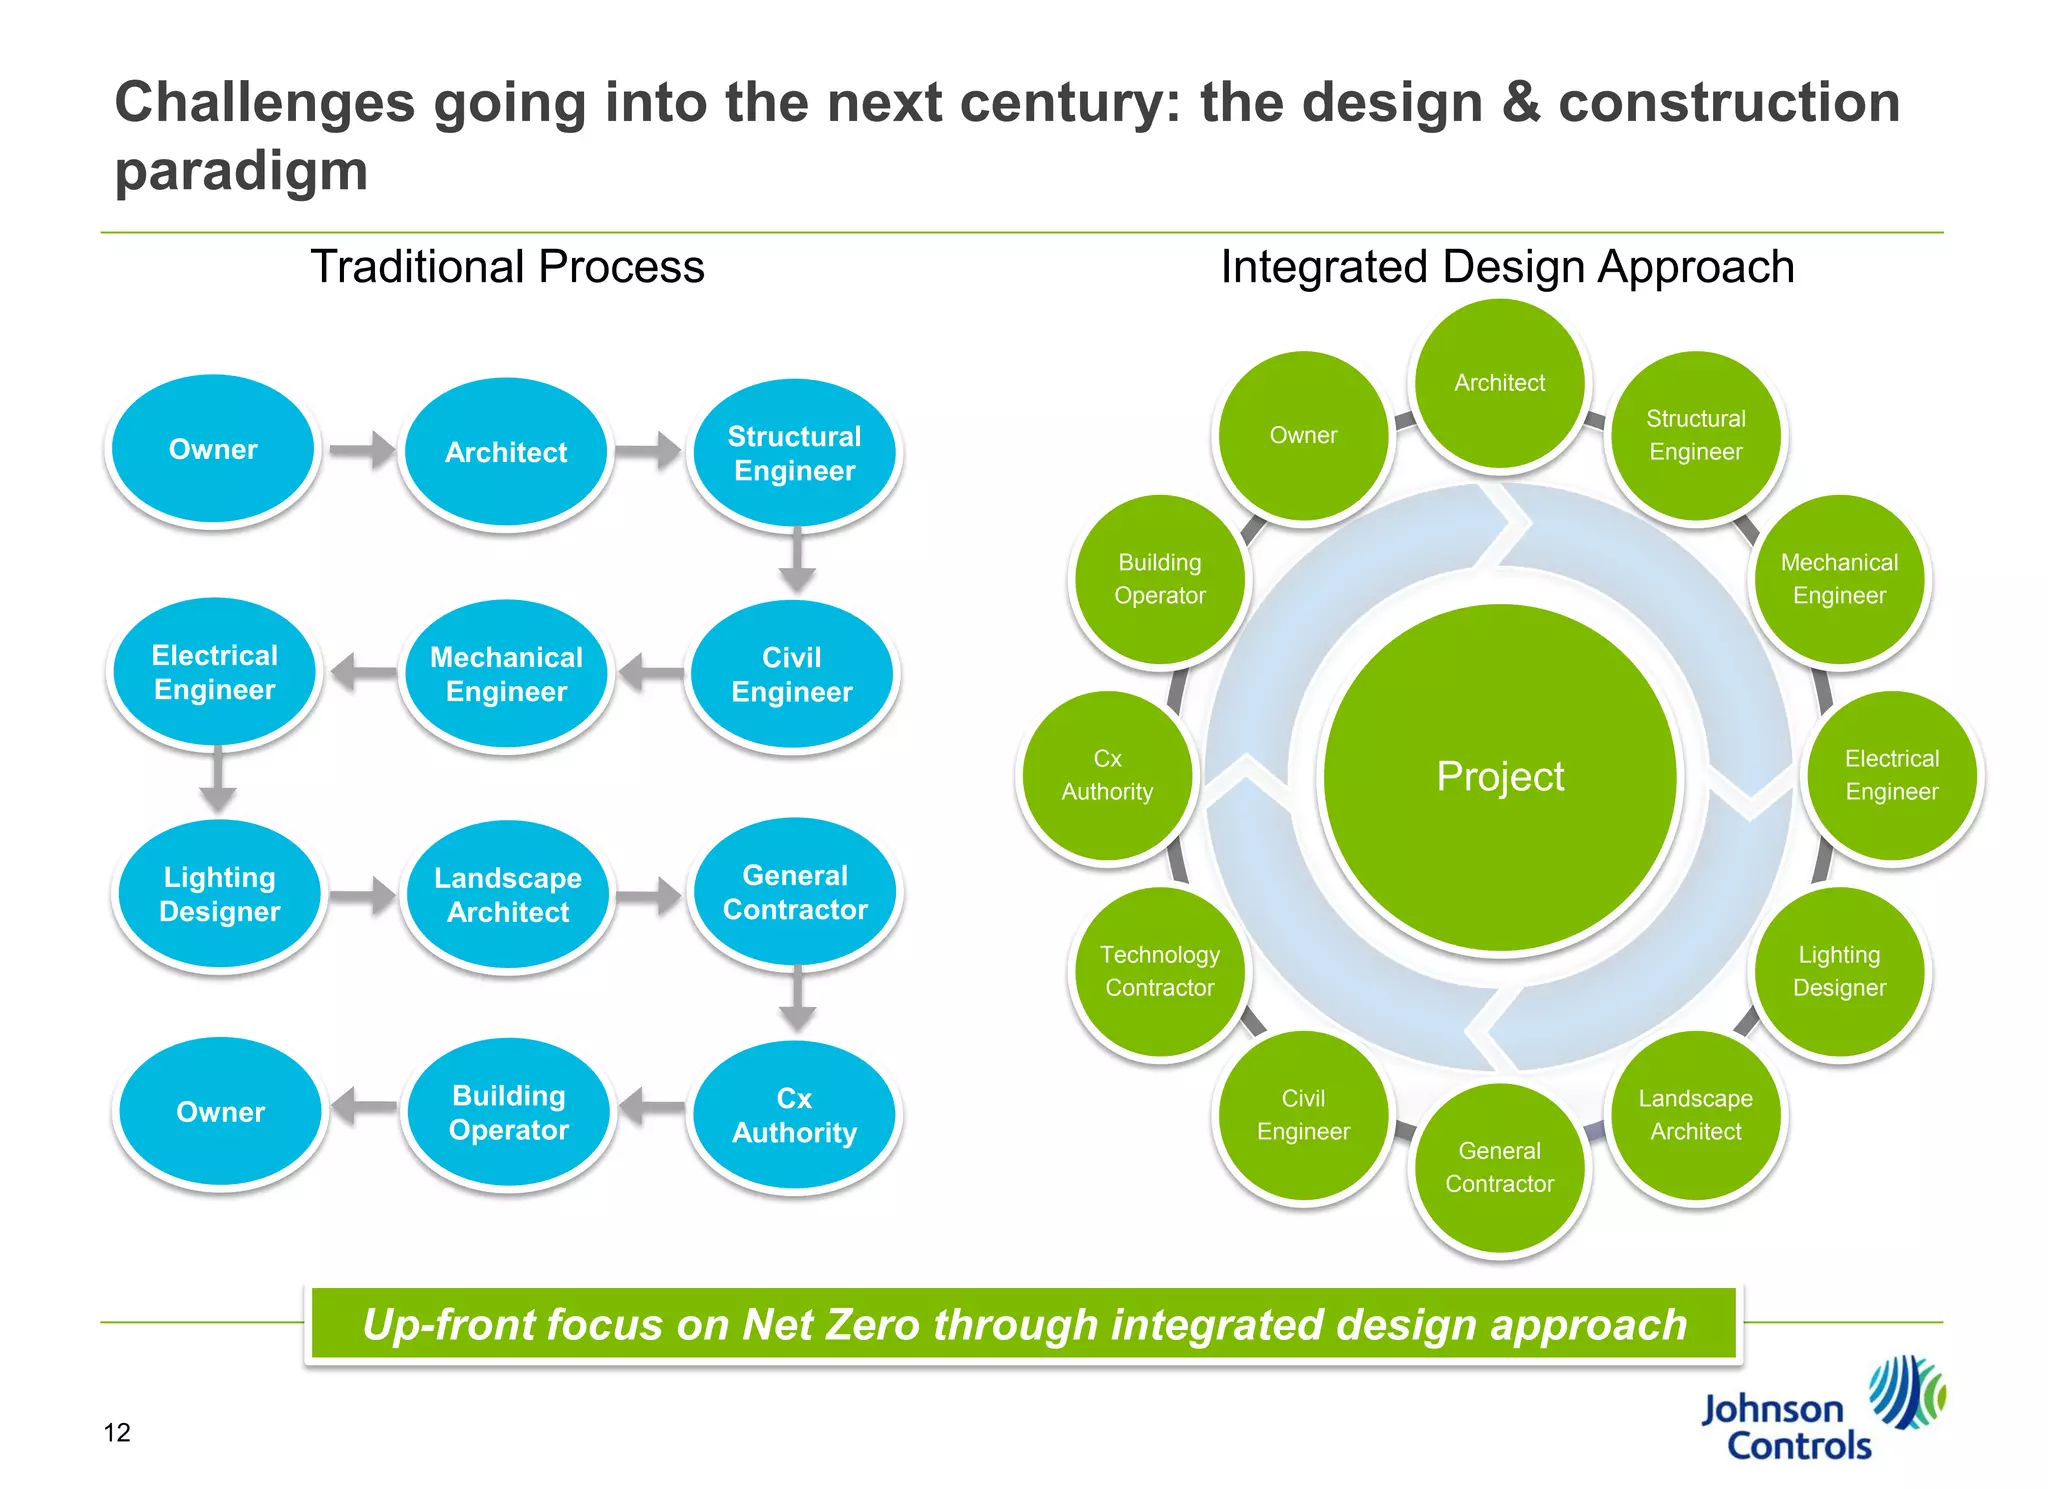
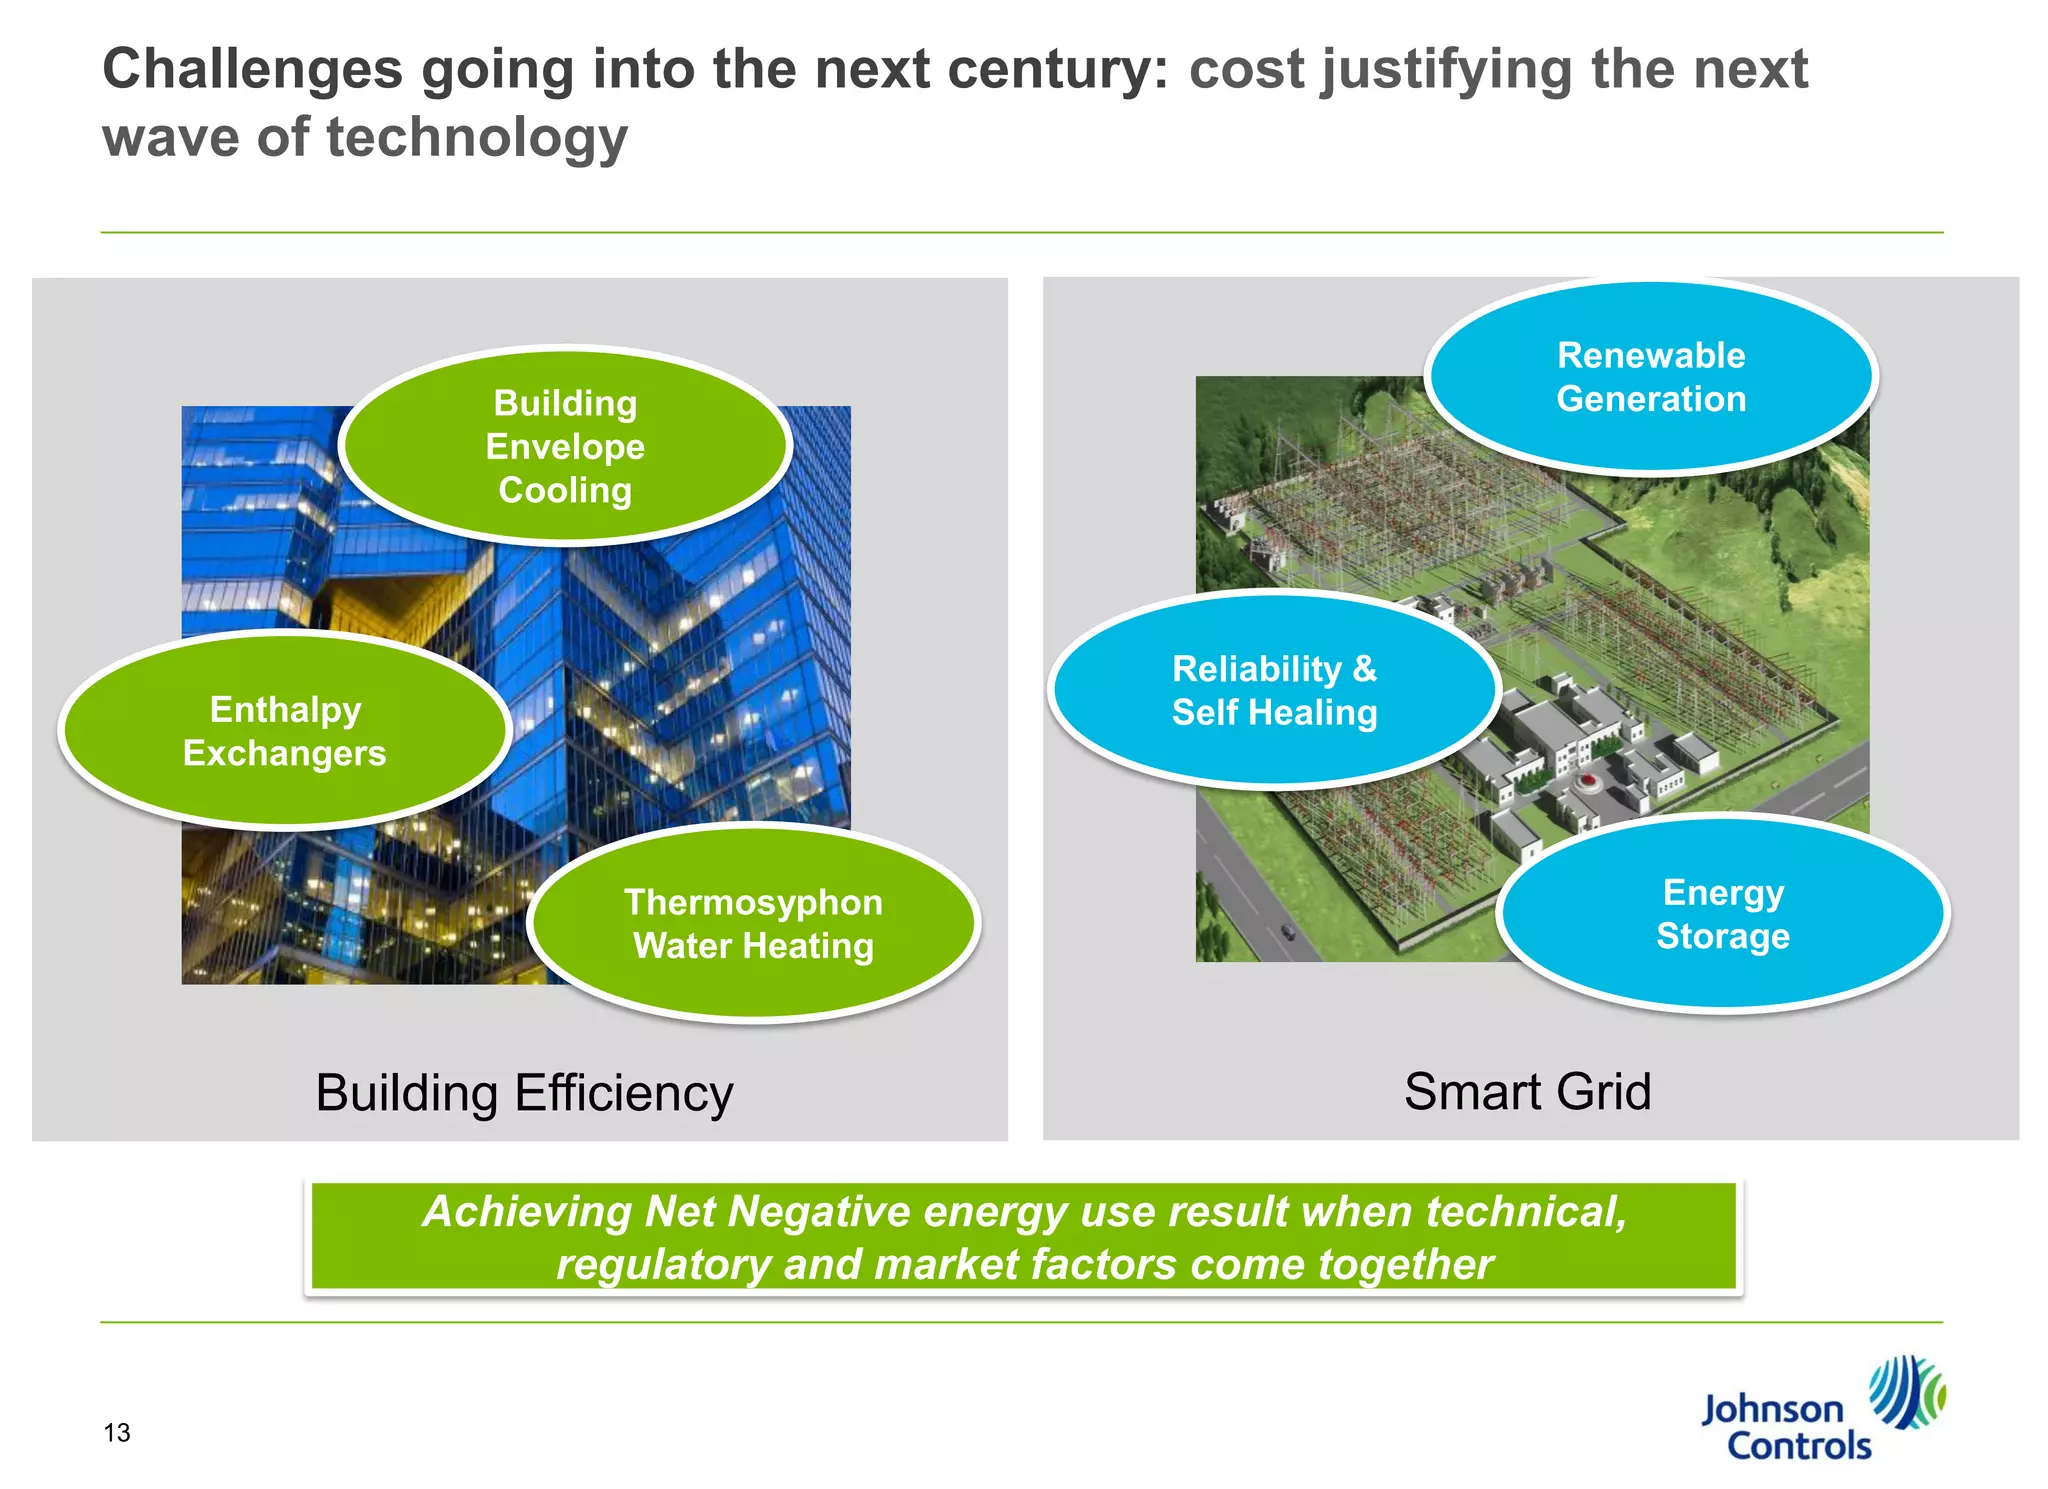

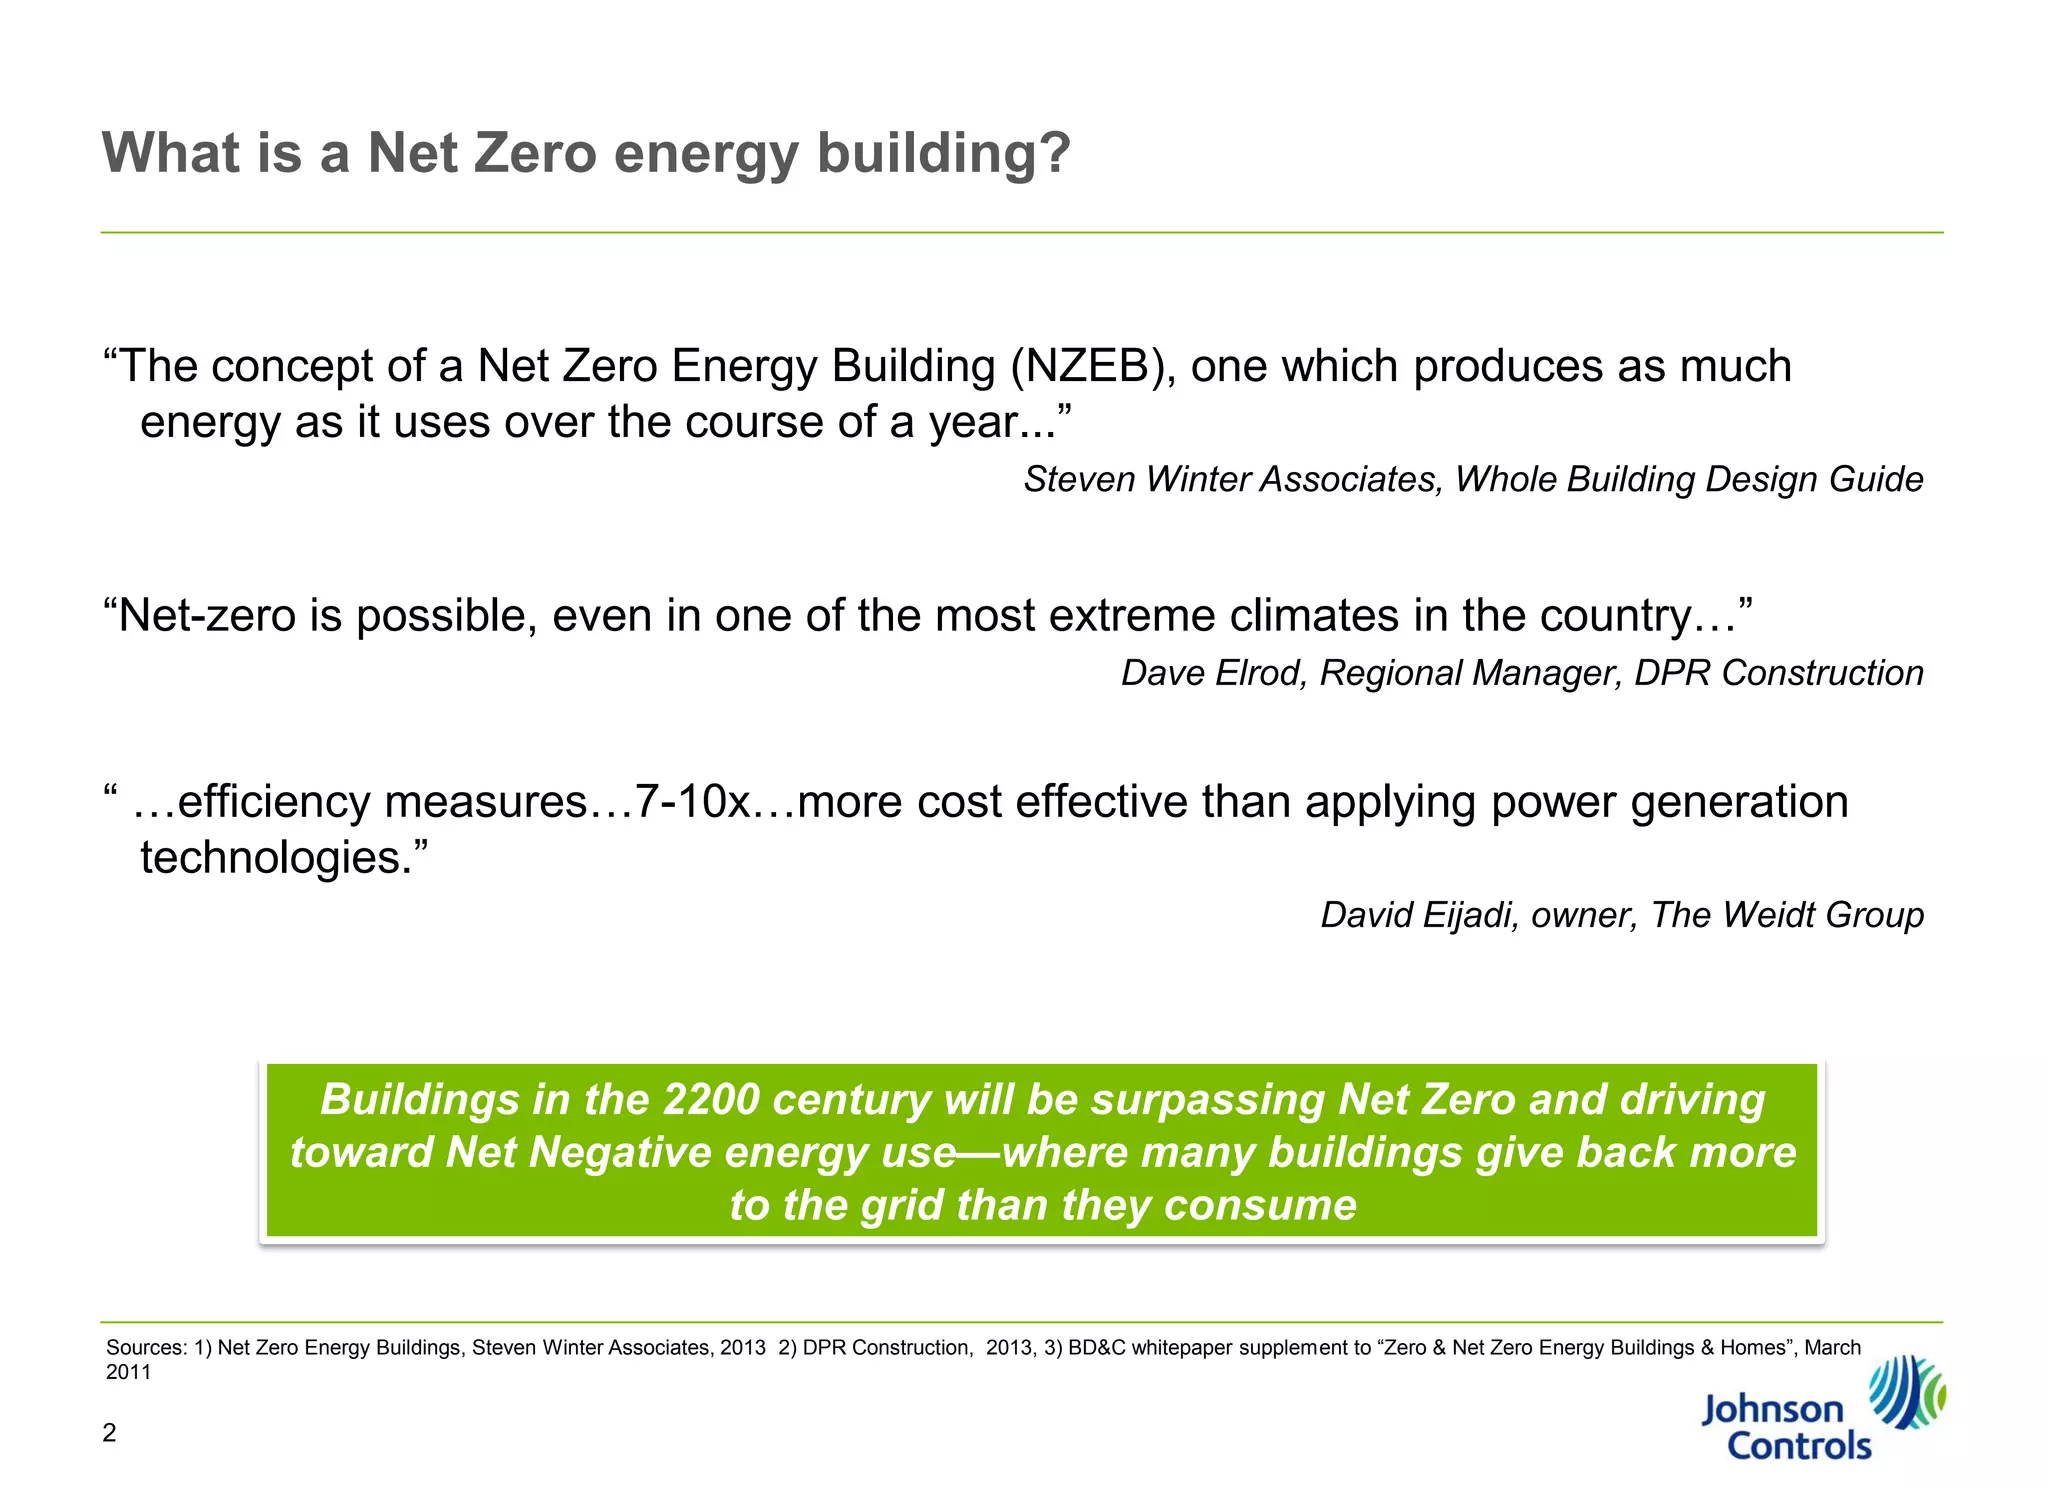
The document discusses the concept of net zero energy buildings (NZEB), highlighting the goal of these buildings to generate as much energy as they consume over a year. It outlines energy consumption patterns in commercial buildings, emphasizing the need for improved efficiency with reference to various initiatives and standards aimed at decreasing energy intensity by 2030. Key technologies and integrated design approaches are identified as crucial to achieving significant reductions in energy usage and transitioning towards net negative energy buildings.


![Vibe Coding vs. Spec-Driven Development [Free Meetup]](https://cdn.slidesharecdn.com/ss_thumbnails/vibecodingvsspecdrivendevelopment-251209105622-43f455e7-thumbnail.jpg?width=640&height=640&fit=bounds)


![Coded Agents – with UiPath SDK + LangGraph [Virtual Hands-on Workshop]](https://cdn.slidesharecdn.com/ss_thumbnails/codedagentsdeck-251215155422-5497c599-thumbnail.jpg?width=640&height=640&fit=bounds)


