Download as PDF, PPTX
![Videre Parare Est
The Engineering disciplines of Surveying and Mapping and the Sciences of Geodesy and Cartography are enduring
SSGT / LT R.J. Williams
LT Williams receiving award
BA Computing Studies
Canberra CAE, 1980
1977 - 1982
Reflections by Dr R.J. (Bob) Williams [Retired]
Cartographer - Topographic Surveyor - Geographer - Geospatial Scientist
Compiled 2014
The 1970s … …A Decade of Vision … … with Visionaries with Ideas … …
The 1980s … …A Decade of Innovation … … with Experience and Vision … …](https://image.slidesharecdn.com/94afa5c5-71c5-4467-b6e7-9ef8a99c8072-161118060500/85/Williams-1977-82-1-320.jpg)
![Videre Parare Est
The Engineering disciplines of Surveying and Mapping and the Sciences of Geodesy and Cartography are enduring
SSGT / LT R.J. Williams
LT Williams receiving award
BA Computing Studies
Canberra CAE, 1980
1977 - 1982
Reflections by Dr R.J. (Bob) Williams [Retired]
Cartographer - Topographic Surveyor - Geographer - Geospatial Scientist
Compiled 2014
The 1970s … …A Decade of Vision … … with Visionaries with Ideas … …
The 1980s … …A Decade of Innovation … … with Experience and Vision … …](https://image.slidesharecdn.com/94afa5c5-71c5-4467-b6e7-9ef8a99c8072-161118060500/75/Williams-1977-82-1-2048.jpg)
![A TIME OF EDUCATION, AND VISION
I, along with three other senior non-commissioned officers, was invited by Major John Cattell to a Christmas-eve 1976
barbeque. I was surprised by the invitation. During the evening I had a chat with my Corps Director Colonel Jim
Stedman. Colonel Stedman asked me if I would like to undertake Long Term Schooling. In addition to undertaking
three years of academic study, I was given a challenge of identifying future directions for digital mapping for the Royal
Australian Survey Corps and the Australian Army.
The following year I commenced the first of my tertiary studies at the (then) Canberra College of Advanced Education
(now the University of Canberra) towards the award of Bachelor of Arts in Computing Studies (Cartography major).
My principal lecturer was Waldo (Wally) Wassermann. Wally was a German mathematician and engineer who came to
Australia to work on the Snowy Mountain Scheme. Wally had some interesting beliefs. On my first meeting with Wally
he said that at the end of our courses “you will know of a whole lot of topics that you’ll know nothing about”. Wally
also said that they would not have constructed the Snowy Mountains Scheme if they had used the standard technology
and procedures of the day; in other words, he suggested that we “need to question and challenge current
procedures and not just rely on published text books”.
Because I, and three others, were ‘mature age’ students with surveying and mapping experience Wally awarded us
exemption from introductory surveying and cartography subjects. As such we were able to partake in a unique course
combining cartography and computer science. We did a unit in remote sensory mapping (now known as remote
sensing#), a unit in machine intelligence (now known as artificial intelligence), as well analytical cartography units having
advanced calculus and spherical trigonometry.
Those days were the most ‘enlightening days’ in my career. At that time I believed that we were about to embark on a
NEW AGE OF CARTOGRAPHY!
CCAE
# The term “remote sensing” was coined in the early 1960s by geographers in the [US] Office of Naval Research to apply to the information derived from
photographic and non-photographic instruments.
The American Society of Photogrammetry published the First Edition of the Manual of Remote Sensing in 1975.
Enlightening days!
Bio
2](https://image.slidesharecdn.com/94afa5c5-71c5-4467-b6e7-9ef8a99c8072-161118060500/85/Williams-1977-82-2-320.jpg)

![CCAE
Origins
Waldermar (Waldo or Wally) Wassermann was a German mathematician and geodetic surveyor.
Wally was a visionary! He had a mate in the timber industry who was interested in determining
the best route to drive his vehicles from the south coast to Canberra. He also had a mate (an
airline pilot) who saw the day when airlines would be flying shorter routes across Asia/Europe.
A Unique Course which featured interesting
[and non-conventional] assignments and projects
1977 – Cartography 2 - Map projections for Geodesists, Cartographers and Geographers
“The idea to write this introduction to map projections was born in 1969 in the Department of Geodetic
Science of the Ohio State University, Columbus Ohio, USA.
There existed agreement in the opinions of the authors that most most books on map projections are
either too simple of conception, or too involved, carrying the subject matter far beyond the knowledge
required of geodesists studying at a Master’s degree level.
This book is an intermediate. After a description of general features presupposing a knowledge of
elementary spherical trigonometry, it employs mathematics up to a level of ordinary and integral
calculus. It leads the way directly to the design of general computer programmes for the calculation
and/or plotting of geographic grids in the common projections of both terrestrial and lunar ellipsoids.
…
It is hoped that the combined experience of the authors in geodesy and cartography, in academic and
professional practice, has produced a text useful to students and colleagues”.
Text books included:
Richardus, Peter and Adler, Ron K. (1972). Map Projections for Geodesists, Cartographers and Geographers, North-Holland, Amsterdam
Digital terrain models and data banks. The direct and indirect measurements performed for the purpose of recording the
physical and artificial (man-made) features are processed in the form of a digital model. Each point measured is defined by its
three dimensional coordinates within a specific system, such as longitude, latitude and height above mean sea level.
One can imagine a data bank as a storage divided into surface compartments, the compartment boundaries corresponding to a
system of parametric lines created by the geographical or plane rectangular coordinate grid.
A text book with visionary concepts:
4](https://image.slidesharecdn.com/94afa5c5-71c5-4467-b6e7-9ef8a99c8072-161118060500/85/Williams-1977-82-4-320.jpg)
![CCAE
Origins
A Unique Course which featured interesting
[and non-conventional] assignments and projects
Text books included:
1978 – Remote Sensory Mapping - Digital Picture Processing
1979 – Machine Intelligence – The Thinking Computer: Mind Inside Matter
Rosenfeld, Azriel and Avenish C. Kak (1976). Digital Picture Processing, Academic Press, New York
Raphael, Bertram (1976). The Thinking Computer: Mind Inside Matter, W. H. Freeman, San Fransisco
“This book should be suitable for a one- or two- semester advanced undergraduate or graduate course
in picture processing.
Picture processing or image processing by computer encompasses a wide variety of techniques and
mathematical tools”.
Mathematical preliminaries Visual perception Digitization Compression
Enhancement Restoration Segmentation Geometry Description
“The computer is a tool whose continued improvement, and subsequent expanded application, can be
of immeasurable benefit to mankind. One might imagine many ways in which computers could be
improved. Computer scientists and engineers try to make their machines faster, cheaper, more reliable,
and easier to use. In addition, a few specialists in a growing field called ‘artificial intelligence’ are
devoting their professional careers to trying to make computers more intelligent”.
Bertram Raphael – Director of the Artificial Intelligence Center of the Stanford Research Institute, Menlo
Park, California
5](https://image.slidesharecdn.com/94afa5c5-71c5-4467-b6e7-9ef8a99c8072-161118060500/85/Williams-1977-82-5-320.jpg)
![CCAE
Origins
A Unique Course which featured interesting
[and non-conventional] assignments and projects
Yoeli
Analytical Hill-Shading
1965
Perspective view of Greater Vancouver
Program: SYMVU
Data: D.Mark
U British Columbia
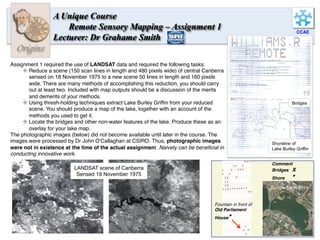
Assignment
Digital terrain modelling: A system of parametric lines
Wally had an idea! Let us model the surface of the Earth using a system of parametric lines.
He provided sets of elevations over the Canberra CAE area with the challenge of creating a
surface representation; or splitting the surface into a group of small surface elements.
We [course members] used a number of contemporary documents for research.
We were unsuccessful with this assignment but received passes because Wally valued the
learning experience above simple tests. This trait [from our observation] did not sit well with
other academics.
e.g. the sphere can
be paramatized as
6](https://image.slidesharecdn.com/94afa5c5-71c5-4467-b6e7-9ef8a99c8072-161118060500/85/Williams-1977-82-6-320.jpg)

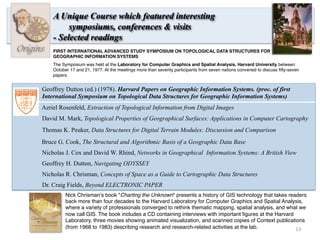
![Origins
A Unique Course which featured interesting
symposiums, conferences & visits
Attended Symposium: GIS Workshop
A workshop on geographical information systems was held at the Australian National University during 5-7 December
1979 under the joint sponsorship of Human Geography, ANU Research School of Pacific Studies and Applied Geography
at the Canberra College of Advanced Education. Dr Rhind, Reader in Geography, University of Durham, organized and
led the program as part of a four month visit to Canberra.
Academic seminars had previously been held in universities and at CSIRO but not openly publicized.
The response [to the workshop] was overwhelming and available space in the Coombs
Building was packed to capacity. Dr Rhind proved to be most versatile and resourceful with
an appropriate commentary on a wide range of topics such as the purposes of geographical
data handling; the encoding, validation and editing of data; recent international developments
of hardware and software; and a review of available packages of software. Various speakers
delivered papers on user needs, developments overseas, the Army AUTOMAP system, data
management for government, FASTRACK and RESPONSE II, SIDSIM software for
integrating spatial data by images, the applications of micro-computers, geographical aspects
of the 1981 Population Census and the CSIRO South Coast Land Use Project.
1979 was an amazing year because the first workshop, open to a general audience , on Geographical
Information Systems was held in Canberra.
Personal comment. During his time in Canberra I had several meetings with Dr Rhind and provided him with statistical data on the World Data Bank II
for his research.
Rhind went on to become CEO of UK Ordnance Survey and, later, Vice-Chancellor of City University London.
Cartography
(Journal of the Australian Institute of Cartographers)
Volume 11, No 3, March 1980
11](https://image.slidesharecdn.com/94afa5c5-71c5-4467-b6e7-9ef8a99c8072-161118060500/85/Williams-1977-82-11-320.jpg)
![14
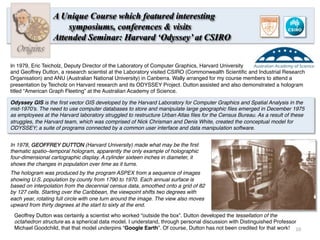
Bertram Raphael started at SRI (Stanford Research Institute)
International in 1964 as a consultant. After completing his PhD at MIT
(Massachusetts Institute of Technology), he was at the University of
California, Berkeley for an academic year, and subsequently joined SRI
full time in April 1965. He was a long-time member of SRI's Artificial
Intelligence Center, and was its director from 1970 to 1973. While at SRI,
he helped invent the A* search algorithm and develop Shakey the robot,
which was one of the first projects sponsored by DARPA ([US] Defense
Advanced Research Projects Agency). He also co-founded the Journal of
Artificial Intelligence.
Origins
A Unique Course which featured interesting
symposiums, conferences & visits
- Grahame Smith & Stanford!
“SRI bridges the critical gap between research universities or
national laboratories and industry. We move R&D from the
laboratory to the marketplace to create high value and real
innovation. And the platforms we build today are designed to
meet tomorrow’s needs”.
Lecturer:
Dr Grahame Smith
Textbook
AI Center
Perception Group
+ notes
and
articles
1980s
Australian Artificial
Intelligence Institute
Government funded research and development laboratory
[1988-1999] for investigating and commercializing Artificial
Intelligence, specially Intelligent Software Agents.
Grahame Smith left Australia to work at Stanford
Grahame Smith returned to Australia
to work at AAII](https://image.slidesharecdn.com/94afa5c5-71c5-4467-b6e7-9ef8a99c8072-161118060500/85/Williams-1977-82-14-320.jpg)
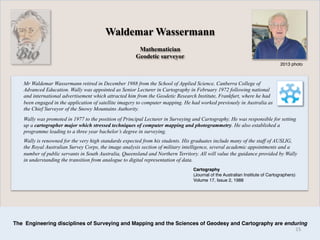
![18
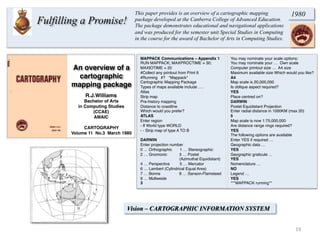
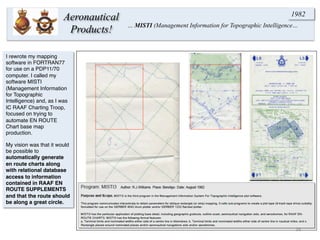
Fulfilling a Promise!
… a discussion paper on where I thought that the
Aeronautical Information products should be heading …
1980
Below are copies of extracts from original plots produced within
Special Studies in Computing [CCAE].
MAPPACK
An applications program
Demonstrating navigational aspects](https://image.slidesharecdn.com/94afa5c5-71c5-4467-b6e7-9ef8a99c8072-161118060500/85/Williams-1977-82-18-320.jpg)
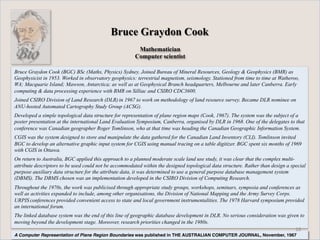
![20
In 1947 Colonel Lawrence FitzGerald attended two important conferences in London: the Commonwealth Survey Officers
Conference in August, and a Military Mapping and Aeronautical Charting Conference held immediately afterwards. It was probably
the military mapping conference in England that brought home to FitzGerald the extent to which Australia was being drawn into the
widening web of alliances and agreements that characterised the immediate post war period. At a previous Anglo-American conference
on military map and air chart policy, held in October 1946, these two powers agreed to each accept particular responsibility for map
production for half the world. Now Britain was asking its dominions to accept a further subdivision of its share. Australia was invited to
accept the Netherlands East Indies as an area of primary interest.
In 1941, Martin Hotine became Director of Military Survey [UK Ordnance Survey] with the rank of Brigadier, commanding
Geographical Section of the General Staff and responsible for the Army’s maps and the RAF’s aeronautical charts.
In 1946, no doubt aided by his overseas surveying experience, he became the founding Director of the Directorate of Colonial
(later Overseas) Surveys (DOS), a post he held until he retired 1963. During this time he had a profound influence on both
surveying and mapping within the Commonwealth.
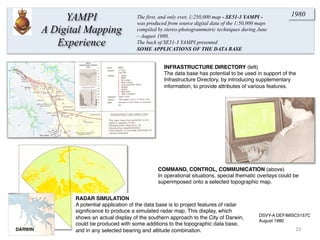
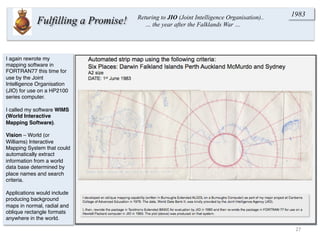
Aeronautical
Products!
… some historical information on Aeronautical charting
… a relationship that lasted half a century …
1980
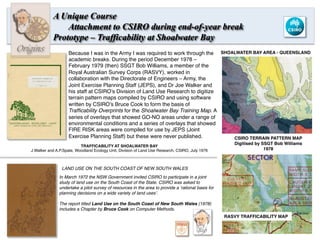
I was posted back to Army Survey Regiment, Bendigo in March 1980 and appointed IC RAAF
Charting Troop in Cartographic Squadron. My first trip was to RAAF Frognall (Melbourne) to visit AIS
(Aeronautical Information Service). My troop was manned by 22 Army Survey technicians and a
RAAF Liaison Officer; responsible for base maps of aeronautical charts.
Survey Regt, Fortuna Villa
RAAF Frognall
During discussions with Squadron Leader Mackenzie I showed him
my work (e.g. as on right) and we discussed the nature of future en
Route Charts and Flight Information Publications and that the
structure and the geometry lent itself to producing a ‘tailored’ product
for a flight plan and supplying the information in a database which
could be accessed when required.
Two factors prevented this innovation from happening:
1. The technology of-the-day was not advanced enough for this type of
application; and
2. The reluctance of people to accept a change from a traditional paper-
based view to intelligent computer solutions.
THIS IS THE
PROBLEM TODAY!](https://image.slidesharecdn.com/94afa5c5-71c5-4467-b6e7-9ef8a99c8072-161118060500/85/Williams-1977-82-20-320.jpg)
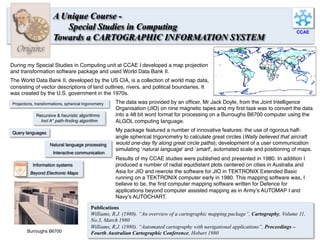
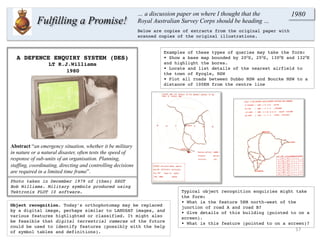
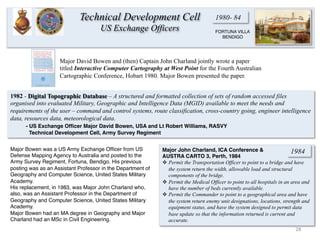
![3665-III STRICKLAND [1:50000] was the
first map published using the AUTOMAP I
system in 1978. Compilation was by digital
stereo-photogrammetric methods 1976.
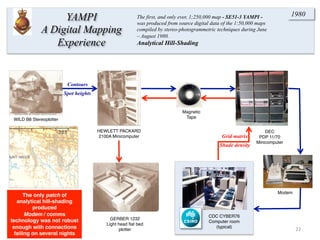
YAMPI
JOG
[1:250000]
MAP GENERATION
21
1980
YAMPI: A Digital Mapping Experience report,
described the area; discussed the map
production describing the available source data,
detailing production time limitations and method
of production; analyzed various aspects
observed during the production including the
integrity of the data bank, cost of data
manipulation processes, the effect of
management and operational procedures and
the quality of the graphic; and, finally examined
some future applications and recommendations.
YAMPI
A Digital Mapping
Experience
The first, and only ever, 1;250,000 map - SE51-3 YAMPI -
was produced from source digital data of the 1:50,000 maps
compiled by stereo-photogrammetric techniques during June
– August 1980.](https://image.slidesharecdn.com/94afa5c5-71c5-4467-b6e7-9ef8a99c8072-161118060500/85/Williams-1977-82-21-320.jpg)
![29
The 1980s … …A Decade of Innovation … … with Experience and Vision … …
Reflections on the period 1977-82 – An enlightening time!
The 1970s … …A Decade of Vision… … with Visionaries with Ideas … …
The Survey Corps had A LONG HISTORY OF INNOVATION – embracing emerging technologies and applying technologies to
new areas of application.
For example, in the mid-1960s a survey operation was underway, that of the Southwest Pacific Survey. The aim of that survey was to
establish the principal islands of the Southwest Pacific area on a common geodetic datum including connecting New Guinea and the
adjacent islands to the geodetic network on the mainland of Australia. The project being accomplished by aerial electronic survey,
specifically HIRAN, and ship to shore operations.
The measurement of very long lines, in the order of 750km, meeting surveying accuracies, came from the World War II uses of radar for
precision bombing and navigation. HIRAN was an electro-distance measuring system (HIgh frequency RAnging and Navigation).
So, challenging existing procedures and undertaking challenging tasks was the NORM for Army Survey.
As an aside, possibly as a result of radar initiatives [I do not have actual evidence],
there was a great spirit of co-operation between the RAAF School of Air Navigation (and Air Gunnery/
Radio Operaters) based at RAAF Ballarat during WWII and the Survey Regiment at Bendigo. There
was an annual sports day (Bone of Contention Day) held between the two Units continuing after the
RAAF unit relocated to Laverton (Radio School).
Second from right
THEN …
SSGT Bob Williams operating a GPS receiver – 1976
Drawn from a photo as part of a publicity brochure
This appears on the reverse of a number of back-up maps.](https://image.slidesharecdn.com/94afa5c5-71c5-4467-b6e7-9ef8a99c8072-161118060500/85/Williams-1977-82-29-320.jpg)

The document provides an overview of Bob Williams' educational journey in the 1970s pursuing a Bachelor of Arts in Computing Studies with a cartography major at the Canberra College of Advanced Education (now University of Canberra). It describes the unique and visionary course he took that combined cartography, computer science, remote sensing, and artificial intelligence. It highlights some of the interesting assignments and projects he worked on, including digital terrain modelling and trafficability mapping. It also discusses conferences, seminars, and workshops he attended that exposed him to cutting edge research and applications in fields like geospatial information systems and remote sensing. The document reflects on this time period as enlightening and setting the stage for a new age of cartography through innovative educational


![Future Defence Geospatial Environment Future [2000]](https://cdn.slidesharecdn.com/ss_thumbnails/futuregeoenv2000-210923064710-thumbnail.jpg?width=640&height=640&fit=bounds)


