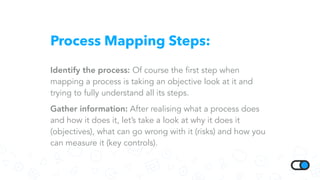
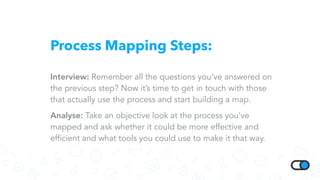
Learn what process mapping is and how it can help your company become more productive and efficient.
Find out how much the knowledge of your process' steps can influence your management!
This document provides guidance on process mapping for organizational modernization and improvement. It explains that process mapping allows organizations to systematically understand and improve their work processes by making them more efficient and customer-focused. The document outlines a 7-step approach to process mapping, which includes determining boundaries, listing steps, sequencing steps, using basic symbols, checking for completeness, and finalizing the map. Process mapping is presented as a key tool for analyzing current processes and designing improved future state processes.
This presentation gives simple but effective techniques for mapping a business process. Process Mapping is a strong initial step in continuous improvement of any business process.
Process mapping --- business process reengineeringRishabh Bansal
This document defines process mapping and describes its benefits. Process mapping involves creating diagrams that show the major processes of an organization, including the key activities, sequencing, inputs/outputs, and how work is actually done versus how it should be done. It helps ensure processes are properly understood and managed. The first structured process mapping method was introduced in 1921. Process maps typically include flowcharts and process definition charts. The major steps are process identification, information gathering, interviewing/mapping, and analysis. Benefits include improved understanding of roles, integration across departments, performance improvement, and encouraging questions about how and why processes are done.
Process mapping is a method to visually document and analyze processes by graphically depicting the steps. It involves identifying processes, gathering information through interviews, and generating maps. Process maps show trigger events, activities, decisions, and hand-offs. They are analyzed to eliminate waste and improve processes by focusing on customer needs. Potential pitfalls include mapping without a clear purpose or getting lost in details without finalizing maps.
A flowchart is an outline or schematic drawing of the process your team is trying to measure or improve. It can also be a picture of an ideal process that you would like to use.
I invite you to join as a member of the PEX Network Group http://tinyurl.com/3hwakem, you will have access to Key Leaders Globally, Events, Webinars, Presentations, Articles, Case Studies, Blog Discussions, White Papers, and Tools and Templates. To access this free content please take 2 minutes for a 1 time FREE registration at http://tiny.cc/tpkd0
Warm Regards,
Steven Bonacorsi, LSS MBB, President
International Standard for Lean Six Sigma
Cell: 603-401-7047
skype: sbonacorsi
E-mail: sbonacorsi@comcast.net
Twitter: http://twitter.com/Sbonacorsi (Follow Lean Six Sigma Content)
LinkedIn: http://www.linkedin.com/in/StevenBonacorsi
FREE Lean Six Sigma and BPM content - register at http://tiny.cc/tpkd0
PROCESS MAPPING AND PROCESS RECONSTRUCTIONS & DIAGRAMSHriday Bora
The document discusses process mapping and reconstruction for business process reengineering. It defines what a process is and explains why processes should be mapped. Process mapping involves visually representing the steps, inputs/outputs, and other elements of a process. The document describes different types of process maps - flow diagrams, deployment charts, and SIPOCs. It provides examples and outlines how to create each type of map. The goal of process mapping and reconstruction is to analyze existing processes, identify inefficiencies, and improve processes.
Process mapping is a method to graphically describe the steps that make up a process. It involves documenting, analyzing, controlling, improving, and redesigning processes. The major steps of process mapping are process identification, information gathering, interviewing, and map generation and analysis. Process mapping provides benefits like understanding processes visually, taking a holistic view, developing employee buy-in and pride, and creating customer-focused processes. Potential pitfalls include mapping without a clear purpose, getting lost in details, and not focusing on customers' needs.
1. The document discusses business process mapping, including defining what it is, the purpose of mapping processes, and the main steps involved which are process identification, information gathering, analysis, and implementation.
2. It explains the different types of process maps - current state, ideal state, and future state. The current state map shows the actual current process, the ideal state eliminates non-value adding steps, and the future state map incorporates improvements.
3. The main benefits of process mapping are improving efficiency, aligning processes with objectives, increasing responsiveness to changes, and gaining competitive advantages. The potential disadvantages include high costs, time wastes, and unclear focus.
This document provides an overview of process mapping tools including SIPOC (Supplier, Input, Process, Output, Customer) mapping and detailed process mapping. It defines the key elements of each tool, the objectives, benefits and steps to generate a map. Examples of a SIPOC map and a detailed process map for a catapult firing process are included to demonstrate how each tool can be applied. Additionally, the document introduces root cause analysis using a fishbone diagram and Failure Mode and Effects Analysis (FMEA). It defines the objectives of each tool, how to set them up, and includes an example FMEA analysis for potential failures in emergency response phone systems.
The document provides guidance on process mapping, which involves creating a visual representation of a process showing the sequence of tasks. The objectives are to map the current process, produce a working document, and recognize value in creation. Process mapping involves defining key elements like inputs, outputs, customers, and mapping at different levels of detail. The map should be flexible and represent alternative paths. Guidelines are provided for effective process mapping, including using specific symbols and analyzing the process to identify improvements.
This document discusses process mapping and the differences between process flow mapping and value stream mapping. It defines a process as a group of logically related activities and tasks that transform inputs into specified outputs. Process flow mapping visually depicts the steps in a process, how inputs become outputs, and links to other processes. Value stream mapping considers the whole value stream, identifies non-value added steps between processes, and enables long-term planning, while process flow mapping focuses on a single process, identifies non-value added within the process, and enables shorter-term tactical planning. An example of a process flow map for checking in a paper-based trailer is provided.
The document outlines the overall process flow mapping process which includes defining the scope, creating current and future state maps, and developing an implementation plan. It provides details on each step, including identifying the process and stakeholders, mapping the current "as is" process, analyzing for improvements, and mapping an ideal future "to-be" process. Standard symbols and templates are suggested to create clear and consistent process flow maps. Examples of process maps are also included.
The document discusses process mapping and how it can be used to analyze and improve processes within an organization. Process mapping involves visually displaying the steps in a process, including inputs, outputs, responsibilities and issues. This helps identify non-value added activities, bottlenecks and other problems. An effective process map requires identifying the scope, capturing details in sessions with stakeholders, and analyzing metrics to find areas for quick wins and process improvements.
A brief introduction of business process mapping. Containing definition, benefit, business process element, ARCI, source and step to do business process mapping.
What is Value Stream Mapping?
History:
What is Value?
What is a Value Stream?
Different things flow through the Stream:
Reason for Mapping & Analysis :
Objectives:
Team Members and Roles in VSM Study Project:
How to create a Value Stream Mapping?:
Value Stream Mapping Process with example
Step 1 - Gather Data and Information:
Step 2 - Create a Current State Map
VSM Study Symbols:
Collecting Data and Time Studies in VSM Study:
Examples of data required in this study:
Process Steps in VSM Study:
Analysis of the Current State Map:
Step 3 – Future State Map & Action Plans:
Creating an Ideal and Future State
Analysis of Future State Map:
Step 4 – Execute the Plan:
Step 5 – Align & Analysis of Current and Future State:
Keys Points for Successful VSM Study:
Mouhcine NAHAL
This document outlines a process framework for continuous business process improvement. It discusses identifying best practices, analyzing the current ("As Is") state and envisioning an improved ("To Be") state. Two approaches are business process improvement, which simplifies and optimizes existing processes, and business process reengineering, which radically redesigns processes from scratch. Principles for improvement include simplifying processes, using metrics to test changes, minimizing hand-offs, integrating tasks, leveraging IT, working backwards from outputs to inputs, establishing clear ownership, and viewing processes from the customer perspective. The document also lists information needed to map processes, such as responsibilities, key performance indicators, activities, inputs/outputs, suppliers, customers, and volumes.
Six Sigma is a statistical approach to process improvement that aims to reduce defects. It involves using tools like control charts, histograms, Pareto charts, cause-and-effect diagrams, and flow charts to identify and remove sources of errors and variation in manufacturing processes. The goal of Six Sigma is to achieve a defect rate of 3.4 defects per million opportunities. It has been widely adopted by companies to improve quality, lower costs, and increase customer satisfaction. Key aspects of Six Sigma implementation include defining processes, measuring key aspects, analyzing data, improving processes, and verifying results. Suppliers must also meet quality standards like ISO certification and maintain control over their own processes to fully support a Six Sigma approach.
Metrics-Based Process Mapping: Part 1 of 3TKMG, Inc.
Recorded webinar: http://slidesha.re/1eYtbZM
Part 2 - http://slidesha.re/17pgwcS
Part 3 - http://slidesha.re/139L8Sb (Excel tool product demo)
Subscribe: http://www.ksmartin.com/subscribe
To purchase the book: http://bit.ly/MBPMbk
Metrics-Based Process Mapping (MBPM) is a methodology that was developed to support the adoption of lean practices in office, service, and knowledge work environments.
Designed and developed by Karen Martin & Mike Osterling, this technique integrates the functional orientation of conventional swim-lane process maps with the time and quality metrics used in value stream mapping.
Learn how to create a metrics-based process map to identify and eliminate waste in an office/service process. Part 1 of 3.
The document discusses key concepts for achieving zero defect quality including process mapping, mistake proofing (Poka-Yoke), and the four elements of a Zero Defect Quality system (ZDQ): point of origin inspection, 100% audit checks, immediate feedback, and Poka-Yoke. It emphasizes preventing defects at their source by designing quality processes and eliminating errors and their root causes through a team approach and continual improvement.
This document provides an overview of a workshop on mapping the sales tax process using SIPOC (Suppliers, Inputs, Processes, Outputs, Customers). The workshop objectives are to explain Lean Six Sigma concepts, teach how to build a SIPOC diagram and process maps, and apply these tools to map the sales tax process. Attendees will learn the purpose and benefits of process mapping, and how to identify improvement opportunities by mapping processes.
The document discusses various quality management tools including the Ishikawa diagram, CTQ tree, and Kaizen principle. The Ishikawa diagram is used to identify and graphically display the root causes of problems. The CTQ tree breaks down customer requirements into measurable elements. The Kaizen principle focuses on continuous incremental improvements through collaboration and identifying the root cause of errors. Examples are provided for each tool to illustrate how they can be implemented.
The document provides an overview of Lean Six Sigma. It discusses the key principles and methodologies of Lean Six Sigma including DMAIC, DMADV, defining value streams, eliminating waste, and using data-driven problem solving. The goals of Lean Six Sigma are to improve processes by reducing variation and defects to lower costs, improve quality, and better satisfy customers.
Five Steps For Continuous Improvement of a South Carolina Business ProcessStephen Deas
Find links and research for continuous improvement of a South Carolina business process: Charleston, Florence , Greenville, Columbia, the Lowcountry, the Midlands, and the Upstate. Stephen Deas gives five steps for continuous improvement of a wide range of South Carolina processes: manufacturing, hospitality, healthcare, education, and municipal government. Stephen Deas is the President of Quality Minds Inc based out of Charleston, SC He is a Certified Six Sigma Black Belt with twenty plus years experience in production, engineering, purchasing, and quality. Stephen Deas was certified as a Quality Engineer in 1991 and has a Bachelors of Industrial Engineering (Georgia Tech) and a Masters of Industrial Statistics (University of South Carolina)
This document provides guidance on process improvement through a 14-step model. It begins with selecting a process and establishing an objective. Then a team is organized to flowchart the current process, simplify it, collect baseline data, and assess if the process is stable and capable of meeting the objective. If not, the team identifies root causes and plans a change. The change is tested and data collected to determine if the process improved. Finally, the team decides if further improvement is feasible.
The document provides an overview of the 4 steps to perform business process mapping (BPM): 1) Process Identification, 2) Information Gathering, 3) Interviewing and Mapping, and 4) Analysis. It describes each step in detail, explaining how to identify processes, gather relevant information through interviews and documentation, map the detailed process steps, and analyze the processes for improvements using techniques like the 7Rs framework. The goal of BPM is to improve organizational efficiency, effectiveness, and customer satisfaction by analyzing existing processes.
This document provides an overview of the FOCUS-PDCA continuous improvement strategy. It describes each step in the process: Find a Process to Improve, Organize a Team, Clarify the Current Process, Understand Variation, Select an Improvement Strategy, Plan the Improvement, Do the Plan, Check the Results, and Act to Hold the Gains. For each step, it explains the objectives and provides examples of tools that can be used, such as flowcharts, check sheets, control charts, and surveys. The overall purpose of FOCUS-PDCA is to establish a structured process for problem solving and continuously improving processes.
We all understand why improvement and a focus on excellence are important, so what we need is a method to use to help with our improvement efforts.FOCUS-PDCA is an improvement methodology that many organizations use to guide their improvement efforts. It’s simply a formalized process for improvement.
Think You Don't Need to Diagram Your Business Processes? Think Again.Everteam
It’s not a simple task to diagram a business process, but the benefits far outweigh the potential challenges involved. The key is to put together the right group of people who understand the process best and can explain it clearly. When documenting a business process, don’t have it led by a technical analyst. You don’t want to design your processes around technology; you want the technology to work with your process.
Project managers, in just about any industry, are faced with the challenge of improving the efficiency and productivity of their businesses. To do this, they need to understand the best methodology and tools to study and analyze processes correctly. After all, to improve results, the best approach is to improve the process that gives you those results.
How Process Mapping Can Streamline Your Business Tips and Best PracticesKashish Trivedi
Process mapping involves visually mapping out all the steps in a business process to identify inefficiencies, improve communication, and simplify processes. It can be done with pen and paper or digital tools. The document discusses the benefits of process mapping, different types of maps, best practices for creating maps, and concludes by encouraging the reader to start mapping their own processes.
Managing Screen Printers, Part 2: Standard ProceduresPrintavo
In Part 1 of Managing Screen Printers, we discussed why a culture of accountability is so important for your screen printing shop. Now that you understand the basics of a culture of accountability, it's time to create standardized procedures as the backbone of your shop's processes.
This is where the rubber meets the road: you are actually building systems for accountability and creating replicable steps for your screen printers to follow.
Try Printavo for free: https://www.printavo.com
Maintaining operational efficiency in an expanding business is a challenge for many companies today. It is not immediately obvious that the inefficiencies are hurting the business. However, small mistakes that lead to time and money lost become more frequent as the business hires more employees and takes on more work. Use this methodology to work through those sticking points that are holding your operations back.
Continual Improvement Process is required to adopt by almost every organization to compete in the market. This slide presentation will give you a brief overlook what it is? without going into details.
This document discusses quality improvement through process mapping and analysis. It explains that quality is judged based on process output, not individual worker performance. To improve quality, the process itself must be improved. Simply defining a process is not enough - management must make changes and use data to demonstrate improvements. The document then describes process mapping techniques like SIPOC, flowcharts, identifying value-added vs. non-value added steps, measuring cycle time, and bottlenecks.
This document outlines 5 key steps to establishing a smooth workflow using an agile approach: 1) Establish the workflow by mapping out major processes and stages, 2) Define policies for each stage, 3) Visualize work by adding cards for features and tasks, 4) Define work-in-progress limits for stages, and 5) Continuously improve by reviewing metrics and looking for areas of improvement. Following these steps helps minimize bottlenecks, focus work, and continuously refine the workflow.
The document discusses the importance of process documentation for businesses. It defines process documentation as step-by-step descriptions of how processes are executed from start to finish. Process documentation helps businesses avoid chaos as they grow by maintaining efficient and consistent procedures. It benefits businesses by optimizing processes, enabling automation, training new employees, sharing knowledge, and ensuring operational consistency. The document provides tips for creating process documentation, such as defining the process scope, organizing steps, identifying roles, noting exceptions, adding control points, and testing the documented process.
The document discusses using the DMAIC process for SEO projects. DMAIC is a structured problem-solving methodology originally developed by Motorola for process improvement. It stands for Define, Measure, Analyze, Improve, and Control. While originally used for manufacturing, DMAIC can also be applied to digital marketing projects by defining problems, measuring key metrics, analyzing data to determine root causes, improving processes, and controlling changes. The document provides details on carrying out each step of the DMAIC process for SEO projects.
Bringing the root cause analysis into the shop floorMatteo Bologna
Bringing root cause analysis onto the shop floor can provide several advantages:
1) It allows workers' expertise to be used to conduct analysis and define corrective actions for problems, leading to faster solutions and more effective actions.
2) Having all relevant parties involved from the start allows problems to be addressed directly where corrective actions will be implemented.
3) It increases engagement from workers by making them active participants in quality improvement.
Problem Solving Tools and Techniques by TQMIAndrew Leong
This handy guide is for anyone involved in problem solving and improvement activities. It contains guidelines on the use of many of the tools and techniques which can be used as part of a Continuous Improvement process.
This document provides a checklist for managing an auto-enrollment pension project. It outlines 7 key sections to consider: 1) Setting up the project, 2) Reviewing current schemes and processes, 3) Setting up the new pension scheme, 4) Establishing processes to manage auto-enrollment, 5) Managing people involved in the project, 6) Reporting on progress, and 7) Guidance on individual tasks. The checklist provides advice on tasks such as appointing a project team, assessing risks, creating a project plan, reviewing current schemes and reporting, selecting a pension provider and scheme design, documenting processes, and testing systems and processes.
Pipefy Process Platform empowers managers and process owners to design, run and automate end-to-end business processes with speed and agility without the need from IT or technical resources.
www.pipefy.com
Do you know what BPO (business process outsourcing) is and how your company can benefit from it?
It’s ok if you don’t. Many people are unaware of the benefits even the smallest of companies can get from outsourcing processes/activities and focusing internal efforts on what really matters: your product/service!
www.pipefy.com
You will learn:
✓ What is customer service?
✓ What’s the secret for providing excellent customer service?
✓ What makes a customer representative great?
✓ The 5 most common customer service mistakes (and how to avoid making them)
www.pipefy.com
What are the secrets behind worldwide known, successful companies such as Budweiser, Heinz, Burger King?
These and many other companies have strong philosophies and management methods focused on high efficiency and their secret is simple: Strong businesses have strong processes.
www.pipefy.com
Design thinking is a customer centric methodology to solve problems and innovate. Learn how this repeatable process can help you think outside the box.
Learn more about what bug tracking is and how this essential tool can help your software and app development. Find and track bugs early on to be more effective.
Find out how Feeld – the dating app for open minded singles and couples, formerly known as 3nder – improved their efficiency using Pipefy to create and manage consistent processes.
Colby Hobson: Residential Construction Leader Building a Solid Reputation Thr...dsnow9802
Colby Hobson stands out as a dynamic leader in the residential construction industry. With a solid reputation built on his exceptional communication and presentation skills, Colby has proven himself to be an excellent team player, fostering a collaborative and efficient work environment.
Project Management Infographics . Power point projetSAMIBENREJEB1
Project Management Infographics ces modèle power Point peut vous aider a traiter votre projet initiative pour le gestion de projet. Essayer dès maintenant savoir plus c'est quoi le diagramme gant et perte, la durée de vie d'un projet , ainsi que les intervenants d'un projet et le cycle de projet . Alors la question c'est comment gérer son projet efficacement ? Le meilleur planning et l'intelligence sont les fondamentaux de projet
A comprehensive-study-of-biparjoy-cyclone-disaster-management-in-gujarat-a-ca...Samirsinh Parmar
Disaster management;
Cyclone Disaster Management;;
Biparjoy Cyclone Case Study;
Meteorological Observations;
Best practices in Disaster Management;
Synchronization of Agencies;
GSDMA in Cyclone disaster Management;
History of Cyclone in Arabian ocean;
Intensity of Cyclone in Gujarat;
Cyclone preparedness;
Miscellaneous observations - Biparjoy cyclone;
Role of social Media in Disaster Management;
Unique features of Biparjoy cyclone;
Role of IMD in Biparjoy Prediction;
Lessons Learned; Disaster Preparedness; published paper;
Case study; for disaster management agencies; for guideline to manage cyclone disaster; cyclone management; cyclone risks; rescue and rehabilitation for cyclone; timely evacuation during cyclone; port closure; tourism closure etc.
From Concept to reality : Implementing Lean Managements DMAIC Methodology for...Rokibul Hasan
The Ready-Made Garments (RMG) industry in Bangladesh is a cornerstone of the economy, but increasing costs and stagnant productivity pose significant challenges to profitability. This study explores the implementation of Lean Management in the Sampling Section of RMG factories to enhance productivity. Drawing from a comprehensive literature review, theoretical framework, and action research methodology, the study identifies key areas for improvement and proposes solutions.
Through the DMAIC approach (Define, Measure, Analyze, Improve, Control), the research identifies low productivity as the primary problem in the Sampling Section, with a PPH (Productivity per head) of only 4.0. Using Lean Management techniques such as 5S, Standardized work, PDCA/Kaizen, KANBAN, and Quick Changeover, the study addresses issues such as pre and post Quick Changeover (QCO) time, improper line balancing, and sudden plan changes.
The research employs regression analysis to test hypotheses, revealing a significant correlation between reducing QCO time and increasing productivity. With a regression equation of Y = -0.000501X + 6.72 and an R-squared value of 0.98, the study demonstrates a strong relationship between the independent variables (QCO downtime and improper line balancing downtime) and the dependent variable (productivity per head).
The findings suggest that by implementing Lean Management practices and addressing key productivity inhibitors, RMG factories can achieve substantial improvements in efficiency and profitability. The study provides valuable insights for practitioners, policymakers, and researchers seeking to enhance productivity in the RMG industry and similar manufacturing sectors.
Originally presented at XP2024 Bolzano
While agile has entered the post-mainstream age, possibly losing its mojo along the way, the rise of remote working is dealing a more severe blow than its industrialization.
In this talk we'll have a look to the cumulative effect of the constraints of a remote working environment and of the common countermeasures.
Impact of Effective Performance Appraisal Systems on Employee Motivation and ...Dr. Nazrul Islam
Healthy economic development requires properly managing the banking industry of any
country. Along with state-owned banks, private banks play a critical role in the country's economy.
Managers in all types of banks now confront the same challenge: how to get the utmost output from
their employees. Therefore, Performance appraisal appears to be inevitable since it set the
standard for comparing actual performance to established objectives and recommending practical
solutions that help the organization achieve sustainable growth. Therefore, the purpose of this
research is to determine the effect of performance appraisal on employee motivation and retention.
Small Business Management An Entrepreneur’s Guidebook 8th edition by Byrd tes...ssuserf63bd7
Small Business Management An Entrepreneur’s Guidebook 8th edition by Byrd test bank.docx
https://qidiantiku.com/test-bank-for-small-business-management-an-entrepreneurs-guidebook-8th-edition-by-mary-jane-byrd.shtml
Designing and Sustaining Large-Scale Value-Centered Agile Ecosystems (powered...Alexey Krivitsky
Is Agile dead? It depends on what you mean by 'Agile'. If you mean that the organizations are not getting the promised benefits because they were focusing too much on the team-level agile "ways of working" instead of systemic global improvements -- then we are in agreement. It is a misunderstanding of Agility that led us down a dead-end. At Org Topologies, we see bright sparks -- the signs of the 'second wave of Agile' as we call it. The emphasis is shifting towards both in-team and inter-team collaboration. Away from false dichotomies. Both: team autonomy and shared broad product ownership are required to sustain true result-oriented organizational agility. Org Topologies is a package offering a visual language plus thinking tools required to communicate org development direction and can be used to help design and then sustain org change aiming at higher organizational archetypes.
3. Table of Contents:
1. Process Mapping
2. What is Process Mapping?
3. How to start mapping processes?
4. Process Mapping Steps
5. Manage your processes with Pipefy
4. Process Mapping:
If you’ve ever planned ahead on your activities by clearly
stating the steps and actions you had to take - not
necessarily on a flowchart - congratulations! You’ve
mapped a process (even if you didn’t realise it at the time).
To better understand why you should map your processes -
and how you can do it - let’s first define process mapping.
5. What is Process Mapping?
Process mapping is focused on understanding how a
process actually works.
It can be defined as the series of activities necessary to:
• Define what a company/business does
• Who is responsible for what in the processes
• What determines the completion of a process
• What determines the success of a process
6. What is Process Mapping?
What you get from mapping your processes? Well, most
businesses decide to go for process mapping because it’s
an important tool to improve efficiency.
Having a clear and defined process allows you to look at
your processes “from the outside”.
It also helps whenever you hire consultants to evaluate your
processes and help you decide on making improvements
on what you currently have.
7. What is Process Mapping?
Business process mapping also allows you to pick a specific
objective and measure, track and compare this specific
point alongside your business’ overall objective.
By doing so, you’re able to determine whether a specific
process is aligned with the company’s general goals and
capabilities.
8. How to start mapping processes?
There are four important steps when mapping a process:
• Identify the process
• Gather information
• Interview
• Analyse
9. Process Mapping Steps:
Identify the process: Of course the first step when
mapping a process is taking an objective look at it and
trying to fully understand all its steps.
Gather information: After realising what a process does
and how it does it, let’s take a look at why it does it
(objectives), what can go wrong with it (risks) and how you
can measure it (key controls).
10. Process Mapping Steps:
Interview: Remember all the questions you’ve answered on
the previous step? Now it’s time to get in touch with those
that actually use the process and start building a map.
Analyse: Take an objective look at the process you’ve
mapped and ask whether it could be more effective and
efficient and what tools you could use to make it that way.
11. Manage your Processes with Pipefy!
Looking for a tool help manage your processes? Try
Pipefy!
Pipefy helps companies keep organised and more
productive by running their processes and day-by-day
routines on an easy and intuitive tool.
12. Start managing your processes on Pipefy!
Enjoy the 30-day free trial and leave mistakes in the past.
get started for free