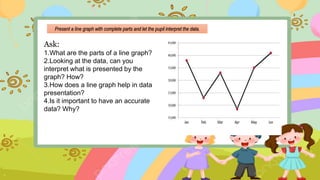
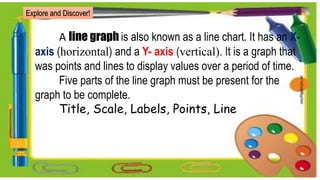
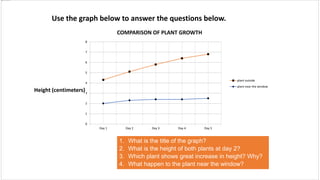
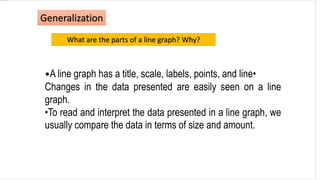
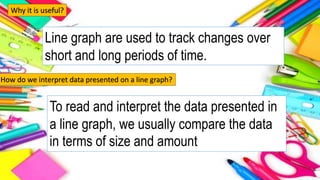
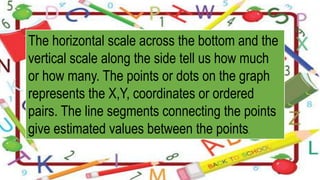
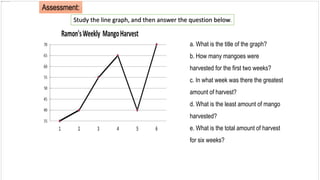
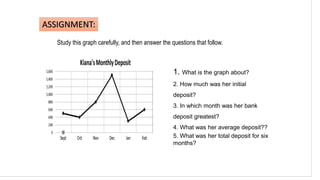
This document provides guidance on interpreting line graphs. It begins with an overview of line graphs, noting they have a title, scale, labels, points, and line. It then discusses how to interpret data presented in line graphs by comparing the data in terms of size and amount. Several examples of line graphs are presented along with questions to help students practice interpreting the data shown. The document emphasizes that line graphs are useful for tracking changes over time.