This document contains information about line graphs, including:
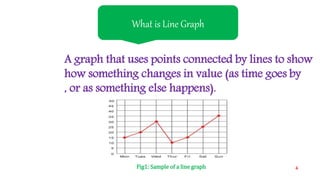
1) A line graph uses points connected by lines to show how something changes over time or as another variable changes.
2) Line graphs are used for qualitative data to track changes over short or long periods of time or to compare changes for multiple groups.
3) Examples of qualitative data include hair color, softness of skin, and gender, which can't be directly measured.