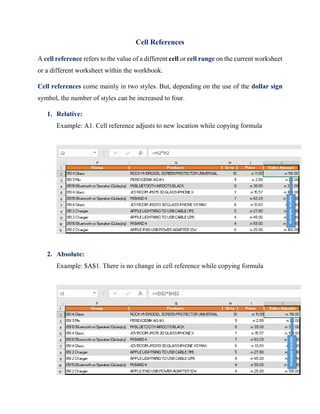
Microsoft Excel is the world's most widely used spreadsheet program and part of the Microsoft Office suite. Excel excels at creating charts, solving numerical problems, and handling non-numerical problems. Formulas in Excel use mathematical instructions and references to cells or ranges to perform calculations using operators, constants, and functions. Scenarios in Excel allow users to model different outcomes by changing inputs and seeing updated results.
Excel is a spreadsheet program that stores values, text, dates, and numbers in individual cells arranged in rows and columns within a worksheet. It allows users to enter formulas to perform calculations on the data. Formulas in Excel begin with an equal sign and can include functions like SUM, DATE, and MAX. Charts can be inserted to visually represent data by selecting the data range and choosing a chart type from the insert menu.
Just some excel courses. Have fun and learn from basic to advance, to develope strong skills in operating Excel.
Microsoft Office Excel was never so easy to understand like now!
This document provides an introduction to creating and using Excel PivotTables. It discusses appropriate source data types, how to create a basic PivotTable using the wizard or drag-and-drop method, formatting and updating PivotTables, and some advanced techniques. The presentation aims to help users understand how to use PivotTables for interactive data exploration and custom reporting using Excel's powerful summarization features.
The document is a tutorial for using Microsoft Excel. It provides step-by-step instructions on how to navigate the Excel interface and use basic functions. The tutorial covers topics such as navigating the Excel screen, entering formulas and data, formatting worksheets, creating charts, and using keyboard shortcuts. It also includes explanations and instructions for common Excel tasks like opening and saving files, editing data, printing worksheets, and more.
This document provides an introduction to Microsoft Excel. It begins with opening Excel and navigating within workbooks and worksheets. It describes entering different types of data like numbers, text, formulas. It discusses selecting cells, entering and editing data, copying and moving data using fill handle. It also covers saving workbooks in compatibility mode to allow opening in older Excel versions. The document is presented by Abdulbasit H. Mhdi and contains guidance, instructions and screenshots to explain key Excel concepts.
This document lists keyboard shortcuts and formulas commonly used in Microsoft Excel. It provides the key combination, description, and outcome of each shortcut and formula. Some shortcuts switch between worksheet tabs, insert or remove cell borders, or change a cell's formatting. Common formulas calculate dates and times from serial numbers, extract parts of dates, or return cell formatting properties. Functions like IF, AND, and IFERROR perform logical tests and return specified values depending on the test results.
This document provides an overview of key aspects of Microsoft Excel including its features, file formats, navigation keys, worksheets, formatting, cells and ranges, formulas, functions, and error values. It describes Excel's abilities for number crunching, creating charts and graphs, organizing lists, and accessing other data. It also outlines the basic components of formulas in Excel including operators, cell references, values/text, and functions. Finally, it provides examples of commonly used functions like SUM, AVERAGE, VLOOKUP, and COUNTIF.
The Excel TEXT function converts numeric values to text strings in a specified format. It has two required arguments: the value to convert and the format text. The format text uses code like "0" or "dd-mm-yyyy" to determine how numbers or dates should be displayed as text. Some examples show using TEXT to format numbers with commas and currency symbols, concatenate text with formatted dates, and conditionally format values based on location. The TEXT function allows numbers to be displayed in readable formats and combined with text for reports.
This lesson aims to know more about Microsoft excel like its definition, basic skills, excel formulas and function, and also tips on how to improve Microsoft excel skills.
Excel is an electronic spreadsheet program that allows users to store, organize, and manipulate data in a grid of rows and columns called a worksheet. Worksheets contain cells that can hold text, numbers, or formulas. Excel provides tools like functions, charts, and data analysis features to help work with large amounts of data. Users can enter values, edit data, search, zoom, and print worksheets.
Ms excel basic about Data, graph and pivot table Alomgir Hossain
Microsoft Excel can be used to store, organize, and manipulate data. It allows data to be organized in workbooks containing worksheets with rows and columns made up of cells. Excel contains various built-in functions, formulas, charts, and data analysis tools. This document provides an overview of Excel's basic features and functions, how to enter and format data, use formulas and functions, sort and filter data, insert and delete rows/columns, and create basic charts and graphs. It demonstrates the core capabilities of Excel for organizing and analyzing data.
Sorting arranges records in a specific sequence such as ascending or descending order. Filtering compares records against criteria and hides non-matching records, allowing the user to edit, format, copy or chart matching records without affecting others. In Excel, sorting and filtering can be done by data type including number, text, date and color. Filters can compare fields for criteria like equals, less than, greater than, begins with and contains.
Microsoft Excel allows users to organize data into spreadsheets. It contains workbooks with multiple worksheets made of cells organized into rows and columns. Excel provides functions to perform calculations and analyze data. Users can format worksheets, insert charts and images, and print selections of cells or entire worksheets. Formulas using built-in functions can easily calculate and manipulate data in Excel.
This document provides an overview of basic MS Excel functions including creating and opening workbooks, navigating worksheets, entering different types of data like text, numbers, dates and times, formatting cells, editing data, inserting and deleting columns and rows, and using basic formulas. It explains key Excel concepts such as the ribbon, columns, rows and cells, worksheets, cell references, and functions. It provides step-by-step instructions for common tasks in Excel.
This document provides instructions for creating a basic financial worksheet in Microsoft Excel 2007. It includes steps for entering sample data on sales numbers for four months, using formulas to calculate totals, applying basic formatting and styles, inserting a clustered column chart to visualize the data, and printing and saving the worksheet. The instructions introduce foundational Excel concepts such as workbooks, worksheets, cells, formulas, charts, formatting, and printing.
This document provides an overview of key Excel concepts and tasks, including:
1) Excel is a program used to enter and analyze quantitative data in spreadsheets. It allows what-if analysis by changing values to assess impacts.
2) The tutorial covers navigating and exploring Excel, entering data, formulas and functions, formatting cells, inserting and deleting rows/columns/worksheets, and printing worksheets.
3) Formulas use operators to combine values from cells and return a single result. Functions are predefined formulas like SUM to simplify calculations.
This document provides an introduction and tutorial for Microsoft Excel. It begins with an overview of Excel and what it can be used for, such as budget creation, data analysis, and presenting information. It then discusses key Excel components like the ribbon menu, cells, columns, rows, and worksheets. The document provides instructions for common tasks like navigating, entering data, formatting text and cells, inserting and deleting rows and columns, sorting data, and printing. It concludes by explaining how to copy and paste formatting between cells using tools like the format painter.
This document provides an overview of Excel functions and formulas. It is divided into sections that cover the basics of formulas, statistical and logical functions, lookup and reference formulas, text formulas, date and time formulas, array and database functions, and efficiency tips. Examples of functions are provided for aggregation, date/time, nested, IF, SUMIF, and array formulas. The document concludes with an exercise section and contact information for the presenter.
Excel can be used for calculations, data management, charts and graphs. It contains worksheets organized into rows and columns within a workbook. Each worksheet has cells located at the intersection of rows and columns that can be referenced by their address. Data is entered into cells and basic navigation uses keyboard shortcuts like tab, arrow keys, page up/down and Ctrl+home. Cells, rows and columns can be selected using the mouse or keyboard for editing.
This document discusses Microsoft Excel and its features. It introduces Excel as a spreadsheet program that allows users to organize, format and calculate data. It describes the basic interface of Excel including cells, columns, rows and sheets. It also provides information on common Excel functions and formulas for calculations, examples of using Excel to create simple reports and bills, and a formula for calculating age based on date of birth and the current year.
Introduction to Microsoft Excel for beginnersBlogger Mumma
Microsoft Excel is a spreadsheet application developed by Microsoft that features calculation and graphing tools. It consists of worksheets containing columns and rows where data is entered into cells referenced by their column letter and row number intersection. The basic Excel interface includes a title bar, menu bar, toolbars and worksheets. Formulas and functions can be used to perform calculations on the data in cells. Charts and graphs can be generated from cell data to visualize information. Data can be copied, filtered, and sorted as needed.
Data validation in Excel allows users to restrict the type of data entered into cells. This includes creating drop-down lists, restricting dates or numbers, and custom validation rules. The document provides steps to apply data validation to a cell by selecting the cell, going to the data validation menu, choosing the type of validation such as a list, selecting the source of the list options, and setting input and error messages. Data validation helps ensure accurate data entry by limiting users to valid options.
The document provides an overview of formulas and functions in Microsoft Excel 2016. It defines formulas as sequences of values, cell references, names, functions or operators that produce a new value using an equal sign. Functions are prewritten formulas that perform operations and return values. The document describes common functions like SUM, AVERAGE, MAX, MIN, as well as date/time functions. It explains concepts like arguments, ranges, arrays, operators and cell references used in formulas.
This document provides information about Microsoft Excel, including:
- Excel is an electronic spreadsheet program that allows users to create graphs, worksheets, and perform calculations.
- It has features like calculation, graphing tools, pivot tables, and a macro programming language called VBA.
- Excel is useful for tasks like data entry, data manipulation, formulas, analysis, and automatic graphing.
- The document then reviews parts of the Excel window and interface like ribbons, tabs, and cells.
- It provides instructions on opening, saving, and manipulating Excel files and worksheets.
Calculating Bank Withdrawal Interest and Time A Helpful Template.pdfIlgar Zarbaliyev
Welcome to "Calculating Bank Withdrawal Interest and Time: A Helpful Template" newsletter!
In this insightful newsletter, we dive into the world of banking and provide you with valuable information on how to calculate the interest and time involved in your bank withdrawals. Whether you're a seasoned investor, a curious saver, or simply someone looking to make the most out of your banking transactions, this newsletter is here to guide you.
We understand that determining the interest earned and the time it takes for your bank withdrawals to mature can be complex. That's why our team of experts has curated a handy template that simplifies the process. With our step-by-step instructions and expert tips, you'll gain a better understanding of how to accurately calculate your earnings and plan your financial goals effectively.
Stay updated with the latest trends and insights in the banking industry, learn how to make informed decisions, and discover strategies to maximize your returns. Our newsletter is designed to empower you with the knowledge and tools you need to navigate the world of bank withdrawals with confidence.
So, join us today and embark on a journey towards financial success! Sign up now for our "Calculating Bank Withdrawal Interest and Time: A Helpful Template" newsletter and unlock the secrets to optimizing your banking experience.
This document provides summaries and examples of Excel functions for working with rows, columns, references, and lookups:
- It explains the ROW and COLUMN functions which return the row or column number of a cell reference.
- The INDIRECT function allows changing a cell reference within a formula without changing the formula itself.
- OFFSET returns a reference that is a specified number of rows and columns from another cell or range.
- INDEX returns a value or reference from within a table or range based on row and column indexes.
- MATCH searches for an item in a range and returns its relative position, useful for lookups.
In September, 2018, we released dynamic array formulas for Excel for Microsoft 365. The differences between dynamic arrays
and legacy Ctrl+Shift+Enter (CSE) formulas are discussed below.
Dynamic array formulas:
Can "spill" outside the cell bounds where the formula is entered. The following example shows the RANDARRAY function in
D1, which spills across D1:F5, or 5 rows by 3 columns. The dynamic array formula tec
If you have inherited workbooks from
someone else or if you have imported
data from external data sources, you
have probably come across data that
was either structured or formatted (or
both) in such a way that it was either
difficult to read or difficult to work
with. It could be mainframe data that
arrives as all-uppercase letters, dates
that appear in non-date formats,
phone numbers that don’t have dashes
or parentheses, or fields that combine
multiple pieces of data (such as first
names and last names).
This report summarizes job interviews conducted during a job acceptance process, including the total number of consultations and participants, consultations grouped by performance, safety, health, pay policy and working hours, start and end dates of consultations shown in a table, unique worker numbers by position and region in a donut chart, filtering by name of workers and first/second interviewees, number of workers after first and second interviews shown in bars by happy, normal and unhappy criteria, and a table with names of workers, interview dates, interviewers, and interview results. The report was prepared using knowledge from the Enterprise DNA portal.
This document discusses a Power BI report on sales analysis created by the author after participating in Enterprise DNA programs. The report contains KPIs like total revenue, total sales, unique orders and average daily sales calculated through DAX measures. It includes pie charts showing information by region, product group and store performance, and allows filtering by sales channel and time. Total revenues are shown over running totals, quarters and in an area chart comparing the current and previous month. Seventeen measures were written in the report.
This four page report contains supplier quality metrics from seven measures. The first page includes a table of total defects by category and charts of total defects by month/year and type. The second page shows regional defect data by factory in bars and scatter charts. The third page contains bar charts of defects by material and type along with a table of totals by vendor. The fourth page displays downtime analysis with cards of totals, area charts of downtime by material for the current and previous year, and bar and map charts of downtime by category, vendor and plant location. The report applies learning from the Enterprise DNA portal.
What-If Analysis is the process of changing the values in cells to see how those changes will affect the outcome of formulas on the worksheet.
Four kinds of What-If Analysis tools come with Excel: Scenarios, Goal Seek, Solver, and Data Tables. Scenarios and Data Tables take sets of input values and determine possible results.
(https://support.office.com/en-us/article/introduction-to-what-if-analysis-22bffa5f-e891-4acc-bf7a-e4645c446fb4)
Scenarios: It is a collection of input values that are placed in formulas to get a result.
Goal Seek: It is used to find desired result by changing an input value.
Solver: It is used to find optimal solutions for all kind of decision issues.
Data Table: It is a range of cells where one column consists of a series of values, called input cells.
By using What-If Analysis tools in Excel, you can use several different sets of values in one or more formulas to explore all the various results.
For example, you can do What-If Analysis to build two budgets that each assumes a certain level of revenue. Or, you can specify a result that you want a formula to produce, and then determine what sets of values will produce that result. Excel provides several different tools to help you perform the type of analysis that fits your needs.
A Scenario is a set of values that Excel saves and can substitute automatically in cells on a worksheet. You can create and save different groups of values on a worksheet and then switch to any of these new scenarios to view different results.
For example, suppose you have two budget scenarios: a worst case and a best case. You can use the Scenario Manager to create both scenarios on the same worksheet, and then switch between them. For each scenario, you specify the cells that change and the values to use for that scenario. When you switch between scenarios, the result cell changes to reflect the different changing cell values.
Dear Excel Lovers!
Dear Fast Food Lovers!
And Dear Pizza, Kebab Lovers!
The Excel template file contains menus, including the foods and quantities used in the preparation of 27 (twenty seven) kinds of dishes.
The file consists of 6 sheets.
You can use "RecipeContent" sheet as a cover in the .
On the "ReadytouseProducts" sheet, served 27 kinds of meals are shown with pictures, prices, costs, and income rates.
In the "PurchasedIngredients" Sheet, the ingredients used in the preparation of 27 different dishes are shown together with their prices.
In the "RecipeCostCalculator" Sheet, the ingredients used in the preparation of each dish, are shown with their quantities and prices .
In the "RecipeAnalysisPivotTables" sheet, the detailed report of the dishes through slicers is presented by using the pivot table.
And in the last "Dish Cost Report" Sheet, user can get the necessary information including ingredients, total cost, prices, used weight, etc. in the form of report.
User may add some other expenses like gas, water, etc at the bottom of the report.
We can present this report to the management in the form of a summary and detailed report of the menus.
Excel features and functions such as Data Validation, Upper, Concatenate, Unique, Filter, Sumifs are used in this template.
Template can be downloaded from the following link:
https://www.eloquens.com/tool/pN1nsdNZ/finance/restaurant-financial-plans-templates/kebabs-sandwiches-and-pizzas-recipes-and-ideas
Bon Appetit
Financial Schedules- Amortization Schedule
An amortization schedule is a table detailing each periodic payment on an amortizing loan, as generated by an amortization calculator. Amortization refers to the process of paying off a debt over time through regular payments.
https://en.wikipedia.org/wiki/Amortization_schedule
Financial Schedules- Amortization Schedule
An amortization schedule is a table detailing each periodic payment on an amortizing loan, as generated by an amortization calculator. Amortization refers to the process of paying off a debt over time through regular payments.
This template will help you to follow your inventory
File can be loaded clicking the next link:
https://drive.google.com/file/d/1lXNY-BC1DBH9UChxjPGLv2FeM9WmHgnB/view?usp=sharing
This template will help you to calculate Credit/Investment. Template has been designed dynamically. You may download this template from the next link:
https://drive.google.com/file/d/1WheE3gk5qXJU8g5QRZ42XMXA07OOrD9s/view?usp=sharing
Moving Average and Forecast Charts made based upon Şişecam Group of Companies' Sales Numbers.
https://drive.google.com/file/d/1D-QaITnyW7gnksvW5YsJpx1eW2Gh_LYE/view?usp=sharing
Dynamic Diagram based upon the data (import from geographic regions) of the State Statistical Committee of the Republic of Azerbaijan...
https://drive.google.com/file/d/12vDU0sqV2Yx14AY10CvgoB2kaamCt1BZ/view?usp=sharing
https://drive.google.com/file/d/1rZ52j44RM73tdMZkdg1JkjY0b6mHAlrh/view?usp=sharing
This file is about Sales Dashboard Preparation.
Learned from @Karen Abecia after attending webinar organized by @Celia Alves. Thanks them.
This document lists keyboard shortcuts for formula-related tasks in Excel, including inserting autosum formulas with Alt+=, toggling cell references between absolute and relative with F4, displaying the insert function dialog with Shift+F3, and evaluating parts of a formula with F9. It also includes shortcuts for selecting formula-referenced cells like Ctrl+[/] and toggling between value and formula display with Ctrl+`.
06-04-2024 - NYC Tech Week - Discussion on Vector Databases, Unstructured Data and AI
Discussion on Vector Databases, Unstructured Data and AI
https://www.meetup.com/unstructured-data-meetup-new-york/
This meetup is for people working in unstructured data. Speakers will come present about related topics such as vector databases, LLMs, and managing data at scale. The intended audience of this group includes roles like machine learning engineers, data scientists, data engineers, software engineers, and PMs.This meetup was formerly Milvus Meetup, and is sponsored by Zilliz maintainers of Milvus.
State of Artificial intelligence Report 2023kuntobimo2016
Artificial intelligence (AI) is a multidisciplinary field of science and engineering whose goal is to create intelligent machines.
We believe that AI will be a force multiplier on technological progress in our increasingly digital, data-driven world. This is because everything around us today, ranging from culture to consumer products, is a product of intelligence.
The State of AI Report is now in its sixth year. Consider this report as a compilation of the most interesting things we’ve seen with a goal of triggering an informed conversation about the state of AI and its implication for the future.
We consider the following key dimensions in our report:
Research: Technology breakthroughs and their capabilities.
Industry: Areas of commercial application for AI and its business impact.
Politics: Regulation of AI, its economic implications and the evolving geopolitics of AI.
Safety: Identifying and mitigating catastrophic risks that highly-capable future AI systems could pose to us.
Predictions: What we believe will happen in the next 12 months and a 2022 performance review to keep us honest.
ViewShift: Hassle-free Dynamic Policy Enforcement for Every Data LakeWalaa Eldin Moustafa
Dynamic policy enforcement is becoming an increasingly important topic in today’s world where data privacy and compliance is a top priority for companies, individuals, and regulators alike. In these slides, we discuss how LinkedIn implements a powerful dynamic policy enforcement engine, called ViewShift, and integrates it within its data lake. We show the query engine architecture and how catalog implementations can automatically route table resolutions to compliance-enforcing SQL views. Such views have a set of very interesting properties: (1) They are auto-generated from declarative data annotations. (2) They respect user-level consent and preferences (3) They are context-aware, encoding a different set of transformations for different use cases (4) They are portable; while the SQL logic is only implemented in one SQL dialect, it is accessible in all engines.
#SQL #Views #Privacy #Compliance #DataLake
Global Situational Awareness of A.I. and where its headedvikram sood
You can see the future first in San Francisco.
Over the past year, the talk of the town has shifted from $10 billion compute clusters to $100 billion clusters to trillion-dollar clusters. Every six months another zero is added to the boardroom plans. Behind the scenes, there’s a fierce scramble to secure every power contract still available for the rest of the decade, every voltage transformer that can possibly be procured. American big business is gearing up to pour trillions of dollars into a long-unseen mobilization of American industrial might. By the end of the decade, American electricity production will have grown tens of percent; from the shale fields of Pennsylvania to the solar farms of Nevada, hundreds of millions of GPUs will hum.
The AGI race has begun. We are building machines that can think and reason. By 2025/26, these machines will outpace college graduates. By the end of the decade, they will be smarter than you or I; we will have superintelligence, in the true sense of the word. Along the way, national security forces not seen in half a century will be un-leashed, and before long, The Project will be on. If we’re lucky, we’ll be in an all-out race with the CCP; if we’re unlucky, an all-out war.
Everyone is now talking about AI, but few have the faintest glimmer of what is about to hit them. Nvidia analysts still think 2024 might be close to the peak. Mainstream pundits are stuck on the wilful blindness of “it’s just predicting the next word”. They see only hype and business-as-usual; at most they entertain another internet-scale technological change.
Before long, the world will wake up. But right now, there are perhaps a few hundred people, most of them in San Francisco and the AI labs, that have situational awareness. Through whatever peculiar forces of fate, I have found myself amongst them. A few years ago, these people were derided as crazy—but they trusted the trendlines, which allowed them to correctly predict the AI advances of the past few years. Whether these people are also right about the next few years remains to be seen. But these are very smart people—the smartest people I have ever met—and they are the ones building this technology. Perhaps they will be an odd footnote in history, or perhaps they will go down in history like Szilard and Oppenheimer and Teller. If they are seeing the future even close to correctly, we are in for a wild ride.
Let me tell you what we see.
Analysis insight about a Flyball dog competition team's performanceroli9797
Insight of my analysis about a Flyball dog competition team's last year performance. Find more: https://github.com/rolandnagy-ds/flyball_race_analysis/tree/main
4th Modern Marketing Reckoner by MMA Global India & Group M: 60+ experts on W...Social Samosa
The Modern Marketing Reckoner (MMR) is a comprehensive resource packed with POVs from 60+ industry leaders on how AI is transforming the 4 key pillars of marketing – product, place, price and promotions.
Learn SQL from basic queries to Advance queriesmanishkhaire30
Dive into the world of data analysis with our comprehensive guide on mastering SQL! This presentation offers a practical approach to learning SQL, focusing on real-world applications and hands-on practice. Whether you're a beginner or looking to sharpen your skills, this guide provides the tools you need to extract, analyze, and interpret data effectively.
Key Highlights:
Foundations of SQL: Understand the basics of SQL, including data retrieval, filtering, and aggregation.
Advanced Queries: Learn to craft complex queries to uncover deep insights from your data.
Data Trends and Patterns: Discover how to identify and interpret trends and patterns in your datasets.
Practical Examples: Follow step-by-step examples to apply SQL techniques in real-world scenarios.
Actionable Insights: Gain the skills to derive actionable insights that drive informed decision-making.
Join us on this journey to enhance your data analysis capabilities and unlock the full potential of SQL. Perfect for data enthusiasts, analysts, and anyone eager to harness the power of data!
#DataAnalysis #SQL #LearningSQL #DataInsights #DataScience #Analytics
1. Cell References
A cell reference refers to the value of a different cell or cell range on the current worksheet
or a different worksheet within the workbook.
Cell references come mainly in two styles. But, depending on the use of the dollar sign
symbol, the number of styles can be increased to four.
1. Relative:
Example: A1. Cell reference adjusts to new location while copying formula
2. Absolute:
Example: $A$1. There is no change in cell reference while copying formula
2. 3. Mixed: Row Absolute
Example: A$1. Column is changing, row doesn’t change while copying formula
4. Mixed: Column Absolute
Example: $A1. Column doesn’t change, row is changing while copying formula
Hint: Pressing F4 Key the status of cell references can be changed