Download to read offline
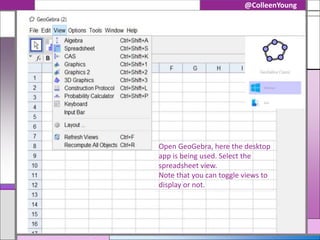
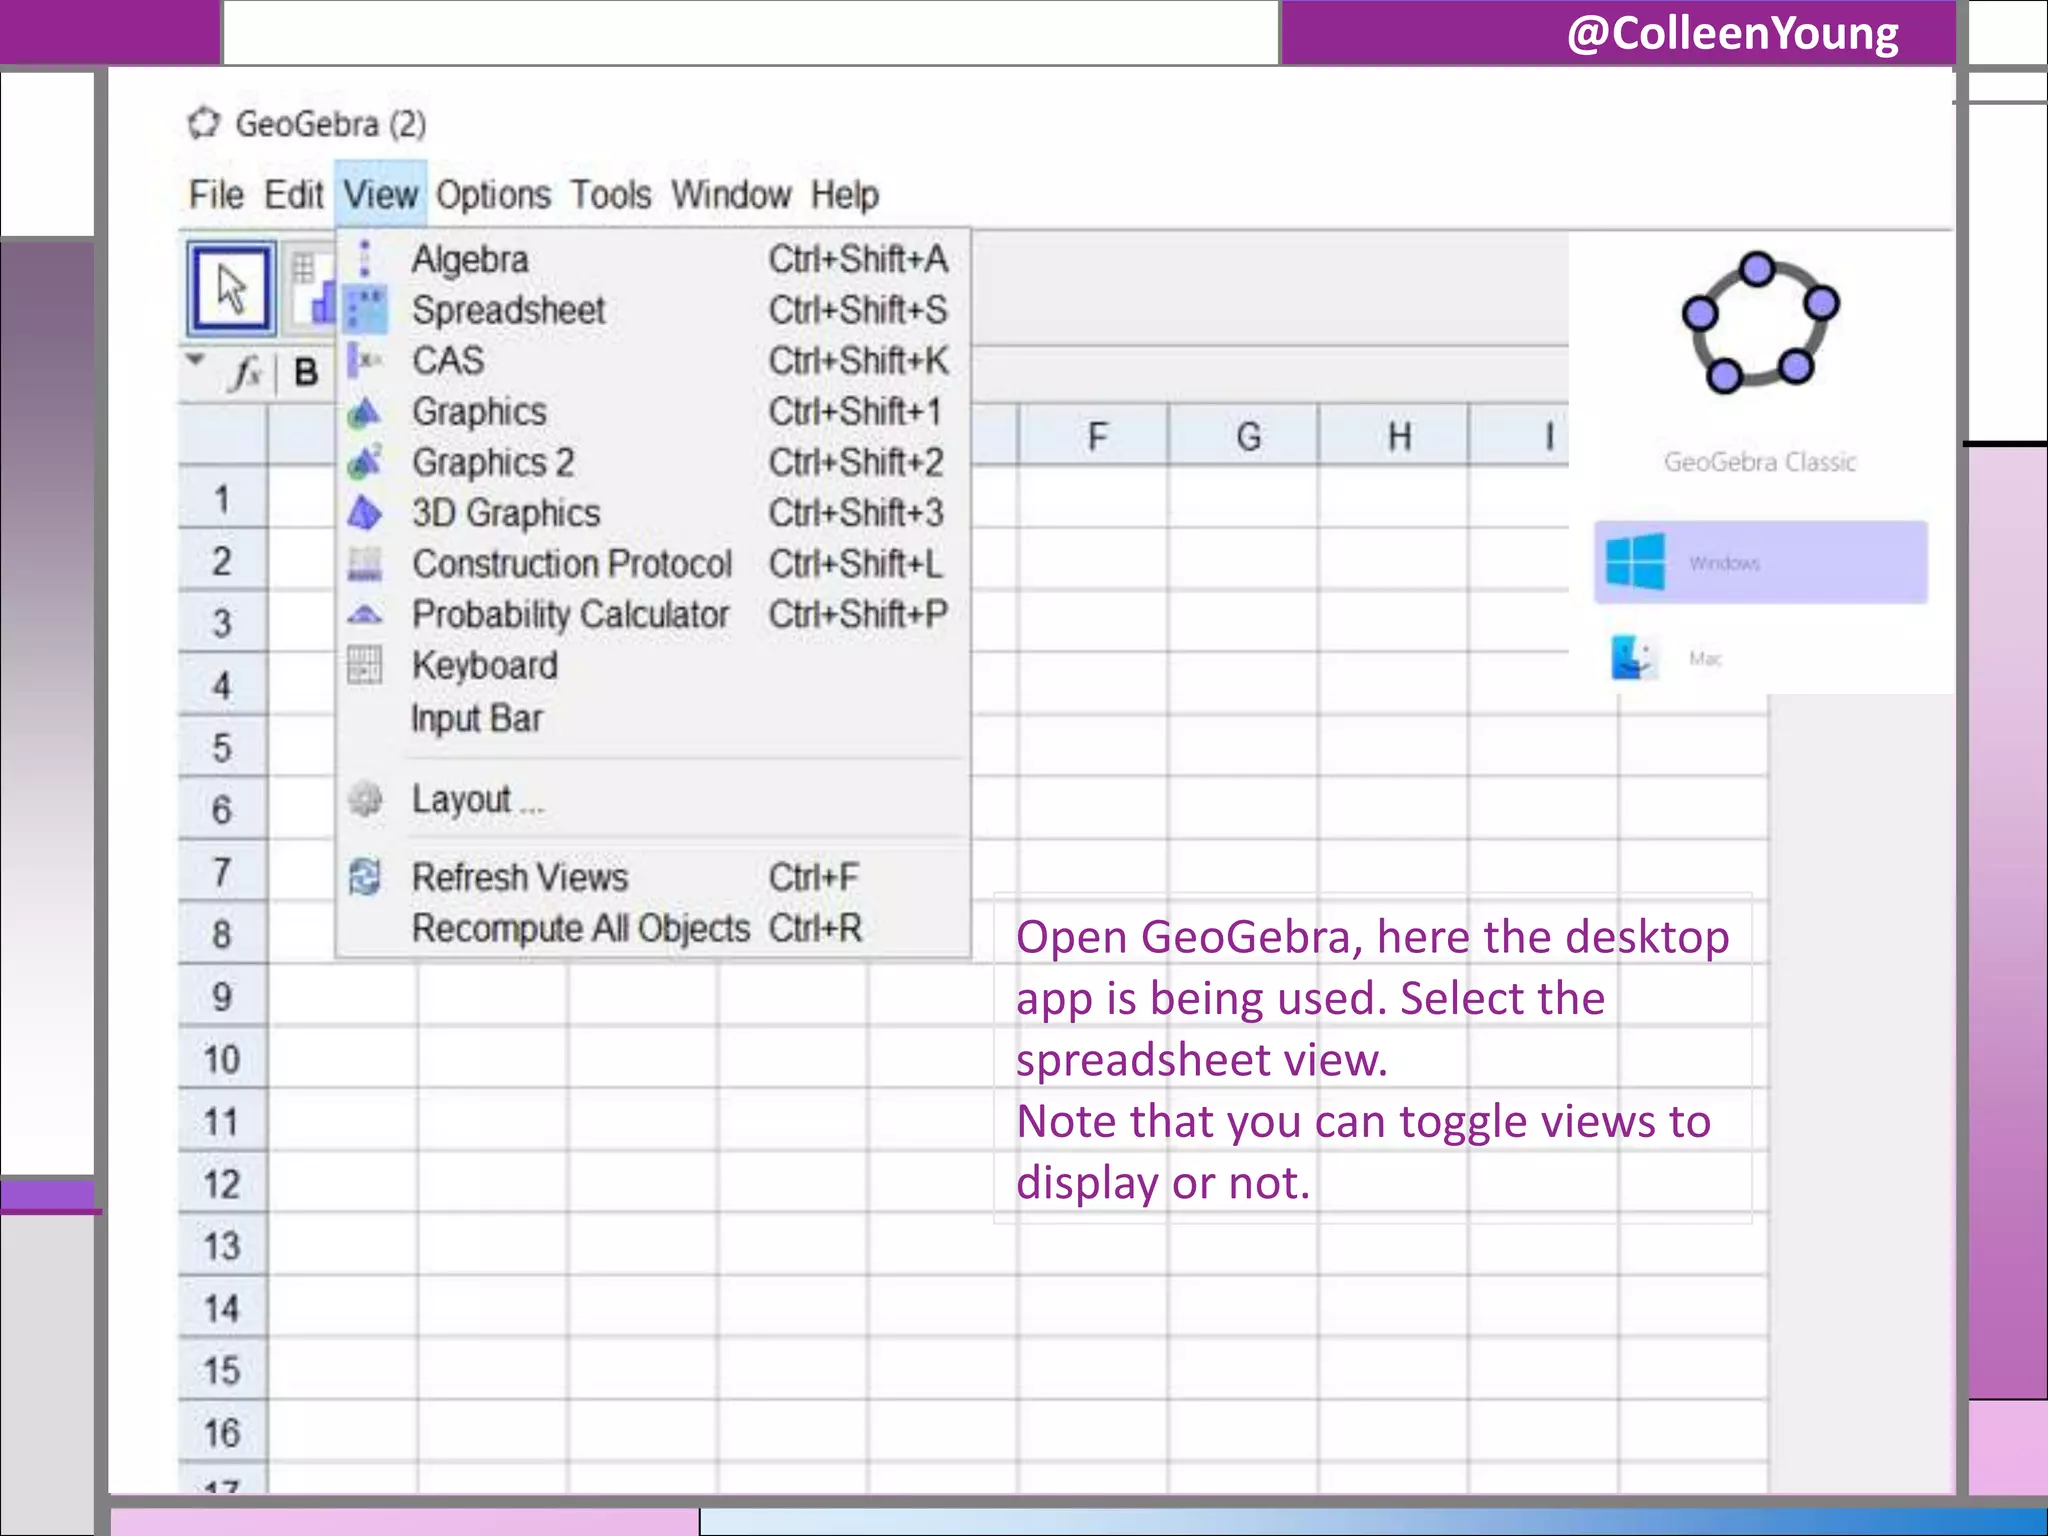
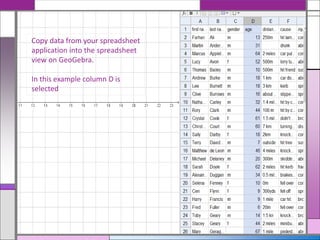
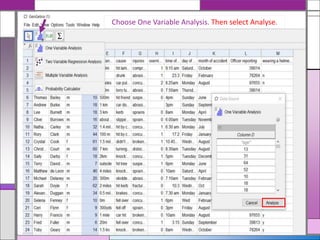
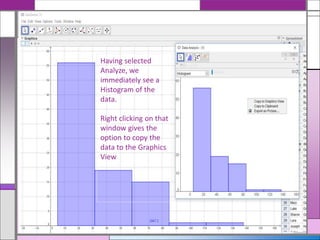
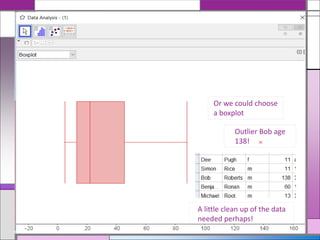
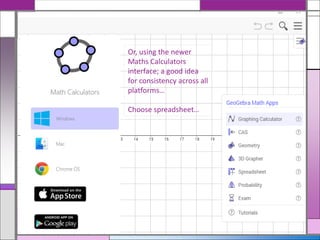
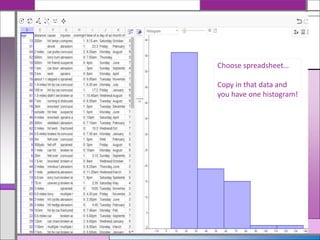
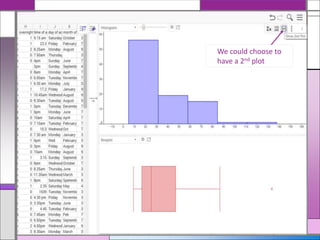

This document provides instructions for analyzing spreadsheet data in GeoGebra by copying data from another application into GeoGebra's spreadsheet view, selecting one variable analysis to generate a histogram of the data, and optionally generating additional plots like a boxplot or second histogram by right clicking or using GeoGebra's math calculators interface. Outlier data like an age of 138 is identified for potential removal to clean up the data.