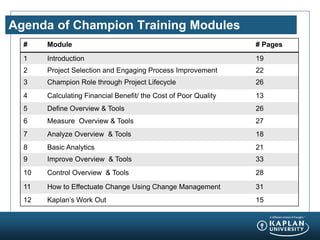
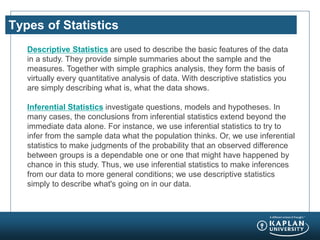
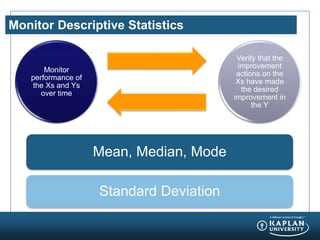
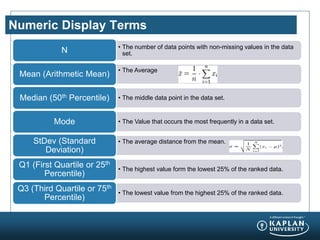
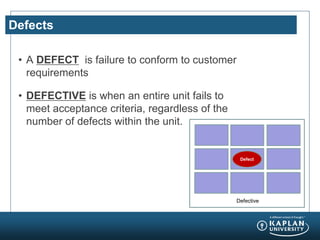
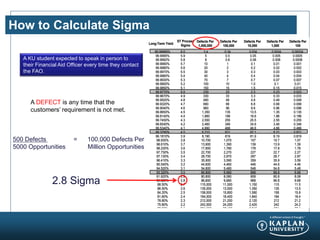
SlideShare a Scribd company logo
Action plan and SOP for
Special Cause Variation
Determine new Goals
(UCL, LCL)
Module 8: Basic Analytics
Welcome to Champion Training
Facilitated by Kaplan’s Process Improvement Team
Agenda of Champion Training Modules
# Module # Pages
1 Introduction 19
2 Project Selection and Engaging Process Improvement 22
3 Champion Role through Project Lifecycle 26
4 Calculating Financial Benefit/ the Cost of Poor Quality 13
5 Define Overview & Tools 26
6 Measure Overview & Tools 27
7 Analyze Overview & Tools 18
8 Basic Analytics 21
9 Improve Overview & Tools 33
10 Control Overview & Tools 28
11 How to Effectuate Change Using Change Management 31
12 Kaplan’s Work Out 15
Purpose of This Training
Provide Kaplan champions with the knowledge and skills to be
effective leaders and coaches to their people engaged in Process
Improvement/Six Sigma projects
“Everything should be made as simple as
possible, but not too simple.”
Albert Einstein
Types of Statistics
Descriptive Statistics are used to describe the basic features of the data
in a study. They provide simple summaries about the sample and the
measures. Together with simple graphics analysis, they form the basis of
virtually every quantitative analysis of data. With descriptive statistics you
are simply describing what is, what the data shows.
Inferential Statistics investigate questions, models and hypotheses. In
many cases, the conclusions from inferential statistics extend beyond the
immediate data alone. For instance, we use inferential statistics to try to
infer from the sample data what the population thinks. Or, we use inferential
statistics to make judgments of the probability that an observed difference
between groups is a dependable one or one that might have happened by
chance in this study. Thus, we use inferential statistics to make inferences
from our data to more general conditions; we use descriptive statistics
simply to describe what's going on in our data.
Monitor Descriptive Statistics
Monitor
performance of
the Xs and Ys
over time
Verify that the
improvement
actions on the
Xs have made
the desired
improvement in
the Y
Mean, Median, Mode
Standard Deviation
Numeric Display Terms
• The number of data points with non-missing values in the data
set.N
• The Average
Mean (Arithmetic Mean)
• The middle data point in the data set.Median (50th Percentile)
• The Value that occurs the most frequently in a data set.Mode
• The average distance from the mean.StDev (Standard
Deviation)
• The highest value form the lowest 25% of the ranked data.
Q1 (First Quartile or 25th
Percentile)
• The lowest value from the highest 25% of the ranked data.
Q3 (Third Quartile or 75th
Percentile)
Defects
• A DEFECT is failure to conform to customer
requirements
• DEFECTIVE is when an entire unit fails to
meet acceptance criteria, regardless of the
number of defects within the unit.
Defective
Defect
Defective
How to Calculate Sigma
3.4
5
8
10
20
30
40
70
100
150
230
330
480
680
960
1,350
1,860
2,550
3,460
4,660
6,210
8,190
10,700
13,900
17,800
22,700
28,700
35,900
44,600
54,800
66,800
80,800
96,800
115,000
135,000
158,000
184,000
212,000
242,000
274,000
308,000
344,000
382,000
420,000
460,000
500,000
540,000
0.34
0.5
0.8
1
2
3
4
7
10
15
23
33
48
68
96
135
186
255
346
466
621
819
1,070
1,390
1,780
2,270
2,870
3,590
4,460
5,480
6,680
8,080
9,680
11,500
13,500
15,800
18,400
21,200
24,200
27,400
30,800
34,400
38,200
42,000
46,000
50,000
54,000
0.034
0.05
0.08
0.1
0.2
0.3
0.4
0.7
1.0
1.5
2.3
3.3
4.8
6.8
9.6
13.5
18.6
25.5
34.6
46.6
62.1
81.9
107
139
178
227
287
359
446
548
668
808
968
1,150
1,350
1,580
1,840
2,120
2,420
2,740
3,080
3,440
3,820
4,200
4,600
5,000
5,400
0.0034
0.005
0.008
0.01
0.02
0.03
0.04
0.07
0.1
0.15
0.23
0.33
0.48
0.68
0.96
1.35
1.86
2.55
3.46
4.66
6.21
8.19
10.7
13.9
17.8
22.7
28.7
35.9
44.6
54.8
66.8
80.8
96.8
115
135
158
184
212
242
274
308
344
382
420
460
500
540
0.00034
0.0005
0.0008
0.001
0.002
0.003
0.004
0.007
0.01
0.015
0.023
0.033
0.048
0.068
0.096
0.135
0.186
0.255
0.346
0.466
0.621
0.819
1.07
1.39
1.78
2.27
2.87
3.59
4.46
5.48
6.68
8.08
9.68
11.5
13.5
15.8
18.4
21.2
24.2
27.4
30.8
34.4
38.2
42
46
50
54
99.99966%
99.9995%
99.9992%
99.9990%
99.9980%
99.9970%
99.9960%
99.9930%
99.9900%
99.9850%
99.9770%
99.9670%
99.9520%
99.9320%
99.9040%
99.8650%
99.8140%
99.7450%
99.6540%
99.5340%
99.3790%
99.1810%
98.930%
98.610%
98.220%
97.730%
97.130%
96.410%
95.540%
94.520%
93.320%
91.920%
90.320%
88.50%
86.50%
84.20%
81.60%
78.80%
75.80%
72.60%
69.20%
65.60%
61.80%
58.00%
54.00%
50%
46%
6.0
5.9
5.8
5.7
5.6
5.5
5.4
5.3
5.2
5.1
5.0
4.9
4.8
4.7
4.6
4.5
4.4
4.3
4.2
4.1
4.0
3.9
3.8
3.7
3.6
3.5
3.4
3.3
3.2
3.1
3.0
2.9
2.8
2.7
2.6
2.5
2.4
2.3
2.2
2.1
2.0
1.9
1.8
1.7
1.6
1.5
1.4
Long-Term Yield
ST Process
Sigma
Defects Per
1,000,000
Defects Per
100,000
Defects Per
10,000
Defects Per
1,000
Defects Per
100
3.4
5
8
10
20
30
40
70
100
150
230
330
480
680
960
1,350
1,860
2,550
3,460
4,660
6,210
8,190
10,700
13,900
17,800
22,700
28,700
35,900
44,600
54,800
66,800
80,800
96,800
115,000
135,000
158,000
184,000
212,000
242,000
274,000
308,000
344,000
382,000
420,000
460,000
500,000
540,000
0.34
0.5
0.8
1
2
3
4
7
10
15
23
33
48
68
96
135
186
255
346
466
621
819
1,070
1,390
1,780
2,270
2,870
3,590
4,460
5,480
6,680
8,080
9,680
11,500
13,500
15,800
18,400
21,200
24,200
27,400
30,800
34,400
38,200
42,000
46,000
50,000
54,000
0.034
0.05
0.08
0.1
0.2
0.3
0.4
0.7
1.0
1.5
2.3
3.3
4.8
6.8
9.6
13.5
18.6
25.5
34.6
46.6
62.1
81.9
107
139
178
227
287
359
446
548
668
808
968
1,150
1,350
1,580
1,840
2,120
2,420
2,740
3,080
3,440
3,820
4,200
4,600
5,000
5,400
0.0034
0.005
0.008
0.01
0.02
0.03
0.04
0.07
0.1
0.15
0.23
0.33
0.48
0.68
0.96
1.35
1.86
2.55
3.46
4.66
6.21
8.19
10.7
13.9
17.8
22.7
28.7
35.9
44.6
54.8
66.8
80.8
96.8
115
135
158
184
212
242
274
308
344
382
420
460
500
540
0.00034
0.0005
0.0008
0.001
0.002
0.003
0.004
0.007
0.01
0.015
0.023
0.033
0.048
0.068
0.096
0.135
0.186
0.255
0.346
0.466
0.621
0.819
1.07
1.39
1.78
2.27
2.87
3.59
4.46
5.48
6.68
8.08
9.68
11.5
13.5
15.8
18.4
21.2
24.2
27.4
30.8
34.4
38.2
42
46
50
54
99.99966%
99.9995%
99.9992%
99.9990%
99.9980%
99.9970%
99.9960%
99.9930%
99.9900%
99.9850%
99.9770%
99.9670%
99.9520%
99.9320%
99.9040%
99.8650%
99.8140%
99.7450%
99.6540%
99.5340%
99.3790%
99.1810%
98.930%
98.610%
98.220%
97.730%
97.130%
96.410%
95.540%
94.520%
93.320%
91.920%
90.320%
88.50%
86.50%
84.20%
81.60%
78.80%
75.80%
72.60%
69.20%
65.60%
61.80%
58.00%
54.00%
50%
46%
6.0
5.9
5.8
5.7
5.6
5.5
5.4
5.3
5.2
5.1
5.0
4.9
4.8
4.7
4.6
4.5
4.4
4.3
4.2
4.1
4.0
3.9
3.8
3.7
3.6
3.5
3.4
3.3
3.2
3.1
3.0
2.9
2.8
2.7
2.6
2.5
2.4
2.3
2.2
2.1
2.0
1.9
1.8
1.7
1.6
1.5
1.4
Long-Term Yield
ST Process
Sigma
Defects Per
1,000,000
Defects Per
100,000
Defects Per
10,000
Defects Per
1,000
Defects Per
100
Long-Term Yield
ST Process
Sigma
Defects Per
1,000,000
Defects Per
100,000
Defects Per
10,000
Defects Per
1,000
Defects Per
100
A KU student expected to speak in person to
their Financial Aid Officer every time they contact
the FAO.
500 Defects = 100,000 Defects Per
5000 Opportunities Million Opportunities
2.8 Sigma
A DEFECT is any time that the
customers’ requirement is not met.
Shift The Mean And Reduce Variation
Calculate new process capability after implementing the improvement or design
Determine if the new process capability (process sigma) meets stated goals
See if you achieved the desired shift, variance reduction, or DPMO reduction
Sigma and Normal Distribution
As you can see, the curve is divided into a series of equal increments, each
representing one standard deviation from the mean.
Histogram
100806040200-20
25
20
15
10
5
0
DAYS
Frequency
Mean 29.41
StDev 24.45
N 68
Days it Takes for FAO to Return calls
Spec Limit is 5 days maximum
Causes for Greenbelts Not Completing Project
55
25
8
6 3 3
Not enough
time
Sponsor does
not understand
value
Did not pass
exam
Unclear of
what needed
to be done on
template
Lost template Office closed for
a month
55%
80%
88%
94%
100%97%
Causes
CumulativePercent
Central Limit Theorem
http://www.intuitor.com/statistics/CentralLim.html
If a random sample is drawn from any population, the sampling distribution of the sample
mean is approximately normal for a sufficiently large sample size. The larger the sample
size, the more closely the sampling distribution of the sample mean will resemble a normal
distribution
1 3 15 30
Yields
Rolled
Throughput
Yield
Receive request for Financial Aid
45,000 DPMO wasted
Step 1 in Financial Aid
28,650 DPMO wasted
Step 2 in Awarding Financial Aid
51,876 DPMO wasted
Financial Aid Awarded
Right
First
Time
125,526 DPMO
wasted opportunities
95.5% Yield (YTP)
97% Yield (YTP)
94.4% Yield (YTP)
Yields can be multiplied with many
process steps. Assumes independent
sources of defects.
YRT = .955*.97*.944 = 87.5%
Correlations are not Necessarily Causal
• City of Oldenburg, Germany
• 1930- 1936
• X-axis: stork population
• Y-axis: human population
What your mother told you about
babies when you were three is still
not right, despite the strong
correlation “evidence”.
Causal means that one variable results in the other thing occurring. In general, it is
extremely difficult to establish causality between two correlated events or observances.
There are many statistical tools to establish a statistical significant correlation.
Source: Box, Hunter, hunter Statistics For Experiments 1978
Regression
Regression can be used for prediction, inference, hypothesis testing, and
modeling of causal relationships
The procedure calculates estimates of the relationship between the
independent variables (advertising, price, etc.) and the dependent variable
(sales).
Simple Linear
Regression Analysis:
Y = b0 + b1X
The Control Chart or Shewhart Chart
Observation
IndividualValue
28252219161310741
60
50
40
30
20
10
0
_
X=29.06
UCL=55.24
LCL=2.87
1
Control Chart of Recycle
Process
Center
(usually the Mean)
Special Cause
Variation
Detected
Control
Limits
Common
Cause
Variation
Common Distributions
Sample size - Normal Distributions
• As the number of samples measured increases, to 30, the distribution
becomes more representative of the population.
Population
sample
NORMAL DISTRIBUTION’S IMPORTANCE
Most variables are approximately normally
distributed. This means we can use the
normal distribution as a model to help us
better understand these variables.
NORMALITY TESTS
Normality tests are used to determine if any
group of data fits a standard normal
distribution
Confirm New Capability
Calculate new
process capability
Determine if the
new process sigma
meets stated goals
Action plan and SOP for
Special Cause Variation
Determine new Goals
(UCL, LCL)
Module Wrap Up
•Questions/Comments
•Discussions of Process
Improvement Projects in Your Area
•Discuss Next Module
•Establish Time/Date of Next
Meeting

More Related Content

What's hot

Hypothesis Testing: Proportions (Compare 1:Standard)
Hypothesis Testing: Proportions (Compare 1:Standard)Hypothesis Testing: Proportions (Compare 1:Standard)
Hypothesis Testing: Proportions (Compare 1:Standard)
Matt Hansen
 
Hypothesis Testing: Relationships (Compare 1:1)
Hypothesis Testing: Relationships (Compare 1:1)Hypothesis Testing: Relationships (Compare 1:1)
Hypothesis Testing: Relationships (Compare 1:1)
Matt Hansen
 
Hypothesis Testing: Central Tendency – Non-Normal (Compare 1:Standard)
Hypothesis Testing: Central Tendency – Non-Normal (Compare 1:Standard)Hypothesis Testing: Central Tendency – Non-Normal (Compare 1:Standard)
Hypothesis Testing: Central Tendency – Non-Normal (Compare 1:Standard)
Matt Hansen
 
Hypothesis Testing: Central Tendency – Non-Normal (Compare 2+ Factors)
Hypothesis Testing: Central Tendency – Non-Normal (Compare 2+ Factors)Hypothesis Testing: Central Tendency – Non-Normal (Compare 2+ Factors)
Hypothesis Testing: Central Tendency – Non-Normal (Compare 2+ Factors)
Matt Hansen
 
Machine learning in medicine: calm down
Machine learning in medicine: calm downMachine learning in medicine: calm down
Machine learning in medicine: calm down
BenVanCalster
 
Tree Based Uplift Modeling
Tree Based Uplift ModelingTree Based Uplift Modeling
Tree Based Uplift ModelingAnd Ozbay, Ph.D.
 
The basics of prediction modeling
The basics of prediction modeling The basics of prediction modeling
The basics of prediction modeling
Maarten van Smeden
 
How to establish and evaluate clinical prediction models - Statswork
How to establish and evaluate clinical prediction models - StatsworkHow to establish and evaluate clinical prediction models - Statswork
How to establish and evaluate clinical prediction models - Statswork
Stats Statswork
 
Development and evaluation of prediction models: pitfalls and solutions (Part...
Development and evaluation of prediction models: pitfalls and solutions (Part...Development and evaluation of prediction models: pitfalls and solutions (Part...
Development and evaluation of prediction models: pitfalls and solutions (Part...
BenVanCalster
 
6.hypothesistesting.06
6.hypothesistesting.066.hypothesistesting.06
6.hypothesistesting.06
MehwishFahad
 
Why the EPV≥10 sample size rule is rubbish and what to use instead
Why the EPV≥10 sample size rule is rubbish and what to use instead Why the EPV≥10 sample size rule is rubbish and what to use instead
Why the EPV≥10 sample size rule is rubbish and what to use instead
Maarten van Smeden
 
1120 track2 bennett
1120 track2 bennett1120 track2 bennett
1120 track2 bennett
Rising Media, Inc.
 
Decision analysis part iii
Decision analysis part iiiDecision analysis part iii
Decision analysis part iii
Ask To Solve
 
Hypothesis Testing: Statistical Laws and Confidence Intervals
Hypothesis Testing: Statistical Laws and Confidence IntervalsHypothesis Testing: Statistical Laws and Confidence Intervals
Hypothesis Testing: Statistical Laws and Confidence Intervals
Matt Hansen
 
Absence of a gold standard in diagnostic test accuracy research
Absence of a gold standard in diagnostic test accuracy researchAbsence of a gold standard in diagnostic test accuracy research
Absence of a gold standard in diagnostic test accuracy research
Maarten van Smeden
 
Forecast value-added-analysis-106186
Forecast value-added-analysis-106186Forecast value-added-analysis-106186
Forecast value-added-analysis-106186
Amy Patton
 
Hypothesis Testing: Central Tendency – Normal (Compare 1:1)
Hypothesis Testing: Central Tendency – Normal (Compare 1:1)Hypothesis Testing: Central Tendency – Normal (Compare 1:1)
Hypothesis Testing: Central Tendency – Normal (Compare 1:1)
Matt Hansen
 
Hypothesis Testing: Central Tendency – Normal (Compare 1:Standard)
Hypothesis Testing: Central Tendency – Normal (Compare 1:Standard)Hypothesis Testing: Central Tendency – Normal (Compare 1:Standard)
Hypothesis Testing: Central Tendency – Normal (Compare 1:Standard)
Matt Hansen
 
Introduction to prediction modelling - Berlin 2018 - Part II
Introduction to prediction modelling - Berlin 2018 - Part IIIntroduction to prediction modelling - Berlin 2018 - Part II
Introduction to prediction modelling - Berlin 2018 - Part II
Maarten van Smeden
 
Str-AI-ght to heaven? Pitfalls for clinical decision support based on AI
Str-AI-ght to heaven? Pitfalls for clinical decision support based on AIStr-AI-ght to heaven? Pitfalls for clinical decision support based on AI
Str-AI-ght to heaven? Pitfalls for clinical decision support based on AI
BenVanCalster
 

What's hot (20)

Hypothesis Testing: Proportions (Compare 1:Standard)
Hypothesis Testing: Proportions (Compare 1:Standard)Hypothesis Testing: Proportions (Compare 1:Standard)
Hypothesis Testing: Proportions (Compare 1:Standard)
 
Hypothesis Testing: Relationships (Compare 1:1)
Hypothesis Testing: Relationships (Compare 1:1)Hypothesis Testing: Relationships (Compare 1:1)
Hypothesis Testing: Relationships (Compare 1:1)
 
Hypothesis Testing: Central Tendency – Non-Normal (Compare 1:Standard)
Hypothesis Testing: Central Tendency – Non-Normal (Compare 1:Standard)Hypothesis Testing: Central Tendency – Non-Normal (Compare 1:Standard)
Hypothesis Testing: Central Tendency – Non-Normal (Compare 1:Standard)
 
Hypothesis Testing: Central Tendency – Non-Normal (Compare 2+ Factors)
Hypothesis Testing: Central Tendency – Non-Normal (Compare 2+ Factors)Hypothesis Testing: Central Tendency – Non-Normal (Compare 2+ Factors)
Hypothesis Testing: Central Tendency – Non-Normal (Compare 2+ Factors)
 
Machine learning in medicine: calm down
Machine learning in medicine: calm downMachine learning in medicine: calm down
Machine learning in medicine: calm down
 
Tree Based Uplift Modeling
Tree Based Uplift ModelingTree Based Uplift Modeling
Tree Based Uplift Modeling
 
The basics of prediction modeling
The basics of prediction modeling The basics of prediction modeling
The basics of prediction modeling
 
How to establish and evaluate clinical prediction models - Statswork
How to establish and evaluate clinical prediction models - StatsworkHow to establish and evaluate clinical prediction models - Statswork
How to establish and evaluate clinical prediction models - Statswork
 
Development and evaluation of prediction models: pitfalls and solutions (Part...
Development and evaluation of prediction models: pitfalls and solutions (Part...Development and evaluation of prediction models: pitfalls and solutions (Part...
Development and evaluation of prediction models: pitfalls and solutions (Part...
 
6.hypothesistesting.06
6.hypothesistesting.066.hypothesistesting.06
6.hypothesistesting.06
 
Why the EPV≥10 sample size rule is rubbish and what to use instead
Why the EPV≥10 sample size rule is rubbish and what to use instead Why the EPV≥10 sample size rule is rubbish and what to use instead
Why the EPV≥10 sample size rule is rubbish and what to use instead
 
1120 track2 bennett
1120 track2 bennett1120 track2 bennett
1120 track2 bennett
 
Decision analysis part iii
Decision analysis part iiiDecision analysis part iii
Decision analysis part iii
 
Hypothesis Testing: Statistical Laws and Confidence Intervals
Hypothesis Testing: Statistical Laws and Confidence IntervalsHypothesis Testing: Statistical Laws and Confidence Intervals
Hypothesis Testing: Statistical Laws and Confidence Intervals
 
Absence of a gold standard in diagnostic test accuracy research
Absence of a gold standard in diagnostic test accuracy researchAbsence of a gold standard in diagnostic test accuracy research
Absence of a gold standard in diagnostic test accuracy research
 
Forecast value-added-analysis-106186
Forecast value-added-analysis-106186Forecast value-added-analysis-106186
Forecast value-added-analysis-106186
 
Hypothesis Testing: Central Tendency – Normal (Compare 1:1)
Hypothesis Testing: Central Tendency – Normal (Compare 1:1)Hypothesis Testing: Central Tendency – Normal (Compare 1:1)
Hypothesis Testing: Central Tendency – Normal (Compare 1:1)
 
Hypothesis Testing: Central Tendency – Normal (Compare 1:Standard)
Hypothesis Testing: Central Tendency – Normal (Compare 1:Standard)Hypothesis Testing: Central Tendency – Normal (Compare 1:Standard)
Hypothesis Testing: Central Tendency – Normal (Compare 1:Standard)
 
Introduction to prediction modelling - Berlin 2018 - Part II
Introduction to prediction modelling - Berlin 2018 - Part IIIntroduction to prediction modelling - Berlin 2018 - Part II
Introduction to prediction modelling - Berlin 2018 - Part II
 
Str-AI-ght to heaven? Pitfalls for clinical decision support based on AI
Str-AI-ght to heaven? Pitfalls for clinical decision support based on AIStr-AI-ght to heaven? Pitfalls for clinical decision support based on AI
Str-AI-ght to heaven? Pitfalls for clinical decision support based on AI
 

Similar to Basic Analytics Module for Sponsors

APPLICATION OF TOOLS OF QUALITY IN ENGINEERING EDUCATION
APPLICATION OF TOOLS OF QUALITY IN ENGINEERING EDUCATIONAPPLICATION OF TOOLS OF QUALITY IN ENGINEERING EDUCATION
APPLICATION OF TOOLS OF QUALITY IN ENGINEERING EDUCATIONSyed Raza Imam
 
Descriptive Statistics
Descriptive StatisticsDescriptive Statistics
Descriptive Statistics
CIToolkit
 
Descriptive Statistics, Numerical Description
Descriptive Statistics, Numerical DescriptionDescriptive Statistics, Numerical Description
Descriptive Statistics, Numerical Description
getyourcheaton
 
Presentation of Project and Critique.pptx
Presentation of Project and Critique.pptxPresentation of Project and Critique.pptx
Presentation of Project and Critique.pptx
BillyMoses1
 
Seven tools of quality control.slideshare
Seven tools of quality control.slideshareSeven tools of quality control.slideshare
Seven tools of quality control.slideshare
raiaryan448
 
process monitoring (statistical process control)
process monitoring (statistical process control)process monitoring (statistical process control)
process monitoring (statistical process control)
Bindutesh Saner
 
A/B Testing - Design, Analysis and Pitfals
A/B Testing - Design, Analysis and PitfalsA/B Testing - Design, Analysis and Pitfals
A/B Testing - Design, Analysis and PitfalsSlava Borodovsky
 
UM20BB151 Business Stats - Consolidated.pptx
UM20BB151 Business Stats - Consolidated.pptxUM20BB151 Business Stats - Consolidated.pptx
UM20BB151 Business Stats - Consolidated.pptx
ChristopherDevakumar1
 
Statistical Process Control
Statistical Process ControlStatistical Process Control
Statistical Process Control
Nicola Mezzetti
 
Statistical quality control, sampling
Statistical quality control, samplingStatistical quality control, sampling
Statistical quality control, sampling
Sana Fatima
 
Engineering Data Analysis-ProfCharlton
Engineering Data  Analysis-ProfCharltonEngineering Data  Analysis-ProfCharlton
Engineering Data Analysis-ProfCharlton
CharltonInao1
 
Basic Statistics for Paid Search Advertising
Basic Statistics for Paid Search AdvertisingBasic Statistics for Paid Search Advertising
Basic Statistics for Paid Search Advertising
Nina Estenzo
 
7qctools173-100325112603-phpapp01.ppt
7qctools173-100325112603-phpapp01.ppt7qctools173-100325112603-phpapp01.ppt
7qctools173-100325112603-phpapp01.ppt
Oswaldo Gonzales
 
data analysis in Statistics-2023 guide 2023
data analysis in Statistics-2023 guide 2023data analysis in Statistics-2023 guide 2023
data analysis in Statistics-2023 guide 2023
ayesha455941
 
Introduction.pptx
Introduction.pptxIntroduction.pptx
Introduction.pptx
Vishal543707
 
Spc
SpcSpc
Lecture 7 guidelines_and_assignment
Lecture 7 guidelines_and_assignmentLecture 7 guidelines_and_assignment
Lecture 7 guidelines_and_assignmentDaria Bogdanova
 
Lecture 3 Statistical ProcessControl (SPC).docx
Lecture 3 Statistical ProcessControl (SPC).docxLecture 3 Statistical ProcessControl (SPC).docx
Lecture 3 Statistical ProcessControl (SPC).docx
smile790243
 

Similar to Basic Analytics Module for Sponsors (20)

APPLICATION OF TOOLS OF QUALITY IN ENGINEERING EDUCATION
APPLICATION OF TOOLS OF QUALITY IN ENGINEERING EDUCATIONAPPLICATION OF TOOLS OF QUALITY IN ENGINEERING EDUCATION
APPLICATION OF TOOLS OF QUALITY IN ENGINEERING EDUCATION
 
Descriptive Statistics
Descriptive StatisticsDescriptive Statistics
Descriptive Statistics
 
Descriptive Statistics, Numerical Description
Descriptive Statistics, Numerical DescriptionDescriptive Statistics, Numerical Description
Descriptive Statistics, Numerical Description
 
Presentation of Project and Critique.pptx
Presentation of Project and Critique.pptxPresentation of Project and Critique.pptx
Presentation of Project and Critique.pptx
 
Seven tools of quality control.slideshare
Seven tools of quality control.slideshareSeven tools of quality control.slideshare
Seven tools of quality control.slideshare
 
process monitoring (statistical process control)
process monitoring (statistical process control)process monitoring (statistical process control)
process monitoring (statistical process control)
 
A/B Testing - Design, Analysis and Pitfals
A/B Testing - Design, Analysis and PitfalsA/B Testing - Design, Analysis and Pitfals
A/B Testing - Design, Analysis and Pitfals
 
UM20BB151 Business Stats - Consolidated.pptx
UM20BB151 Business Stats - Consolidated.pptxUM20BB151 Business Stats - Consolidated.pptx
UM20BB151 Business Stats - Consolidated.pptx
 
Statistical Process Control
Statistical Process ControlStatistical Process Control
Statistical Process Control
 
Econ stat1
Econ stat1Econ stat1
Econ stat1
 
Statistical quality control, sampling
Statistical quality control, samplingStatistical quality control, sampling
Statistical quality control, sampling
 
Engineering Data Analysis-ProfCharlton
Engineering Data  Analysis-ProfCharltonEngineering Data  Analysis-ProfCharlton
Engineering Data Analysis-ProfCharlton
 
Training Module
Training ModuleTraining Module
Training Module
 
Basic Statistics for Paid Search Advertising
Basic Statistics for Paid Search AdvertisingBasic Statistics for Paid Search Advertising
Basic Statistics for Paid Search Advertising
 
7qctools173-100325112603-phpapp01.ppt
7qctools173-100325112603-phpapp01.ppt7qctools173-100325112603-phpapp01.ppt
7qctools173-100325112603-phpapp01.ppt
 
data analysis in Statistics-2023 guide 2023
data analysis in Statistics-2023 guide 2023data analysis in Statistics-2023 guide 2023
data analysis in Statistics-2023 guide 2023
 
Introduction.pptx
Introduction.pptxIntroduction.pptx
Introduction.pptx
 
Spc
SpcSpc
Spc
 
Lecture 7 guidelines_and_assignment
Lecture 7 guidelines_and_assignmentLecture 7 guidelines_and_assignment
Lecture 7 guidelines_and_assignment
 
Lecture 3 Statistical ProcessControl (SPC).docx
Lecture 3 Statistical ProcessControl (SPC).docxLecture 3 Statistical ProcessControl (SPC).docx
Lecture 3 Statistical ProcessControl (SPC).docx
 

Basic Analytics Module for Sponsors

  • 1. Action plan and SOP for Special Cause Variation Determine new Goals (UCL, LCL)
  • 2. Module 8: Basic Analytics Welcome to Champion Training Facilitated by Kaplan’s Process Improvement Team
  • 3. Agenda of Champion Training Modules # Module # Pages 1 Introduction 19 2 Project Selection and Engaging Process Improvement 22 3 Champion Role through Project Lifecycle 26 4 Calculating Financial Benefit/ the Cost of Poor Quality 13 5 Define Overview & Tools 26 6 Measure Overview & Tools 27 7 Analyze Overview & Tools 18 8 Basic Analytics 21 9 Improve Overview & Tools 33 10 Control Overview & Tools 28 11 How to Effectuate Change Using Change Management 31 12 Kaplan’s Work Out 15
  • 4. Purpose of This Training Provide Kaplan champions with the knowledge and skills to be effective leaders and coaches to their people engaged in Process Improvement/Six Sigma projects “Everything should be made as simple as possible, but not too simple.” Albert Einstein
  • 5. Types of Statistics Descriptive Statistics are used to describe the basic features of the data in a study. They provide simple summaries about the sample and the measures. Together with simple graphics analysis, they form the basis of virtually every quantitative analysis of data. With descriptive statistics you are simply describing what is, what the data shows. Inferential Statistics investigate questions, models and hypotheses. In many cases, the conclusions from inferential statistics extend beyond the immediate data alone. For instance, we use inferential statistics to try to infer from the sample data what the population thinks. Or, we use inferential statistics to make judgments of the probability that an observed difference between groups is a dependable one or one that might have happened by chance in this study. Thus, we use inferential statistics to make inferences from our data to more general conditions; we use descriptive statistics simply to describe what's going on in our data.
  • 6. Monitor Descriptive Statistics Monitor performance of the Xs and Ys over time Verify that the improvement actions on the Xs have made the desired improvement in the Y Mean, Median, Mode Standard Deviation
  • 7. Numeric Display Terms • The number of data points with non-missing values in the data set.N • The Average Mean (Arithmetic Mean) • The middle data point in the data set.Median (50th Percentile) • The Value that occurs the most frequently in a data set.Mode • The average distance from the mean.StDev (Standard Deviation) • The highest value form the lowest 25% of the ranked data. Q1 (First Quartile or 25th Percentile) • The lowest value from the highest 25% of the ranked data. Q3 (Third Quartile or 75th Percentile)
  • 8. Defects • A DEFECT is failure to conform to customer requirements • DEFECTIVE is when an entire unit fails to meet acceptance criteria, regardless of the number of defects within the unit. Defective Defect Defective
  • 9. How to Calculate Sigma 3.4 5 8 10 20 30 40 70 100 150 230 330 480 680 960 1,350 1,860 2,550 3,460 4,660 6,210 8,190 10,700 13,900 17,800 22,700 28,700 35,900 44,600 54,800 66,800 80,800 96,800 115,000 135,000 158,000 184,000 212,000 242,000 274,000 308,000 344,000 382,000 420,000 460,000 500,000 540,000 0.34 0.5 0.8 1 2 3 4 7 10 15 23 33 48 68 96 135 186 255 346 466 621 819 1,070 1,390 1,780 2,270 2,870 3,590 4,460 5,480 6,680 8,080 9,680 11,500 13,500 15,800 18,400 21,200 24,200 27,400 30,800 34,400 38,200 42,000 46,000 50,000 54,000 0.034 0.05 0.08 0.1 0.2 0.3 0.4 0.7 1.0 1.5 2.3 3.3 4.8 6.8 9.6 13.5 18.6 25.5 34.6 46.6 62.1 81.9 107 139 178 227 287 359 446 548 668 808 968 1,150 1,350 1,580 1,840 2,120 2,420 2,740 3,080 3,440 3,820 4,200 4,600 5,000 5,400 0.0034 0.005 0.008 0.01 0.02 0.03 0.04 0.07 0.1 0.15 0.23 0.33 0.48 0.68 0.96 1.35 1.86 2.55 3.46 4.66 6.21 8.19 10.7 13.9 17.8 22.7 28.7 35.9 44.6 54.8 66.8 80.8 96.8 115 135 158 184 212 242 274 308 344 382 420 460 500 540 0.00034 0.0005 0.0008 0.001 0.002 0.003 0.004 0.007 0.01 0.015 0.023 0.033 0.048 0.068 0.096 0.135 0.186 0.255 0.346 0.466 0.621 0.819 1.07 1.39 1.78 2.27 2.87 3.59 4.46 5.48 6.68 8.08 9.68 11.5 13.5 15.8 18.4 21.2 24.2 27.4 30.8 34.4 38.2 42 46 50 54 99.99966% 99.9995% 99.9992% 99.9990% 99.9980% 99.9970% 99.9960% 99.9930% 99.9900% 99.9850% 99.9770% 99.9670% 99.9520% 99.9320% 99.9040% 99.8650% 99.8140% 99.7450% 99.6540% 99.5340% 99.3790% 99.1810% 98.930% 98.610% 98.220% 97.730% 97.130% 96.410% 95.540% 94.520% 93.320% 91.920% 90.320% 88.50% 86.50% 84.20% 81.60% 78.80% 75.80% 72.60% 69.20% 65.60% 61.80% 58.00% 54.00% 50% 46% 6.0 5.9 5.8 5.7 5.6 5.5 5.4 5.3 5.2 5.1 5.0 4.9 4.8 4.7 4.6 4.5 4.4 4.3 4.2 4.1 4.0 3.9 3.8 3.7 3.6 3.5 3.4 3.3 3.2 3.1 3.0 2.9 2.8 2.7 2.6 2.5 2.4 2.3 2.2 2.1 2.0 1.9 1.8 1.7 1.6 1.5 1.4 Long-Term Yield ST Process Sigma Defects Per 1,000,000 Defects Per 100,000 Defects Per 10,000 Defects Per 1,000 Defects Per 100 3.4 5 8 10 20 30 40 70 100 150 230 330 480 680 960 1,350 1,860 2,550 3,460 4,660 6,210 8,190 10,700 13,900 17,800 22,700 28,700 35,900 44,600 54,800 66,800 80,800 96,800 115,000 135,000 158,000 184,000 212,000 242,000 274,000 308,000 344,000 382,000 420,000 460,000 500,000 540,000 0.34 0.5 0.8 1 2 3 4 7 10 15 23 33 48 68 96 135 186 255 346 466 621 819 1,070 1,390 1,780 2,270 2,870 3,590 4,460 5,480 6,680 8,080 9,680 11,500 13,500 15,800 18,400 21,200 24,200 27,400 30,800 34,400 38,200 42,000 46,000 50,000 54,000 0.034 0.05 0.08 0.1 0.2 0.3 0.4 0.7 1.0 1.5 2.3 3.3 4.8 6.8 9.6 13.5 18.6 25.5 34.6 46.6 62.1 81.9 107 139 178 227 287 359 446 548 668 808 968 1,150 1,350 1,580 1,840 2,120 2,420 2,740 3,080 3,440 3,820 4,200 4,600 5,000 5,400 0.0034 0.005 0.008 0.01 0.02 0.03 0.04 0.07 0.1 0.15 0.23 0.33 0.48 0.68 0.96 1.35 1.86 2.55 3.46 4.66 6.21 8.19 10.7 13.9 17.8 22.7 28.7 35.9 44.6 54.8 66.8 80.8 96.8 115 135 158 184 212 242 274 308 344 382 420 460 500 540 0.00034 0.0005 0.0008 0.001 0.002 0.003 0.004 0.007 0.01 0.015 0.023 0.033 0.048 0.068 0.096 0.135 0.186 0.255 0.346 0.466 0.621 0.819 1.07 1.39 1.78 2.27 2.87 3.59 4.46 5.48 6.68 8.08 9.68 11.5 13.5 15.8 18.4 21.2 24.2 27.4 30.8 34.4 38.2 42 46 50 54 99.99966% 99.9995% 99.9992% 99.9990% 99.9980% 99.9970% 99.9960% 99.9930% 99.9900% 99.9850% 99.9770% 99.9670% 99.9520% 99.9320% 99.9040% 99.8650% 99.8140% 99.7450% 99.6540% 99.5340% 99.3790% 99.1810% 98.930% 98.610% 98.220% 97.730% 97.130% 96.410% 95.540% 94.520% 93.320% 91.920% 90.320% 88.50% 86.50% 84.20% 81.60% 78.80% 75.80% 72.60% 69.20% 65.60% 61.80% 58.00% 54.00% 50% 46% 6.0 5.9 5.8 5.7 5.6 5.5 5.4 5.3 5.2 5.1 5.0 4.9 4.8 4.7 4.6 4.5 4.4 4.3 4.2 4.1 4.0 3.9 3.8 3.7 3.6 3.5 3.4 3.3 3.2 3.1 3.0 2.9 2.8 2.7 2.6 2.5 2.4 2.3 2.2 2.1 2.0 1.9 1.8 1.7 1.6 1.5 1.4 Long-Term Yield ST Process Sigma Defects Per 1,000,000 Defects Per 100,000 Defects Per 10,000 Defects Per 1,000 Defects Per 100 3.4 5 8 10 20 30 40 70 100 150 230 330 480 680 960 1,350 1,860 2,550 3,460 4,660 6,210 8,190 10,700 13,900 17,800 22,700 28,700 35,900 44,600 54,800 66,800 80,800 96,800 115,000 135,000 158,000 184,000 212,000 242,000 274,000 308,000 344,000 382,000 420,000 460,000 500,000 540,000 0.34 0.5 0.8 1 2 3 4 7 10 15 23 33 48 68 96 135 186 255 346 466 621 819 1,070 1,390 1,780 2,270 2,870 3,590 4,460 5,480 6,680 8,080 9,680 11,500 13,500 15,800 18,400 21,200 24,200 27,400 30,800 34,400 38,200 42,000 46,000 50,000 54,000 0.034 0.05 0.08 0.1 0.2 0.3 0.4 0.7 1.0 1.5 2.3 3.3 4.8 6.8 9.6 13.5 18.6 25.5 34.6 46.6 62.1 81.9 107 139 178 227 287 359 446 548 668 808 968 1,150 1,350 1,580 1,840 2,120 2,420 2,740 3,080 3,440 3,820 4,200 4,600 5,000 5,400 0.0034 0.005 0.008 0.01 0.02 0.03 0.04 0.07 0.1 0.15 0.23 0.33 0.48 0.68 0.96 1.35 1.86 2.55 3.46 4.66 6.21 8.19 10.7 13.9 17.8 22.7 28.7 35.9 44.6 54.8 66.8 80.8 96.8 115 135 158 184 212 242 274 308 344 382 420 460 500 540 0.00034 0.0005 0.0008 0.001 0.002 0.003 0.004 0.007 0.01 0.015 0.023 0.033 0.048 0.068 0.096 0.135 0.186 0.255 0.346 0.466 0.621 0.819 1.07 1.39 1.78 2.27 2.87 3.59 4.46 5.48 6.68 8.08 9.68 11.5 13.5 15.8 18.4 21.2 24.2 27.4 30.8 34.4 38.2 42 46 50 54 99.99966% 99.9995% 99.9992% 99.9990% 99.9980% 99.9970% 99.9960% 99.9930% 99.9900% 99.9850% 99.9770% 99.9670% 99.9520% 99.9320% 99.9040% 99.8650% 99.8140% 99.7450% 99.6540% 99.5340% 99.3790% 99.1810% 98.930% 98.610% 98.220% 97.730% 97.130% 96.410% 95.540% 94.520% 93.320% 91.920% 90.320% 88.50% 86.50% 84.20% 81.60% 78.80% 75.80% 72.60% 69.20% 65.60% 61.80% 58.00% 54.00% 50% 46% 6.0 5.9 5.8 5.7 5.6 5.5 5.4 5.3 5.2 5.1 5.0 4.9 4.8 4.7 4.6 4.5 4.4 4.3 4.2 4.1 4.0 3.9 3.8 3.7 3.6 3.5 3.4 3.3 3.2 3.1 3.0 2.9 2.8 2.7 2.6 2.5 2.4 2.3 2.2 2.1 2.0 1.9 1.8 1.7 1.6 1.5 1.4 Long-Term Yield ST Process Sigma Defects Per 1,000,000 Defects Per 100,000 Defects Per 10,000 Defects Per 1,000 Defects Per 100 Long-Term Yield ST Process Sigma Defects Per 1,000,000 Defects Per 100,000 Defects Per 10,000 Defects Per 1,000 Defects Per 100 A KU student expected to speak in person to their Financial Aid Officer every time they contact the FAO. 500 Defects = 100,000 Defects Per 5000 Opportunities Million Opportunities 2.8 Sigma A DEFECT is any time that the customers’ requirement is not met.
  • 10. Shift The Mean And Reduce Variation Calculate new process capability after implementing the improvement or design Determine if the new process capability (process sigma) meets stated goals See if you achieved the desired shift, variance reduction, or DPMO reduction
  • 11. Sigma and Normal Distribution As you can see, the curve is divided into a series of equal increments, each representing one standard deviation from the mean.
  • 12. Histogram 100806040200-20 25 20 15 10 5 0 DAYS Frequency Mean 29.41 StDev 24.45 N 68 Days it Takes for FAO to Return calls Spec Limit is 5 days maximum
  • 13. Causes for Greenbelts Not Completing Project 55 25 8 6 3 3 Not enough time Sponsor does not understand value Did not pass exam Unclear of what needed to be done on template Lost template Office closed for a month 55% 80% 88% 94% 100%97% Causes CumulativePercent
  • 14. Central Limit Theorem http://www.intuitor.com/statistics/CentralLim.html If a random sample is drawn from any population, the sampling distribution of the sample mean is approximately normal for a sufficiently large sample size. The larger the sample size, the more closely the sampling distribution of the sample mean will resemble a normal distribution 1 3 15 30
  • 15. Yields Rolled Throughput Yield Receive request for Financial Aid 45,000 DPMO wasted Step 1 in Financial Aid 28,650 DPMO wasted Step 2 in Awarding Financial Aid 51,876 DPMO wasted Financial Aid Awarded Right First Time 125,526 DPMO wasted opportunities 95.5% Yield (YTP) 97% Yield (YTP) 94.4% Yield (YTP) Yields can be multiplied with many process steps. Assumes independent sources of defects. YRT = .955*.97*.944 = 87.5%
  • 16. Correlations are not Necessarily Causal • City of Oldenburg, Germany • 1930- 1936 • X-axis: stork population • Y-axis: human population What your mother told you about babies when you were three is still not right, despite the strong correlation “evidence”. Causal means that one variable results in the other thing occurring. In general, it is extremely difficult to establish causality between two correlated events or observances. There are many statistical tools to establish a statistical significant correlation. Source: Box, Hunter, hunter Statistics For Experiments 1978
  • 17. Regression Regression can be used for prediction, inference, hypothesis testing, and modeling of causal relationships The procedure calculates estimates of the relationship between the independent variables (advertising, price, etc.) and the dependent variable (sales). Simple Linear Regression Analysis: Y = b0 + b1X
  • 18. The Control Chart or Shewhart Chart Observation IndividualValue 28252219161310741 60 50 40 30 20 10 0 _ X=29.06 UCL=55.24 LCL=2.87 1 Control Chart of Recycle Process Center (usually the Mean) Special Cause Variation Detected Control Limits Common Cause Variation
  • 19. Common Distributions Sample size - Normal Distributions • As the number of samples measured increases, to 30, the distribution becomes more representative of the population. Population sample NORMAL DISTRIBUTION’S IMPORTANCE Most variables are approximately normally distributed. This means we can use the normal distribution as a model to help us better understand these variables. NORMALITY TESTS Normality tests are used to determine if any group of data fits a standard normal distribution
  • 20. Confirm New Capability Calculate new process capability Determine if the new process sigma meets stated goals
  • 21. Action plan and SOP for Special Cause Variation Determine new Goals (UCL, LCL)
  • 22. Module Wrap Up •Questions/Comments •Discussions of Process Improvement Projects in Your Area •Discuss Next Module •Establish Time/Date of Next Meeting