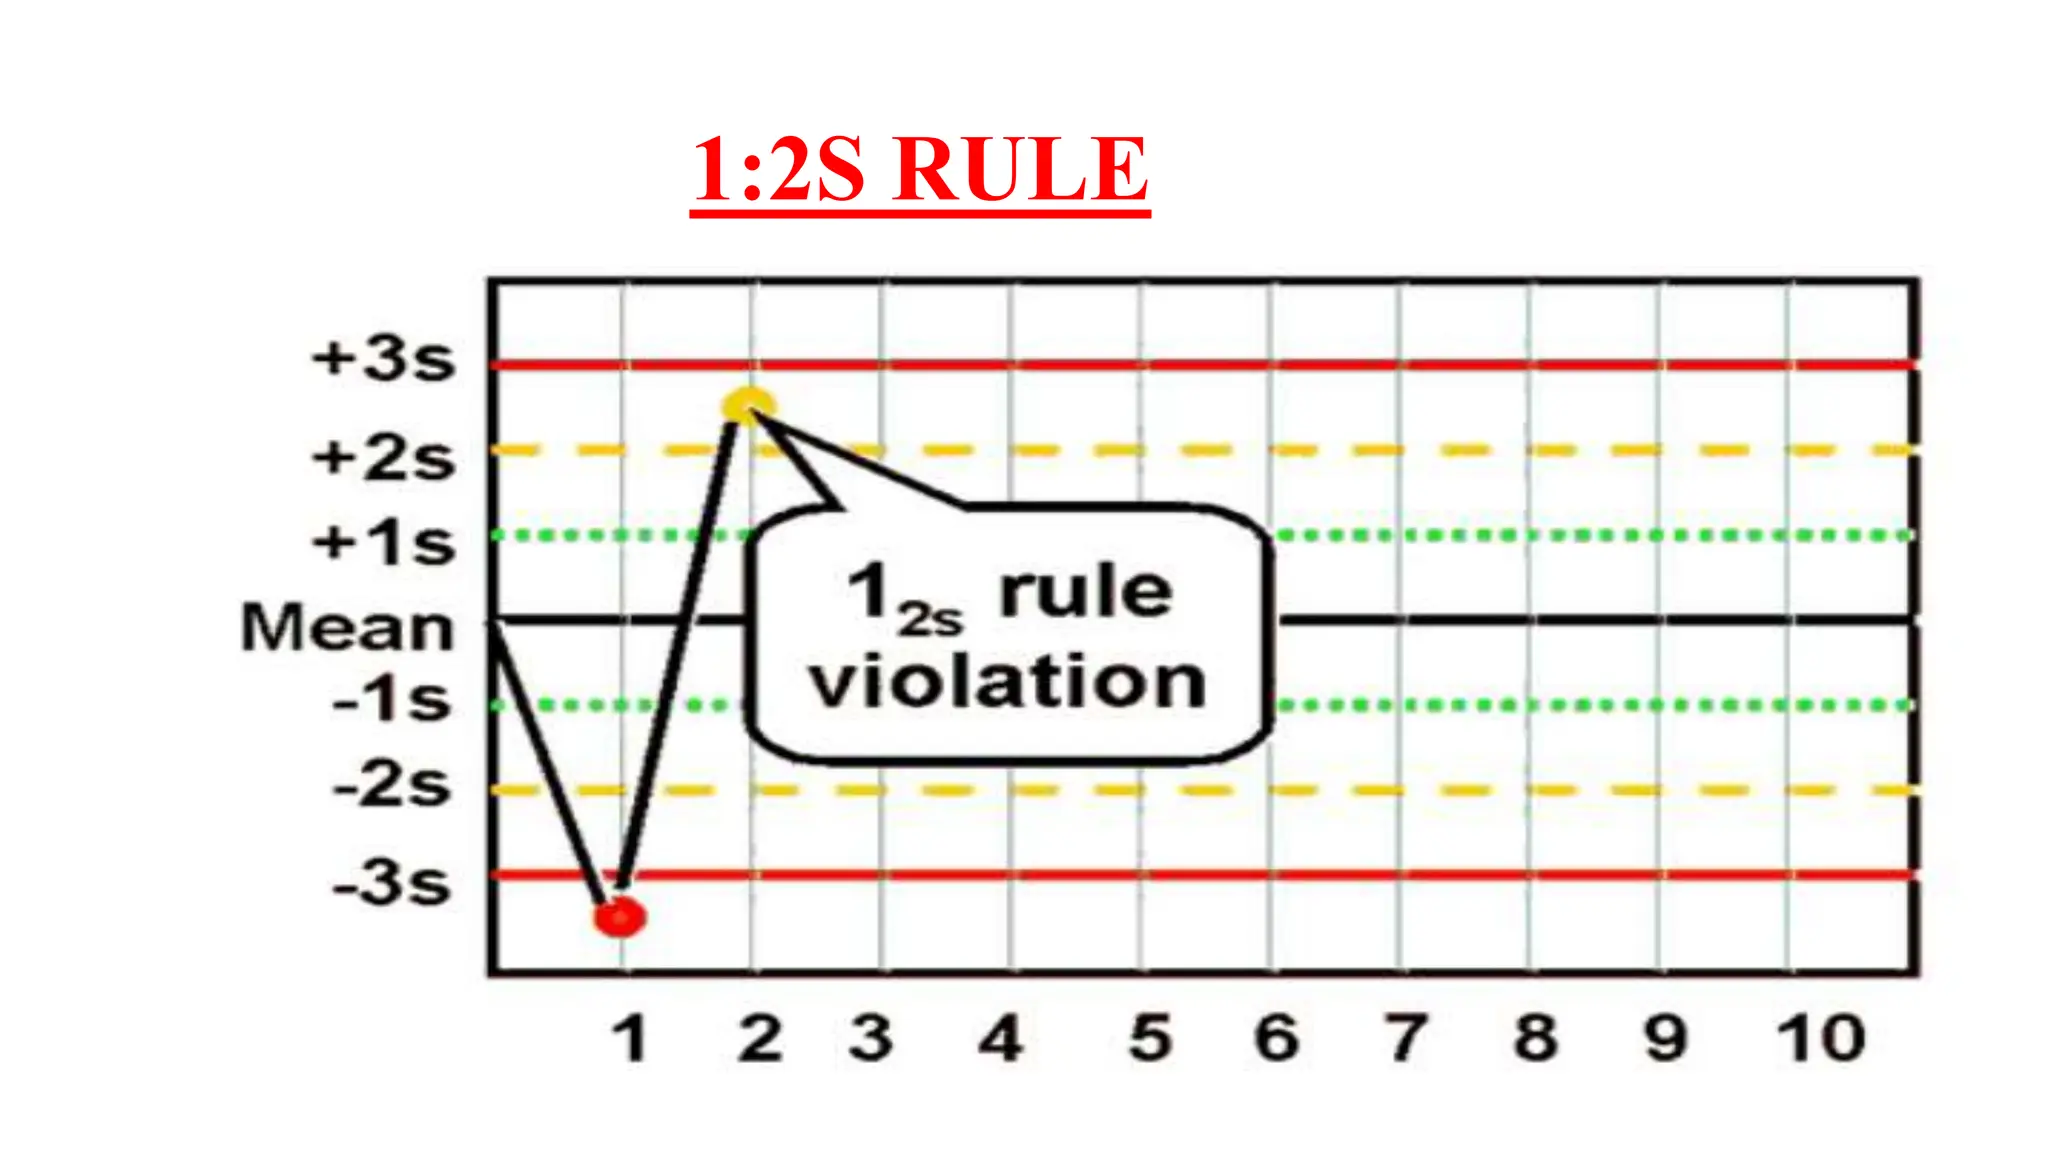
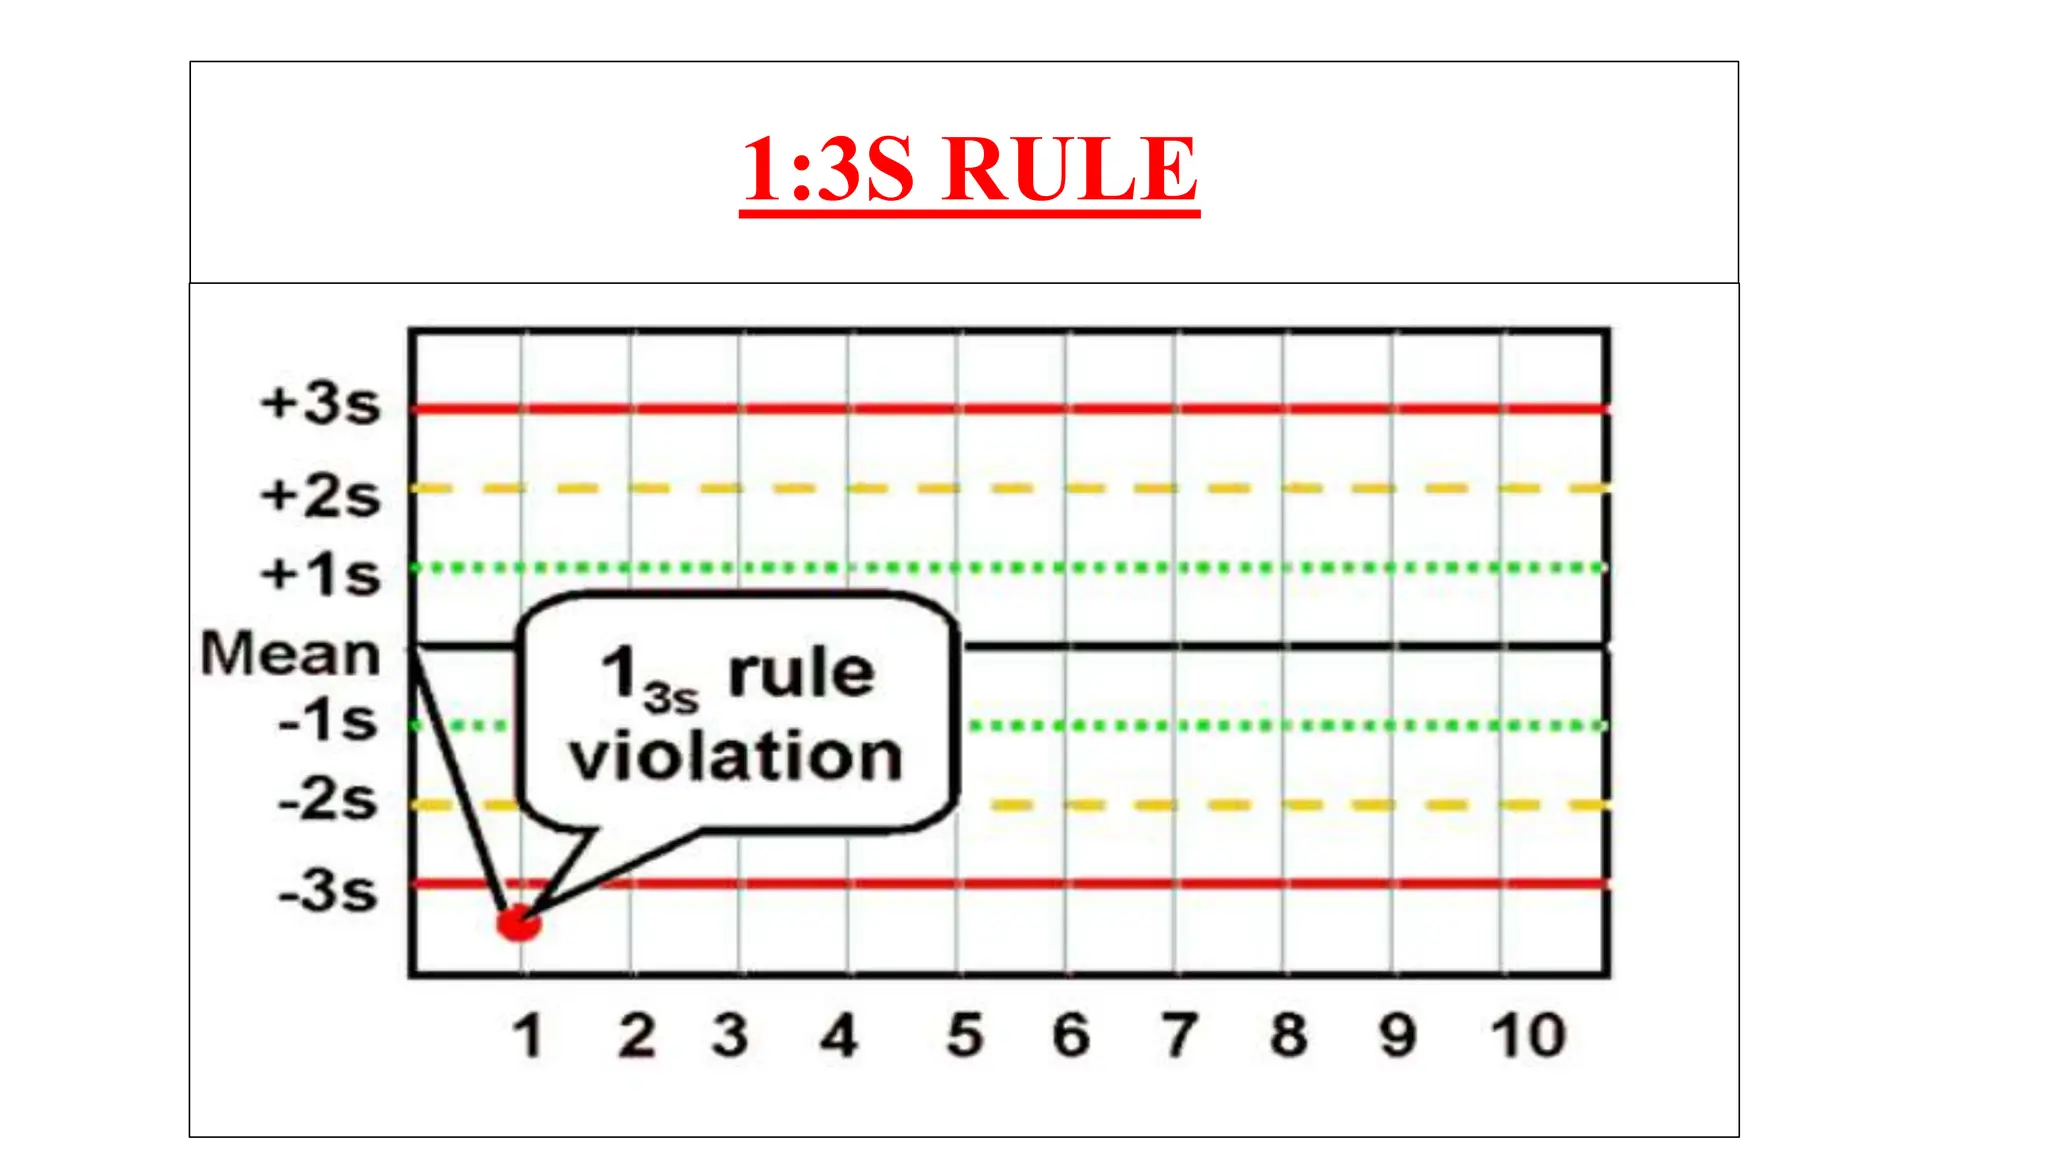
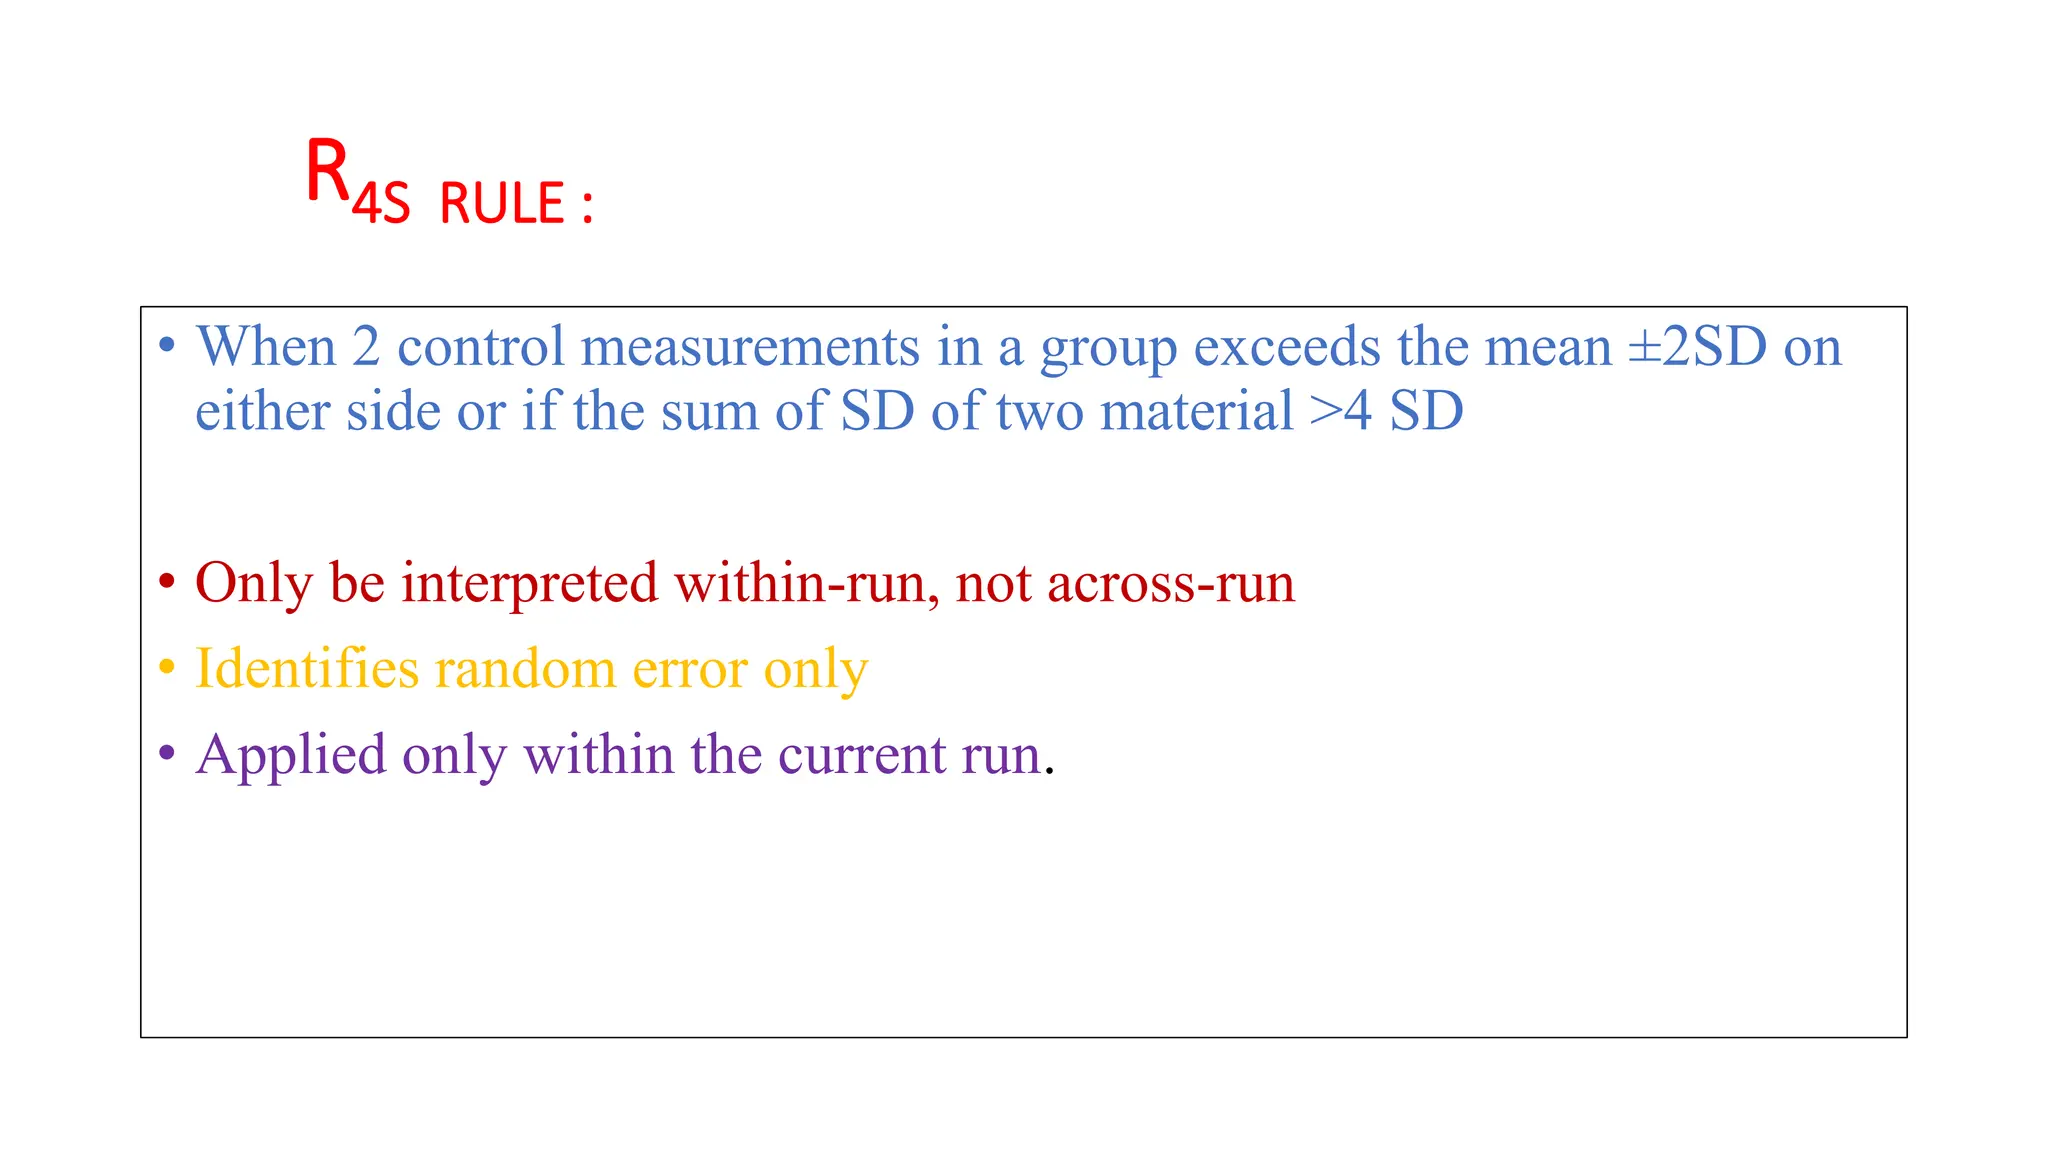
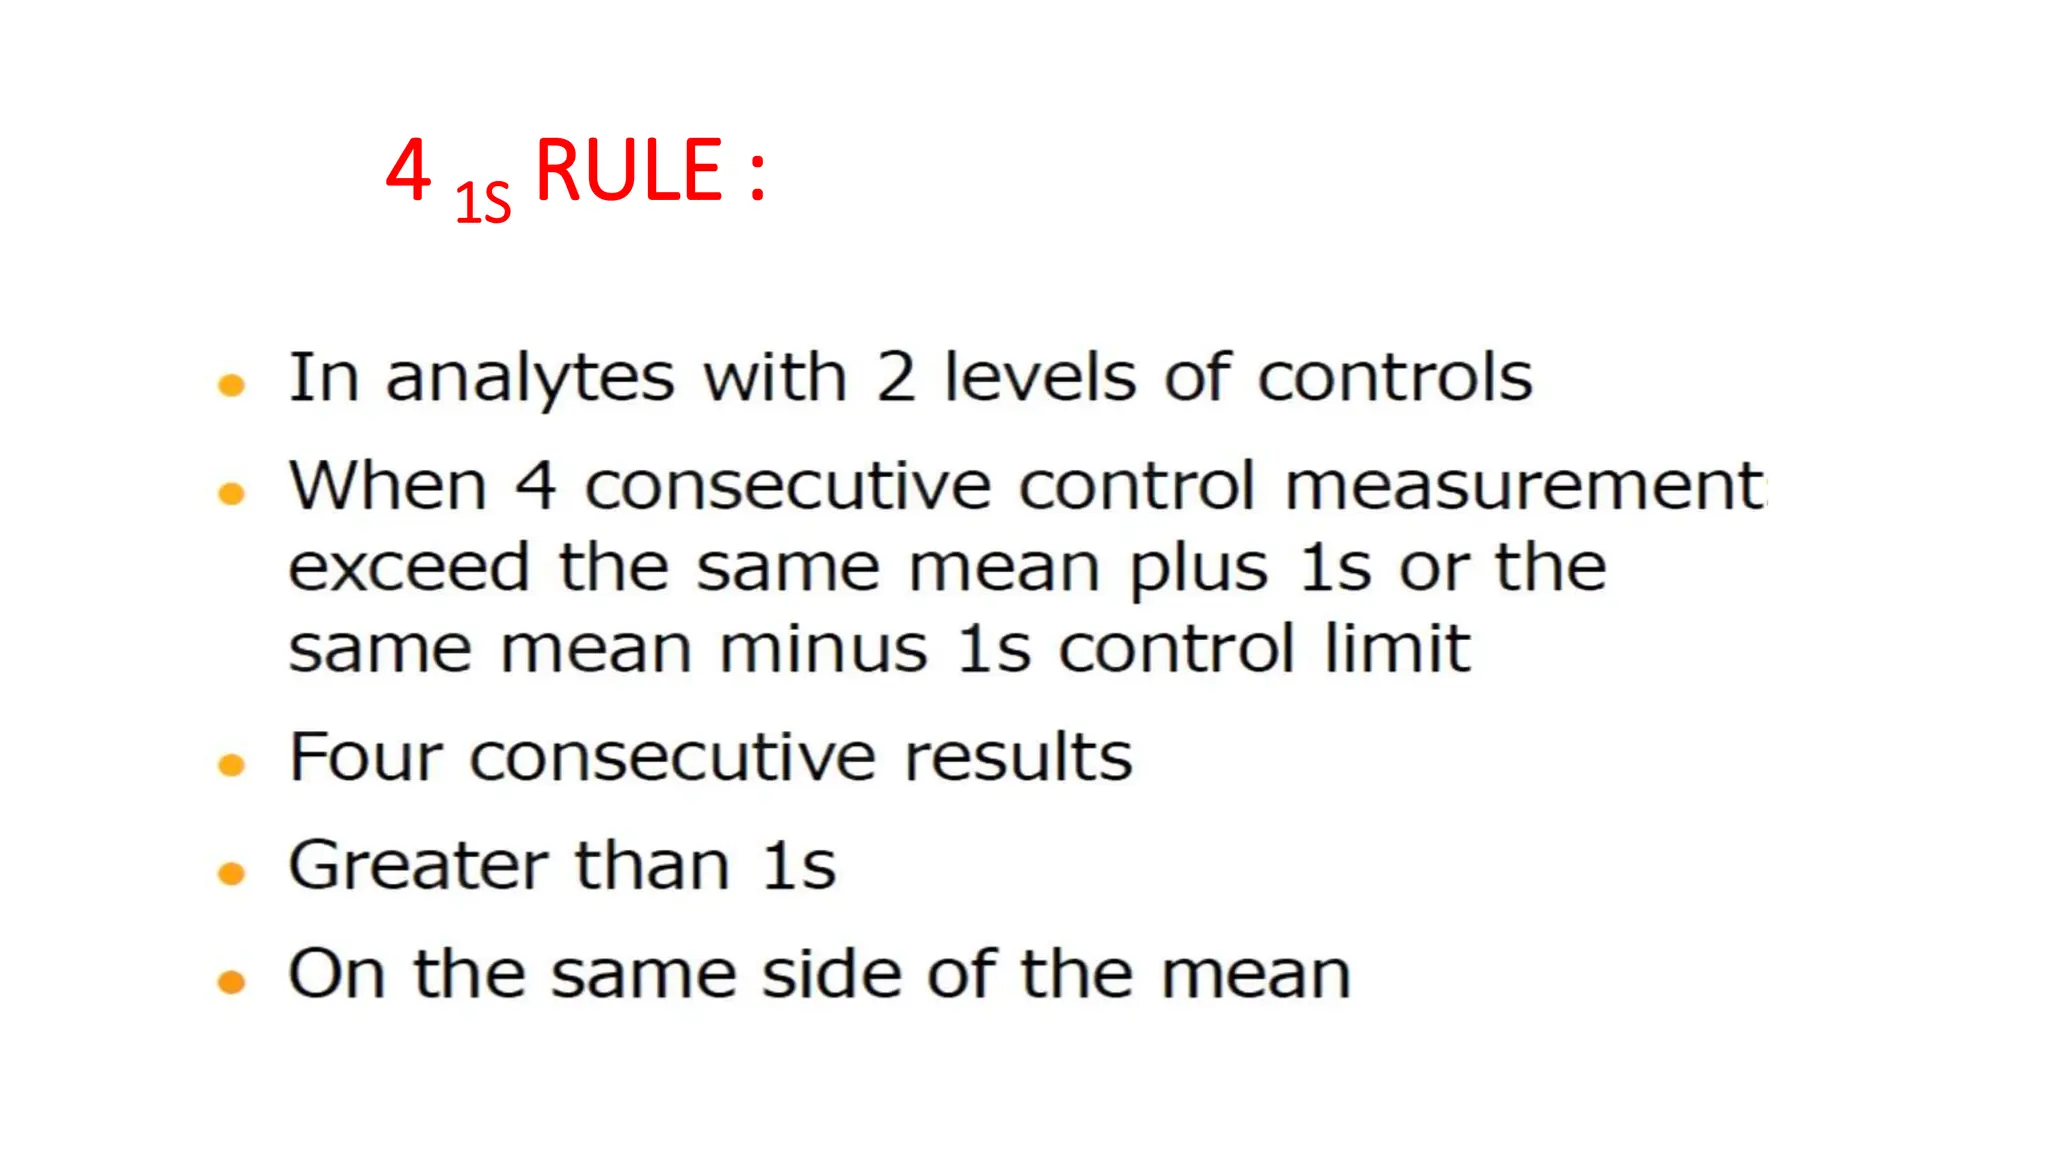
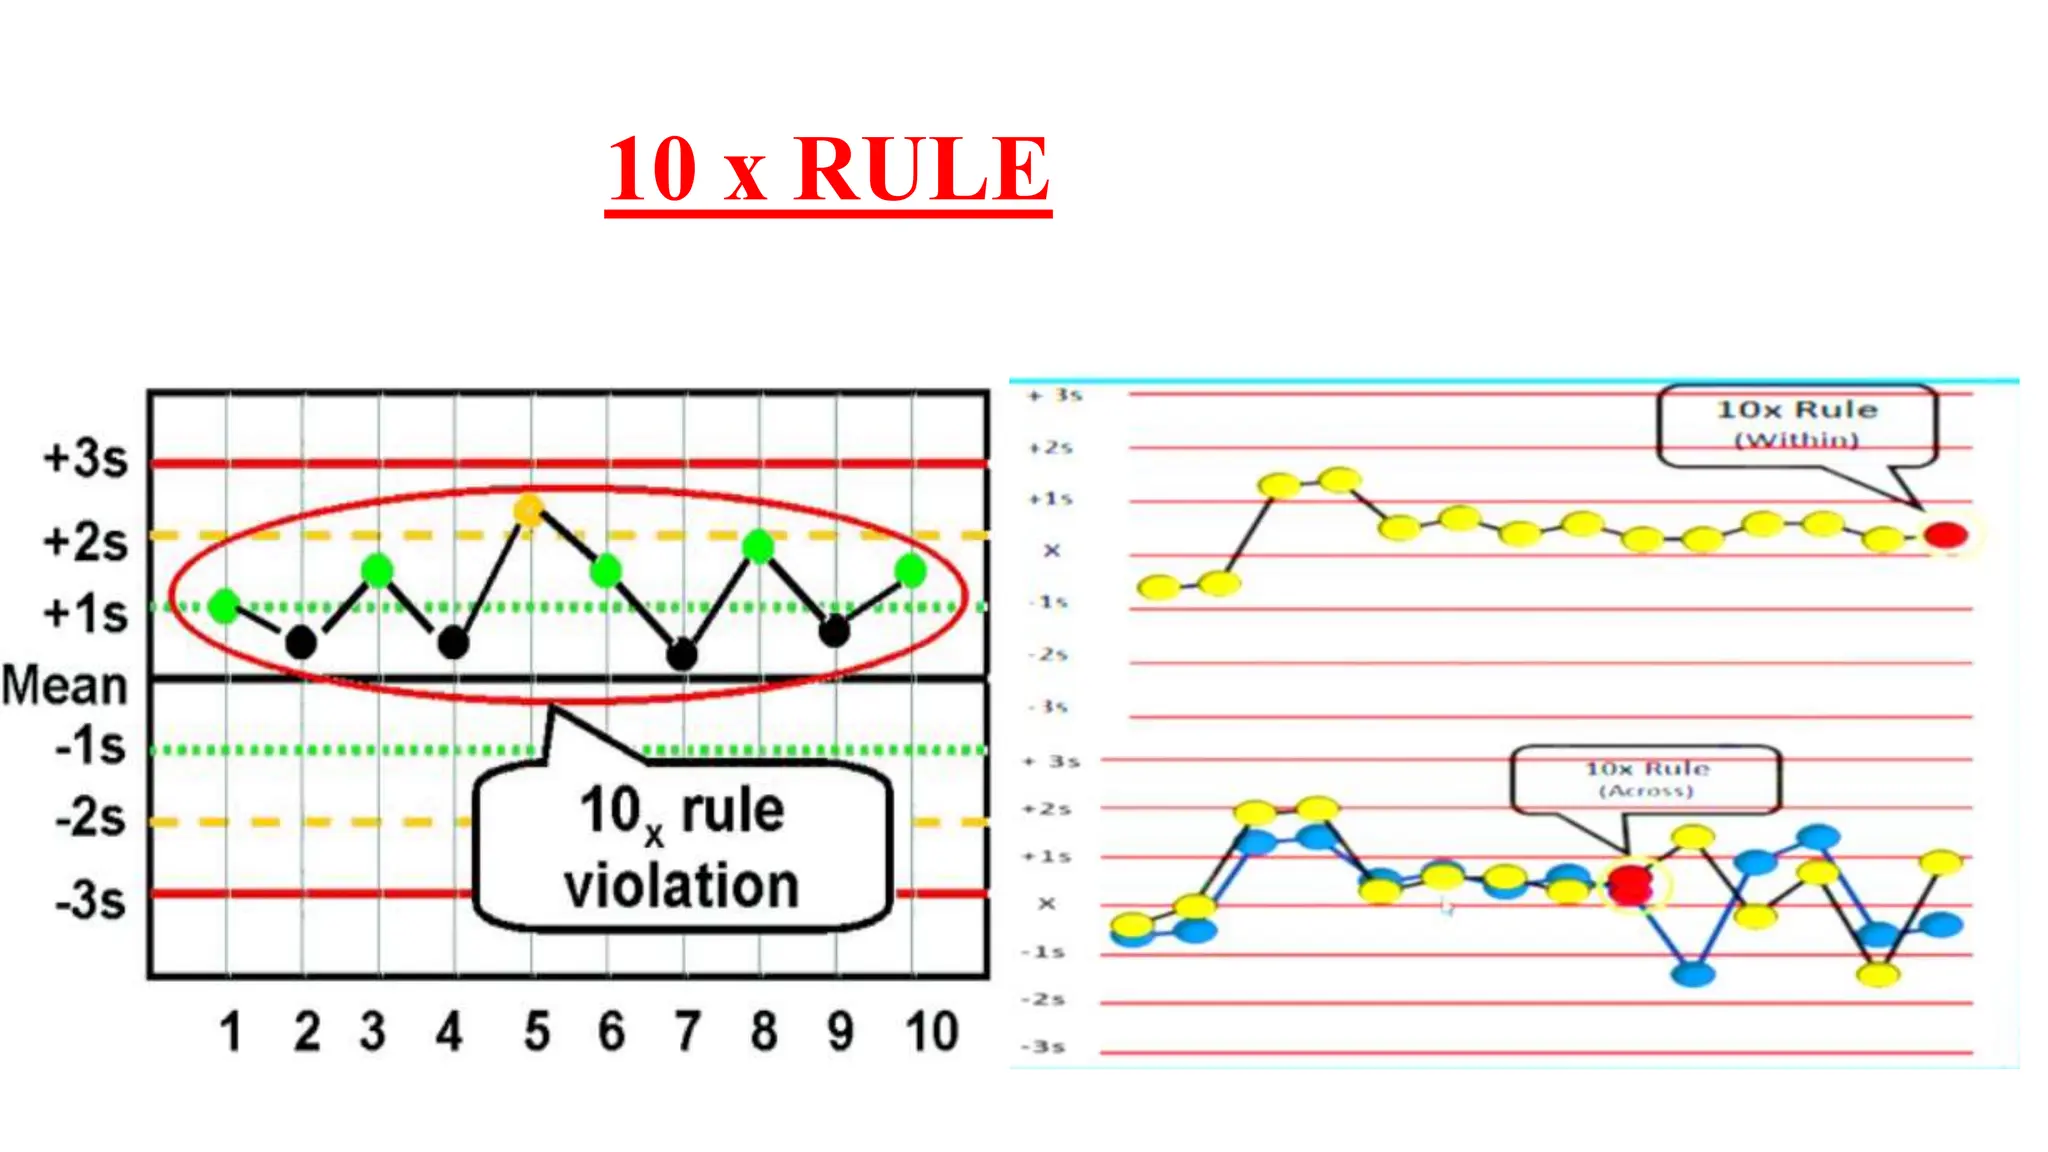
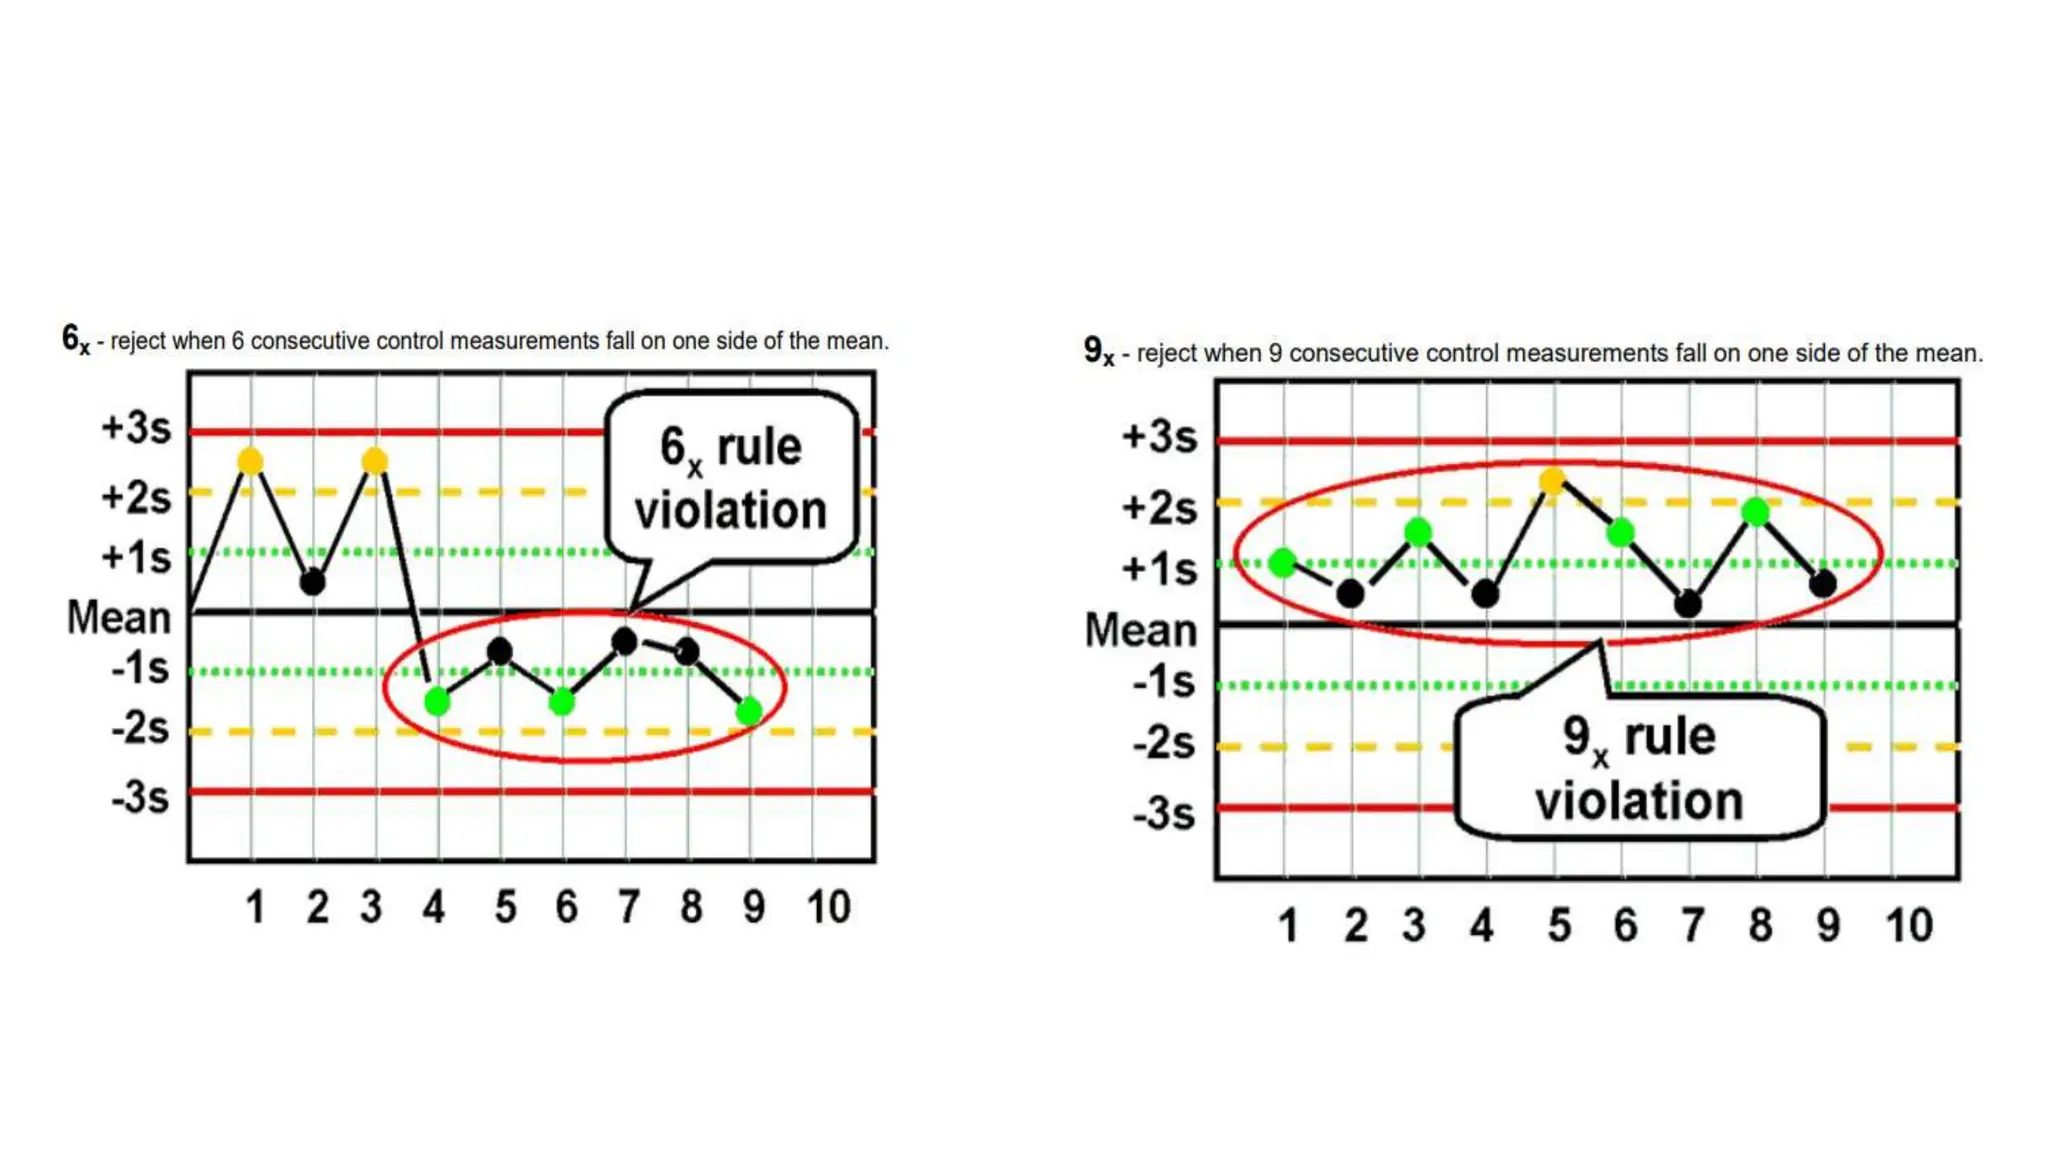
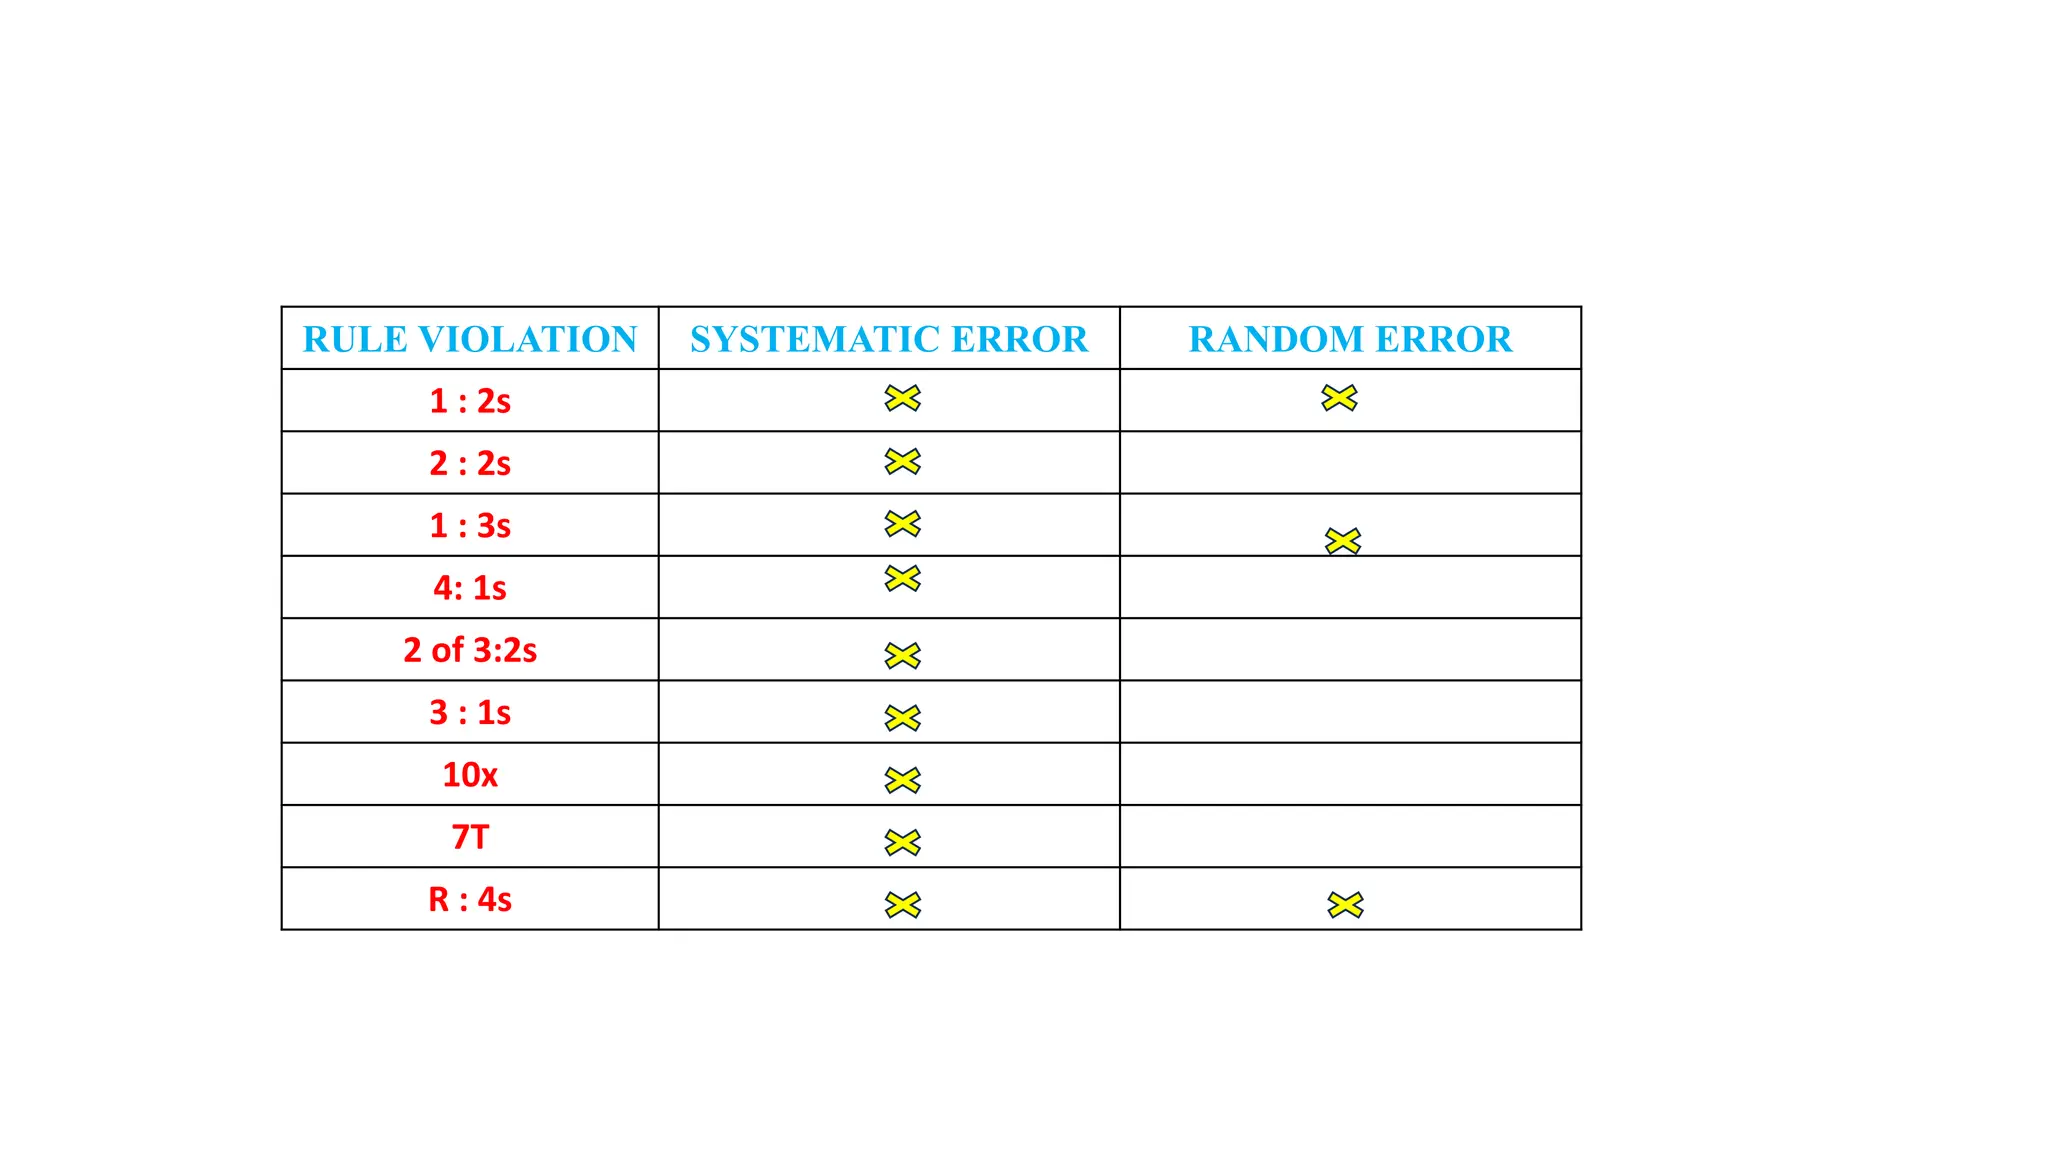
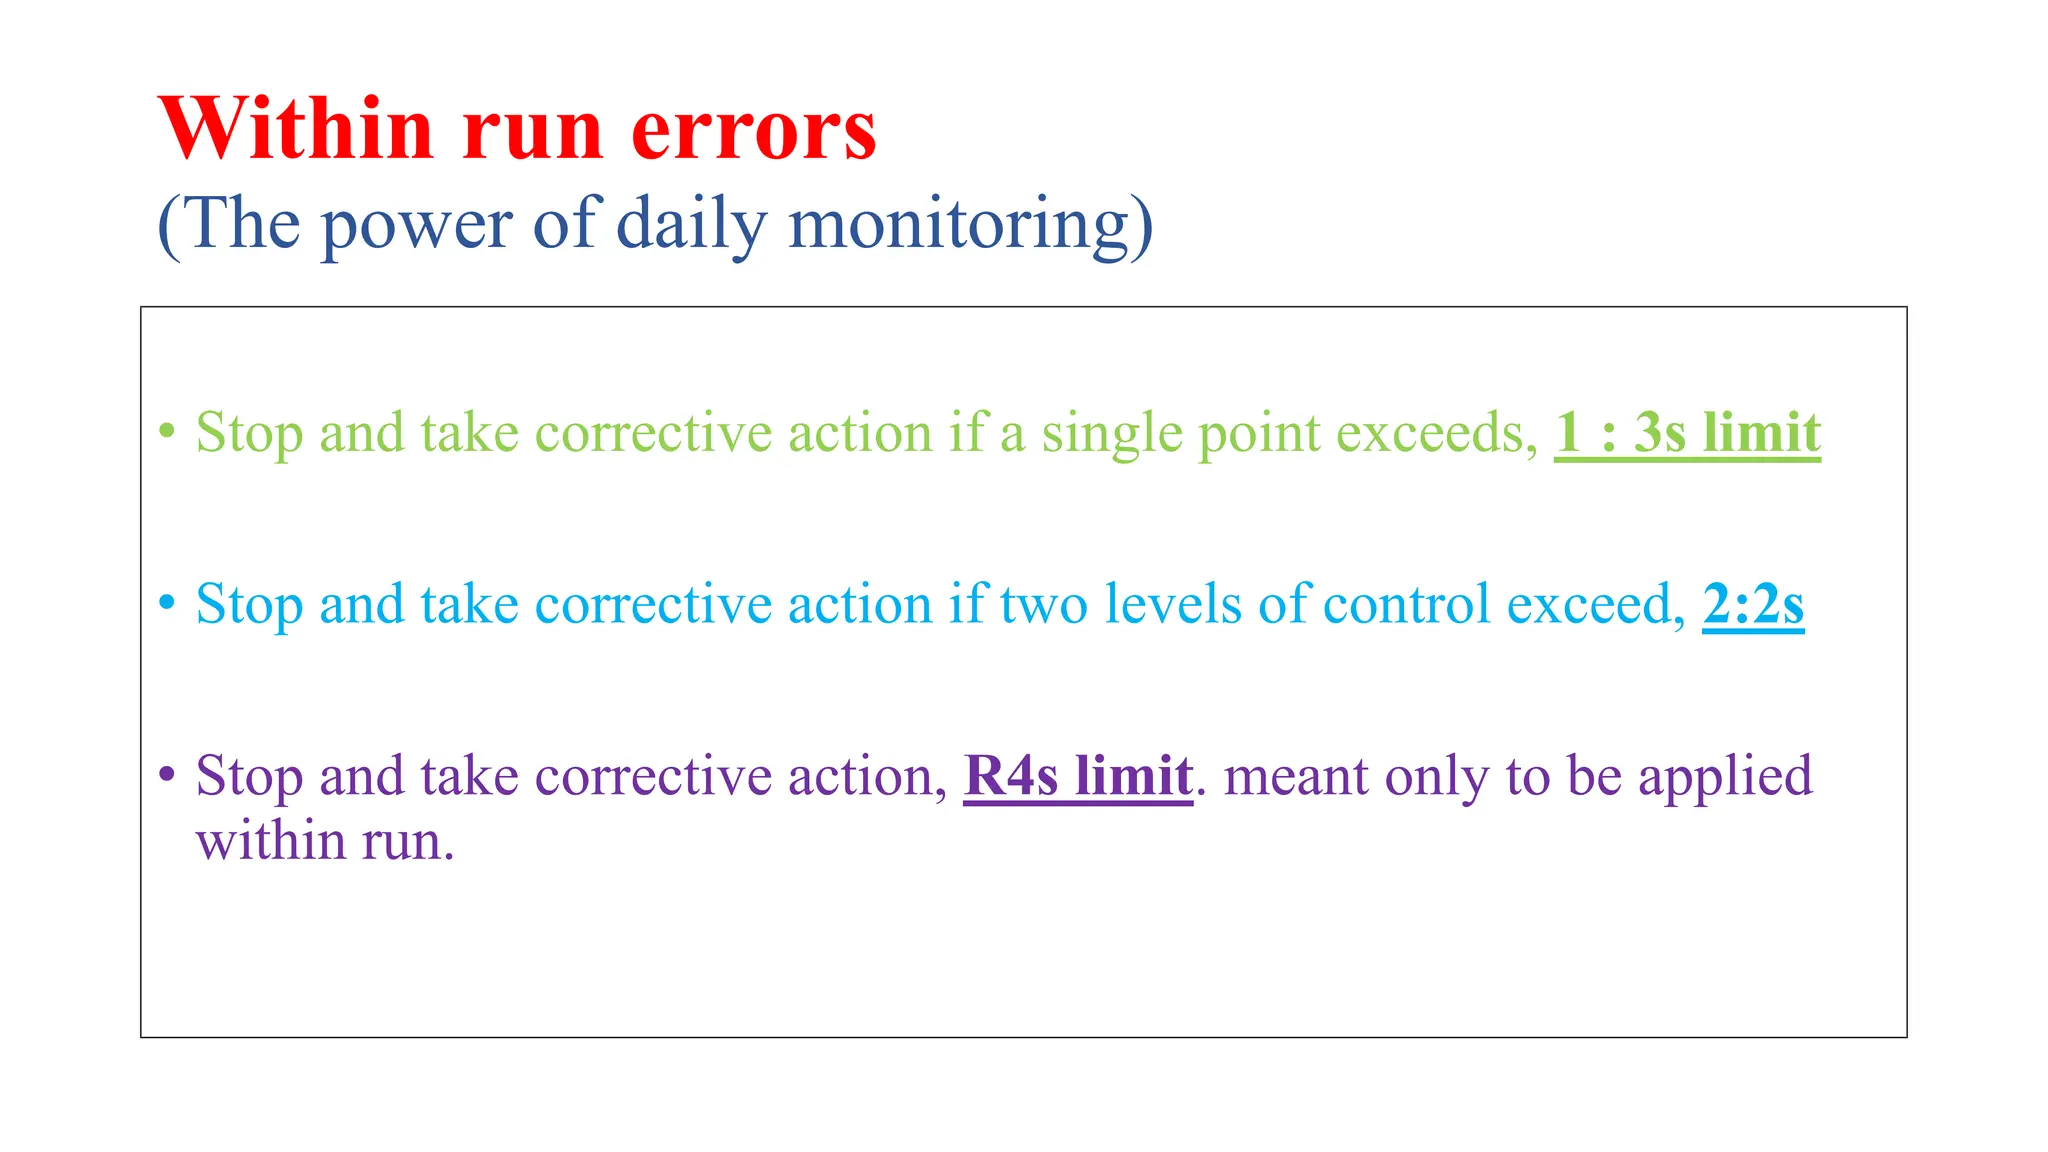
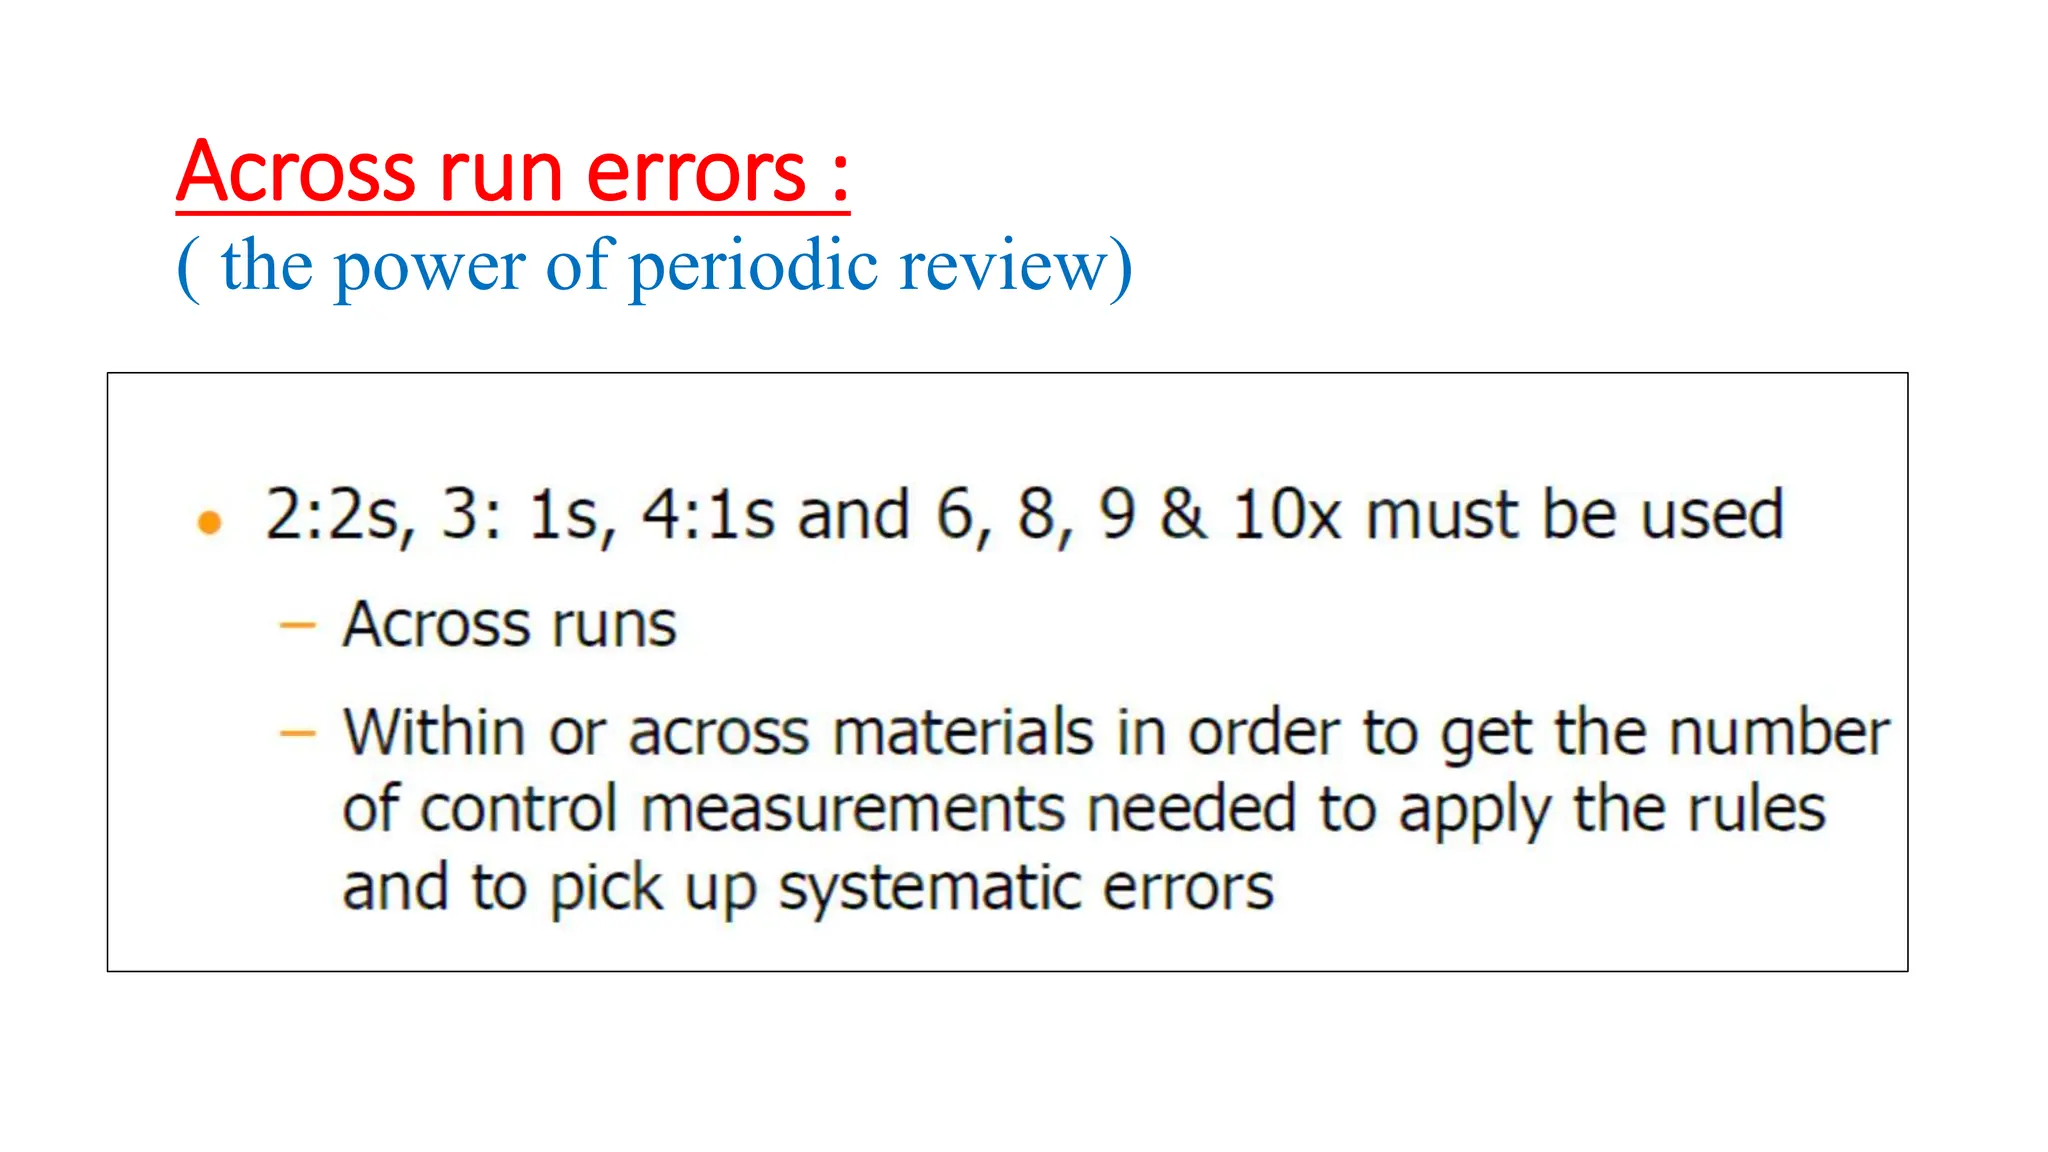
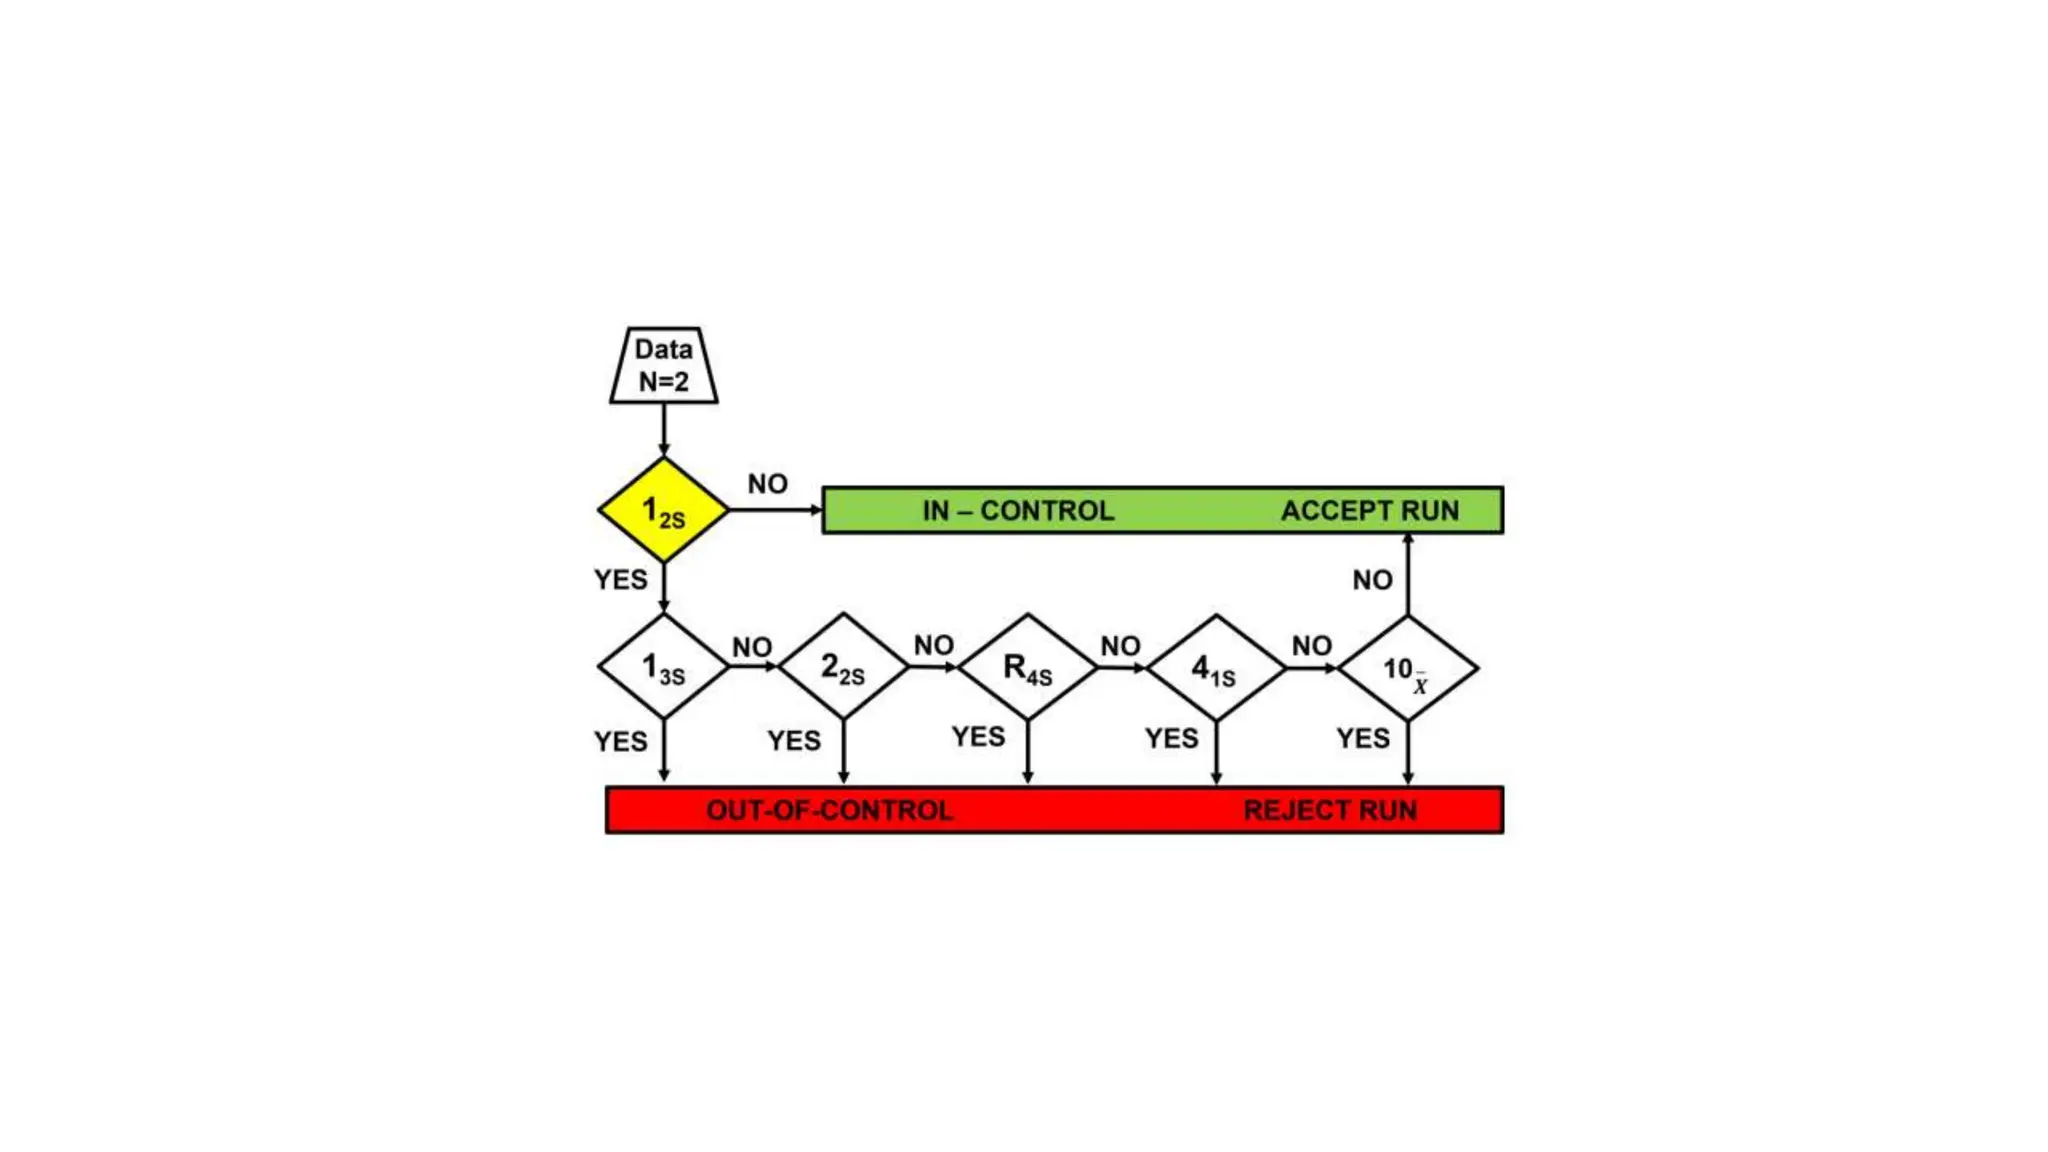
The Westgard rules provide a statistical framework for evaluating the quality of analytical runs in medical laboratories. Developed by Dr. James Westgard in the 1980s, the rules are based on statistical process control and can be used individually or together to detect random and systematic errors. Key rules include 1:2s for warning of potential errors, 1:3s and 2:2s for rejecting runs with errors, and 10x for identifying systematic biases over multiple runs. Laboratories should aim to maximize error detection while minimizing false rejections when applying these rules.
this is just a review of Quality Control Scheme integrated by Dr Westgard and his son, as here in ordinary clinic lab that QA Scheme is followed, and the LH 500 and our ACT5 Diff Coulter Counter, we are able to get the Yearly Sigma Scale performance for each analytes, our TAE for each analytes, I compute based on Rico's accepted biological variation as I deemed it is much pertinent, thus the EQAS in the peer group, cumulative bias average for 6 months and the IQAS's LJ Chart has the CV%. The two instruments are well maintained , with carryover check for each modes, Accuracy / Precision Check By the Engineer, the Calibration, is always Passed the required threshold for each parameter.
This powerpoint presentation is graciously dedicated to the father and son, the WESTGARDS...we owe you this quality assurance for each instruments we have, either in Biochem or Hematology, we salute you and more power, God Bless. From Sis Rina, our simple JPC lab here in the Gulf--thanks so much!
Troubleshooting Poor EQA/QC Performance in the Laboratory Randox
Step by step guide for clinical laboratories wishing to troubleshoot poor QC or EQA performance. Tips on how to distinguish between random error and systematic error. Suggested corrective actions are also provided.
Designing an appropriate QC procedure for your laboratoryRandox
Improving Laboratory Performance Through Quality Control - Five Simple Steps for QC Success.
It is easy to get caught up in an abundance of QC statistics and forget the fundamental reason why
QC exists in the first instance. QC is about detecting errors and ensuring that the results you
produce are accurate and reliable. All QC procedures should focus on reducing the risk of harm
to the patient. We are not examining statistics; we are examining real patients, real results and real
lives. Around 70% of all medical decisions are based on laboratory results, which is why it is of
utmost importance that each and every laboratory, has a well-designed QC procedure in place.
Quality in clinical laboratory is a continuous journey of improving processes through team work, innovative solutions, regulatory compliance with final objective to meet the evolving needs of clinicians & patients.
A routine session on quality assurance practice in a medical laboratory to sensitize and provide basics to those interested in working in a medical testing laboratory.
Laboratory Internal Quality Control presentation master revision, 2014Adel Elazab Elged
Short presentation about using internal quality control material in clinical laboratory to ensure analytical quality laboratory results for the sake of better patient care and minimizing errors in diagnosis, management, and follow up.
Monitoring External Quality Assessment / Proficiency Testing Performance - Investigating the source of the problem.
In order to identify the source of the problem it is useful to be aware of the most common causes of poor EQA performance. Errors can occur at any
stage of the testing process however EQA is most concerned with detecting analytical errors i.e. errors that occur during the analysis of the sample.
Most analytical errors can be easily divided into three main areas; clerical errors, systematic errors and random errors. Systematic errors result in
inaccurate results that consistently show a positive or negative bias. Random errors on the other hand affect precision and result in fluctuations in
either direction.
Troubleshooting QC Problems: Your QC has failed, what do you do next?Randox
Randox Quality Control's next 'Improving Laboratory Performance Through Quality Control' educational guide has been published with helpful tips that your laboratory can use in order to ensure it has effective troubleshooting procedures in place.
So you ran QC this morning and realised that one of your analytes has been flagged as 'out-of-control', what do you do next? Do you ignore the warning and continue patient testing, repeat the control until it's within range or do you halt patient testing and investigate the source of the error?
When it comes to troubleshooting QC errors, unfortunately there is no easy path to take. However, it's important that you have standard operating procedures in place, outlining what to do in the event of an out-of control error. Errors occur in laboratories all over the world. A lab with effective troubleshooting procedures in place will still have errors but will be able to detect them, quickly reducing their impact and reducing the risk of wasting both time and money.
QC Multi-rules are designed and used to minimise false rejections and maintain a high rate of error detection. There are six main rules used to determine if results from a run of patient samples should be accepted or rejected, based on the performance of control materials against the rule criteria. Different combinations can be applied depending on the number of controls in use, total allowable error and the instrument in use. The flow chart below is often used to determine if a run should be accepted or rejected.
QC Multi rules - Improving Laboratory Performance Through Quality ControlRandox
Randox Quality Control's latest educational guide examines and explains what QC Multi-Rules are, How to identify an out of control event with QC rules, How to use QC Multi-Rules, The different types of analytical errors, The tools to assist labs and how a lab can troubleshoot QC errors.
4th SEALNET meeting, item 8: Training on internal quality control - QC ChartsSoils FAO-GSP
QC charts - how to interpret the results of internal QC: QC charts and development of estimates of Measurement of Uncertainty using a top down approach - Rob De Hayr, GLOSOLAN Vice-Chair
4th Asian Soil Laboratory Network (SEALNET) meeting (online), 30 June - 2 July 2020
Quality control (QC) is a procedure or set of procedures intended to ensure that a manufactured product or performed service adheres to a defined set of quality criteria or meets the requirements of the client or customer. QC is similar to, but not identical with, quality assurance (QA).
QC IN clinical biochemistry labs and hospitals
Ethnobotany and Ethnopharmacology:
Ethnobotany in herbal drug evaluation,
Impact of Ethnobotany in traditional medicine,
New development in herbals,
Bio-prospecting tools for drug discovery,
Role of Ethnopharmacology in drug evaluation,
Reverse Pharmacology.
The Indian economy is classified into different sectors to simplify the analysis and understanding of economic activities. For Class 10, it's essential to grasp the sectors of the Indian economy, understand their characteristics, and recognize their importance. This guide will provide detailed notes on the Sectors of the Indian Economy Class 10, using specific long-tail keywords to enhance comprehension.
For more information, visit-www.vavaclasses.com
Students, digital devices and success - Andreas Schleicher - 27 May 2024..pptxEduSkills OECD
Andreas Schleicher presents at the OECD webinar ‘Digital devices in schools: detrimental distraction or secret to success?’ on 27 May 2024. The presentation was based on findings from PISA 2022 results and the webinar helped launch the PISA in Focus ‘Managing screen time: How to protect and equip students against distraction’ https://www.oecd-ilibrary.org/education/managing-screen-time_7c225af4-en and the OECD Education Policy Perspective ‘Students, digital devices and success’ can be found here - https://oe.cd/il/5yV
Instructions for Submissions thorugh G- Classroom.pptxJheel Barad
This presentation provides a briefing on how to upload submissions and documents in Google Classroom. It was prepared as part of an orientation for new Sainik School in-service teacher trainees. As a training officer, my goal is to ensure that you are comfortable and proficient with this essential tool for managing assignments and fostering student engagement.
Synthetic Fiber Construction in lab .pptxPavel ( NSTU)
Synthetic fiber production is a fascinating and complex field that blends chemistry, engineering, and environmental science. By understanding these aspects, students can gain a comprehensive view of synthetic fiber production, its impact on society and the environment, and the potential for future innovations. Synthetic fibers play a crucial role in modern society, impacting various aspects of daily life, industry, and the environment. ynthetic fibers are integral to modern life, offering a range of benefits from cost-effectiveness and versatility to innovative applications and performance characteristics. While they pose environmental challenges, ongoing research and development aim to create more sustainable and eco-friendly alternatives. Understanding the importance of synthetic fibers helps in appreciating their role in the economy, industry, and daily life, while also emphasizing the need for sustainable practices and innovation.
Palestine last event orientationfvgnh .pptxRaedMohamed3
An EFL lesson about the current events in Palestine. It is intended to be for intermediate students who wish to increase their listening skills through a short lesson in power point.
How to Make a Field invisible in Odoo 17Celine George
It is possible to hide or invisible some fields in odoo. Commonly using “invisible” attribute in the field definition to invisible the fields. This slide will show how to make a field invisible in odoo 17.
Unit 8 - Information and Communication Technology (Paper I).pdfThiyagu K
This slides describes the basic concepts of ICT, basics of Email, Emerging Technology and Digital Initiatives in Education. This presentations aligns with the UGC Paper I syllabus.
The French Revolution, which began in 1789, was a period of radical social and political upheaval in France. It marked the decline of absolute monarchies, the rise of secular and democratic republics, and the eventual rise of Napoleon Bonaparte. This revolutionary period is crucial in understanding the transition from feudalism to modernity in Europe.
For more information, visit-www.vavaclasses.com
2. • In 1981 Dr.James Westgard Of The University Of Wisconsin Published An Article
On Laboratory Quality Control That Set The Basis For Evaluating Analytical Run
Quality For Medical Laboratories.
• The Elements Of The Westgard Systems Are Based On Principles Of Statistical
Process Control Used In Industry Nation Wide Since The 1950’s
• These Rules Are Used Individually Or In Combination To Evaluate The Quality
Of Analytical Runs.
3. • The rules of how to use LJ correctly has been described by James
westgard and these are called Westgard rules.
• These rules are used for detecting changes in the analytical system.
4. Rules for what ?
• To decide whether an analytical run is in-control or out –of –control
• These rules can be applied as single rules and as a group of
rules(multi-rules)
• Westgard rules can be applied only if your qc are plotted with the
range of ±3 SD
5. Two key factors to keep in mind while selecting / using rules :
Maximize error detection:
Per cent error detection ( P ed ) >90%
Minimize false rejection :
Percent false rejection ( P fr ) < 5 %
6. 2 sets of QC rule nomenclatures
1. N and L
2. Within / across (run / material)
8. Nomenclature 2 :
Within-run / across material
DATE QC LEVELS
DAY I Level 1 Level 2
DAY 2 Level 1 Level 2
Across run / same material
DATE QC LEVELS
DAY 1 LEVEL 1 LEVEL2
DAY 2 LEVEL 1 LEVEL 2
2/3 LEVEL OF QC IN THE SAME RUN
SAME LEVEL (MATERIAL) OF QC BUT IN 2 OR MORE
CONSECUTIVE RUNS
11. 1:2S RULE
• One control exceeding the ± 2 SD limit.
• Denotes a random error / beginning of a systematic error
• Warning rule
• It can be both in plus and in minus direction
• Even In absence of any analytical errors 4.5 % of data points in the
region of 1:2S region
If only one level of QC is being run in the lab 1:2S has to be a
rejection rule
14. • one control result has exceeded the established mean +/- 3SD range.
• Rejection rule
• a run is rejected when a single control measurement exceeds the mean
3SD control limit
This rule identifies unacceptable
Random error
Beginning of a large systematic error.
15. 2:2s RULE
• two consecutive control results have exceeded the same mean +/- 2SD
limit.
• Rejection rule.
• Identifies only systematic errors only
There are two applications to this rule
• With-in-run ( in the 2 levels of QC in the same run)
• Across runs ( in the same QC in 2 consecutive runs )
17. If a normal (level 1) and abnormal (level 2) control are
>2s On the same side of mean:
• This run violates the within-run application for systematic error
If level 1 is accepatable and level 2 is 1:2s, the level 2 result from
previous run is examined:
• If level 2 in previous run was
• At +2.0s or greater
• Then the across run application for systematic error is violated
18.
19. 2 of 32s RULE:
• When 2 out of 3 control measurements exceed the same ±2SD control
limit.
• Denotes systematic error.
20.
21. R4S RULE :
• When 2 control measurements in a group exceeds the mean ±2SD on
either side or if the sum of SD of two material >4 SD
• Only be interpreted within-run, not across-run
• Identifies random error only
• Applied only within the current run.
24. 31S RULE :
• 3 consecutive control meaurements exceed the same mean plus 1s or
mean minus 1s control limit.
• Denotes systematic error
• 3 consecutive results
• Greater than 1s
• On the same side of mean
• Applied for within control material or across control material
26. • Within control material violations indicate systematic bias in a single
area of the method curve.
• While violation across control materials indicates systematic error
over a broader concentration.
32. • When 6 or 8 or 9 or 10 or 12 control results on the same side of mean
regardless of the specific SD in which they are located.
• Within control material violations indicate systematic bias in a single
area of the method curve
• While violation across control materials indicates systematic error
over a broader concentration.
37. RULE VIOLATION SYSTEMATIC ERROR RANDOM ERROR
1 : 2s
2 : 2s
1 : 3s
4: 1s
2 of 3:2s
3 : 1s
10x
7T
R : 4s
38. Within run errors
(The power of daily monitoring)
• Stop and take corrective action if a single point exceeds, 1 : 3s limit
• Stop and take corrective action if two levels of control exceed, 2:2s
• Stop and take corrective action, R4s limit. meant only to be applied
within run.
43. Corrective actions
Things that can go wrong
• Instrument malfunction
• Reagents preparations,contamination,
volume
• Tech error
• Control specimen is old or prepared
improperly
Corrective action
• Identify malfunction
• New reagents
• Identify error and repeat test
• Use new control