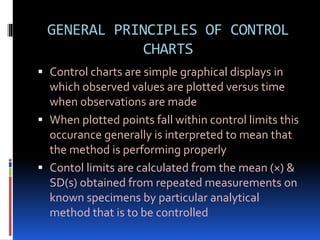
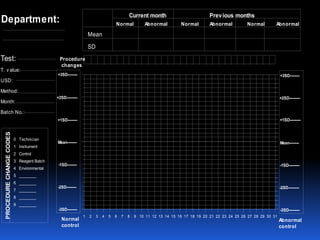
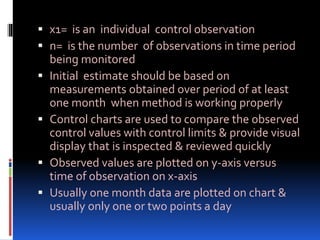
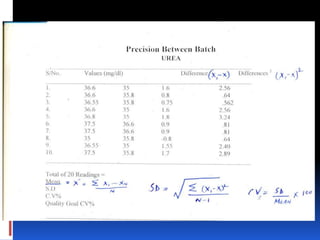
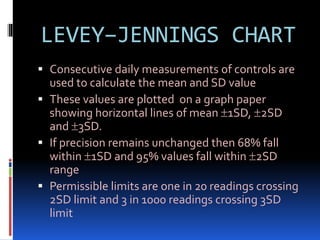
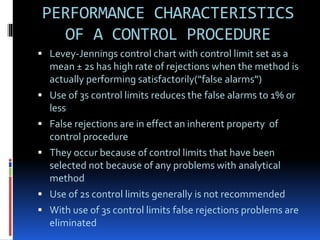
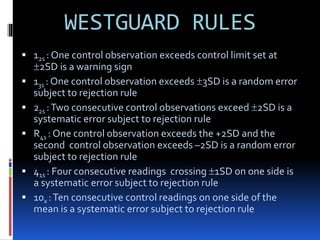
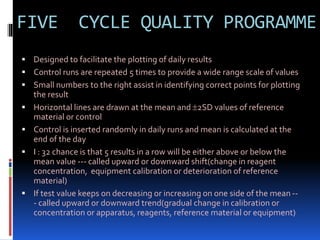
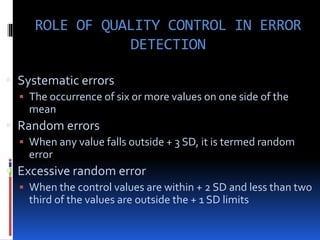
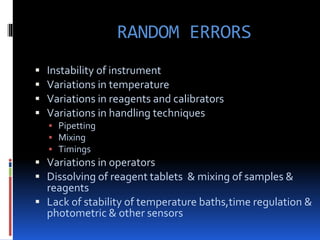
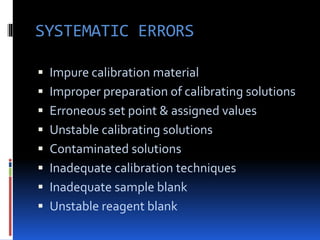
GENERAL PRINCIPLES OF
CONTROL CHARTS
GENERAL PRINCIPLES OF CONTROL
CHARTS
 Control charts are simple graphical displays in
which observed values are plotted versus time
when observations are made
 When plotted points fall within control limits this
occurance generally is interpreted to mean that
the method is performing properly
 Contol limits are calculated from the mean (×) &
SD(s) obtained from repeated measurements on
known specimens by particular analytical
method that is to be controlled
1 2 3 4 5 6 7 8 9 10 11 12 13 14 15 16 17 18 19 20 21 22 23 24 25 26 27 28 29 30 31
Test:
T. v alue:
USD:
Method:
Month:
Batch No.:
Current month Previous months
Normal Abnormal Normal Abnormal Normal Abnormal
Mean
SD
0 Technician
1 Instrument
2 Control
3 Reagent Batch
4 Environmental
5 ________
6 ________
7 ________
8 ________
9 ________
PROCEDURE
CHANGE
CODES
Procedure
changes
Department:
+1SD---------
+2SD----------
+3SD---------
Mean---------
-1SD---------
-2SD---------
-3SD---------
+1SD----------
+2SD----------
+3SD---------
Mean---------
-1SD----------
-2SD----------
-3SD----------
Normal
control
Abnormal
control
 x1= is an individual control observation
 n= is the number of observations in time period
being monitored
 Initial estimate should be based on
measurements obtained over period of at least
one month when method is working properly
 Control charts are used to compare the observed
control values with control limits & provide visual
display that is inspected & reviewed quickly
 Observed values are plotted on y-axis versus
time of observation on x-axis
 Usually one month data are plotted on chart &
usually only one or two points a day
LEVEY–JENNINGS CHART
 Consecutive daily measurements of controls are
used to calculate the mean and SD value
 These values are plotted on a graph paper
showing horizontal lines of mean 1SD, 2SD
and 3SD.
 If precision remains unchanged then 68% fall
within 1SD and 95% values fall within 2SD
range
 Permissible limits are one in 20 readings crossing
2SD limit and 3 in 1000 readings crossing 3SD
limit
PERFORMANCE CHARACTERISTICS
OF A CONTROL PROCEDURE
 Levey-Jennings control chart with control limit set as a
mean ± 2s has high rate of rejections when the method is
actually performing satisfactorily(“false alarms”)
 Use of 3s control limits reduces the false alarms to 1% or
less
 False rejections are in effect an inherent property of
control procedure
 They occur because of control limits that have been
selected not because of any problems with analytical
method
 Use of 2s control limits generally is not recommended
 With use of 3s control limits false rejections problems are
eliminated
WESTGUARD RULES
 12s : One control observation exceeds control limit set at
2SD is a warning sign
 13s : One control observation exceeds 3SD is a random error
subject to rejection rule
 22s :Two consecutive control observations exceed 2SD is a
systematic error subject to rejection rule
 R4s : One control observation exceeds the +2SD and the
second control observation exceeds –2SD is a random error
subject to rejection rule
 41s : Four consecutive readings crossing 1SD on one side is
a systematic error subject to rejection rule
 10x :Ten consecutive control readings on one side of the
mean is a systematic error subject to rejection rule
FIVE CYCLE QUALITY PROGRAMME
 Designed to facilitate the plotting of daily results
 Control runs are repeated 5 times to provide a wide range scale of values
 Small numbers to the right assist in identifying correct points for plotting
the result
 Horizontal lines are drawn at the mean and 2SD values of reference
material or control
 Control is inserted randomly in daily runs and mean is calculated at the
end of the day
 I : 32 chance is that 5 results in a row will be either above or below the
mean value --- called upward or downward shift(change in reagent
concentration, equipment calibration or deterioration of reference
material)
 If test value keeps on decreasing or increasing on one side of the mean --
- called upward or downward trend(gradual change in calibration or
concentration or apparatus, reagents, reference material or equipment)
ROLE OF QUALITY CONTROL IN ERROR
DETECTION
 Systematic errors
 The occurrence of six or more values on one side of the
mean
 Random errors
 When any value falls outside + 3 SD, it is termed random
error
 Excessive random error
 When the control values are within + 2 SD and less than two
third of the values are outside the + 1 SD limits
RANDOM ERRORS
 Instability of instrument
 Variations in temperature
 Variations in reagents and calibrators
 Variations in handling techniques
 Pipetting
 Mixing
 Timings
 Variations in operators
 Dissolving of reagent tablets & mixing of samples &
reagents
 Lack of stability of temperature baths,time regulation &
photometric & other sensors
 Impure calibration material
 Improper preparation of calibrating solutions
 Erroneous set point & assigned values
 Unstable calibrating solutions
 Contaminated solutions
 Inadequate calibration techniques
 Inadequate sample blank
 Unstable reagent blank
SYSTEMATIC ERRORS
QUALITY CONTROL OF
REAGENTS
 Date of preparation
 Expiry date
 Requirment for refrigeration
 Radioactivity, flammability
 One container should be reserved for one
reagent only
 Reagents should be free from dirt and direct
sun light
CALIBRATION
 Controls and calibrators
 Matrix effect
 Sufficient for 1-2 years
 Verification of new calibrators
 Duplicate measurements
 QC samples
 Patient samples
 Average SD test
 Significant difference ?
INTERNAL QUALITY CONTROL
PROGRAMME
 Daily running of same control sera
 Calculation of their mean and standard
deviation
 Plotting them on control charts
 Interpretation of graphs as follows:
 Daily checking
 Monthly checking
 Annual checking
 Periodic checking
DAILY QC PROGRAMME
 Check daily maintenance schedule
 Record any change
 Frequency of known QC samples (Continuous
?) and calibrators
 Frequency of blind QC samples
 Run QC samples before unknowns
 Normal and abnormal control
DAILY QC PROGRAMME
 QC of stat analysis
 Decision about validity of batch results
 Record of QC result and decisions
 Error detection and correction
 Log book maintenance
 Communication with physicians
WEEKLY QC REVIEW
 Short term changes
 Weekly maintenance checks
MONTHLY QC REVIEW
 Check monthly maintenance
 Shifts or trends
 Evaluate monthly average against target average
(temporary and final)
 Evaluate SD against USD
 If difference between target average and monthly
average is more than 1 USD
Decision A: Statistically significant ?
Decision B: Medically significant ?
Decision C: Operationally significant ?
MONTHLY QC
 Compare monthly SD with USD
 If difference is more than half USD
 Statistical significance ?
 Medical significance ?
 Operational significance
 Significant change limit
 Check against QC goals
 Monthly patient average limit
USE OF BLIND SAMPLE IN
QUALITY CONTROL
 Blind quality control samples
 Blind patient samples
 Purpose of blind sample system
PRECISION
 Selection of specimens
 Arrangement of
specimens
 Effect of concentration
 Between-batch CV
 Within-batch CV
Interferences Calibration Nonlinearity
Contamination Uncorrected
blank
Bias
Instrumental
shifts
Lack of
Precision
Operator
Bias
Matrix
effects
Reagent
Instability
CORRECTION OF THE ERRORS
 Errors in accuracy
 Stepwise checking/replacement
 Control material
 Standards
 Sampling system
 Measuring system like
spectrophotometers
 Reagents
 Performance of analytical system

General Principles of Quality control.ppt

  • 1.
  • 2.
    GENERAL PRINCIPLES OFCONTROL CHARTS  Control charts are simple graphical displays in which observed values are plotted versus time when observations are made  When plotted points fall within control limits this occurance generally is interpreted to mean that the method is performing properly  Contol limits are calculated from the mean (×) & SD(s) obtained from repeated measurements on known specimens by particular analytical method that is to be controlled
  • 3.
    1 2 34 5 6 7 8 9 10 11 12 13 14 15 16 17 18 19 20 21 22 23 24 25 26 27 28 29 30 31 Test: T. v alue: USD: Method: Month: Batch No.: Current month Previous months Normal Abnormal Normal Abnormal Normal Abnormal Mean SD 0 Technician 1 Instrument 2 Control 3 Reagent Batch 4 Environmental 5 ________ 6 ________ 7 ________ 8 ________ 9 ________ PROCEDURE CHANGE CODES Procedure changes Department: +1SD--------- +2SD---------- +3SD--------- Mean--------- -1SD--------- -2SD--------- -3SD--------- +1SD---------- +2SD---------- +3SD--------- Mean--------- -1SD---------- -2SD---------- -3SD---------- Normal control Abnormal control
  • 4.
     x1= isan individual control observation  n= is the number of observations in time period being monitored  Initial estimate should be based on measurements obtained over period of at least one month when method is working properly  Control charts are used to compare the observed control values with control limits & provide visual display that is inspected & reviewed quickly  Observed values are plotted on y-axis versus time of observation on x-axis  Usually one month data are plotted on chart & usually only one or two points a day
  • 6.
    LEVEY–JENNINGS CHART  Consecutivedaily measurements of controls are used to calculate the mean and SD value  These values are plotted on a graph paper showing horizontal lines of mean 1SD, 2SD and 3SD.  If precision remains unchanged then 68% fall within 1SD and 95% values fall within 2SD range  Permissible limits are one in 20 readings crossing 2SD limit and 3 in 1000 readings crossing 3SD limit
  • 7.
    PERFORMANCE CHARACTERISTICS OF ACONTROL PROCEDURE  Levey-Jennings control chart with control limit set as a mean ± 2s has high rate of rejections when the method is actually performing satisfactorily(“false alarms”)  Use of 3s control limits reduces the false alarms to 1% or less  False rejections are in effect an inherent property of control procedure  They occur because of control limits that have been selected not because of any problems with analytical method  Use of 2s control limits generally is not recommended  With use of 3s control limits false rejections problems are eliminated
  • 8.
    WESTGUARD RULES  12s: One control observation exceeds control limit set at 2SD is a warning sign  13s : One control observation exceeds 3SD is a random error subject to rejection rule  22s :Two consecutive control observations exceed 2SD is a systematic error subject to rejection rule  R4s : One control observation exceeds the +2SD and the second control observation exceeds –2SD is a random error subject to rejection rule  41s : Four consecutive readings crossing 1SD on one side is a systematic error subject to rejection rule  10x :Ten consecutive control readings on one side of the mean is a systematic error subject to rejection rule
  • 9.
    FIVE CYCLE QUALITYPROGRAMME  Designed to facilitate the plotting of daily results  Control runs are repeated 5 times to provide a wide range scale of values  Small numbers to the right assist in identifying correct points for plotting the result  Horizontal lines are drawn at the mean and 2SD values of reference material or control  Control is inserted randomly in daily runs and mean is calculated at the end of the day  I : 32 chance is that 5 results in a row will be either above or below the mean value --- called upward or downward shift(change in reagent concentration, equipment calibration or deterioration of reference material)  If test value keeps on decreasing or increasing on one side of the mean -- - called upward or downward trend(gradual change in calibration or concentration or apparatus, reagents, reference material or equipment)
  • 10.
    ROLE OF QUALITYCONTROL IN ERROR DETECTION  Systematic errors  The occurrence of six or more values on one side of the mean  Random errors  When any value falls outside + 3 SD, it is termed random error  Excessive random error  When the control values are within + 2 SD and less than two third of the values are outside the + 1 SD limits
  • 11.
    RANDOM ERRORS  Instabilityof instrument  Variations in temperature  Variations in reagents and calibrators  Variations in handling techniques  Pipetting  Mixing  Timings  Variations in operators  Dissolving of reagent tablets & mixing of samples & reagents  Lack of stability of temperature baths,time regulation & photometric & other sensors
  • 12.
     Impure calibrationmaterial  Improper preparation of calibrating solutions  Erroneous set point & assigned values  Unstable calibrating solutions  Contaminated solutions  Inadequate calibration techniques  Inadequate sample blank  Unstable reagent blank SYSTEMATIC ERRORS
  • 13.
    QUALITY CONTROL OF REAGENTS Date of preparation  Expiry date  Requirment for refrigeration  Radioactivity, flammability  One container should be reserved for one reagent only  Reagents should be free from dirt and direct sun light
  • 14.
    CALIBRATION  Controls andcalibrators  Matrix effect  Sufficient for 1-2 years  Verification of new calibrators  Duplicate measurements  QC samples  Patient samples  Average SD test  Significant difference ?
  • 15.
    INTERNAL QUALITY CONTROL PROGRAMME Daily running of same control sera  Calculation of their mean and standard deviation  Plotting them on control charts  Interpretation of graphs as follows:  Daily checking  Monthly checking  Annual checking  Periodic checking
  • 16.
    DAILY QC PROGRAMME Check daily maintenance schedule  Record any change  Frequency of known QC samples (Continuous ?) and calibrators  Frequency of blind QC samples  Run QC samples before unknowns  Normal and abnormal control
  • 17.
    DAILY QC PROGRAMME QC of stat analysis  Decision about validity of batch results  Record of QC result and decisions  Error detection and correction  Log book maintenance  Communication with physicians
  • 18.
    WEEKLY QC REVIEW Short term changes  Weekly maintenance checks
  • 19.
    MONTHLY QC REVIEW Check monthly maintenance  Shifts or trends  Evaluate monthly average against target average (temporary and final)  Evaluate SD against USD  If difference between target average and monthly average is more than 1 USD Decision A: Statistically significant ? Decision B: Medically significant ? Decision C: Operationally significant ?
  • 20.
    MONTHLY QC  Comparemonthly SD with USD  If difference is more than half USD  Statistical significance ?  Medical significance ?  Operational significance  Significant change limit  Check against QC goals  Monthly patient average limit
  • 21.
    USE OF BLINDSAMPLE IN QUALITY CONTROL  Blind quality control samples  Blind patient samples  Purpose of blind sample system
  • 22.
    PRECISION  Selection ofspecimens  Arrangement of specimens  Effect of concentration  Between-batch CV  Within-batch CV
  • 23.
    Interferences Calibration Nonlinearity ContaminationUncorrected blank Bias Instrumental shifts Lack of Precision Operator Bias Matrix effects Reagent Instability
  • 24.
    CORRECTION OF THEERRORS  Errors in accuracy  Stepwise checking/replacement  Control material  Standards  Sampling system  Measuring system like spectrophotometers  Reagents  Performance of analytical system