High Class Call Girls Nashik Maya 7001305949 Independent Escort Service Nashik
Weekly market report
1. Page 1 of 6
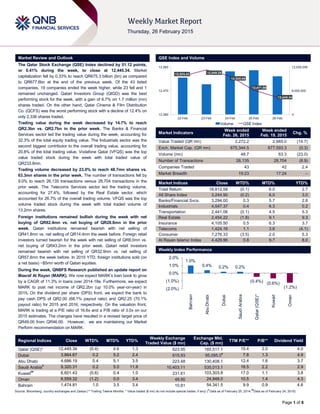
Market Review and Outlook QSE Index and Volume
The Qatar Stock Exchange (QSE) Index declined by 51.12 points,
or 0.41% during the week, to close at 12,445.34. Market
capitalization fell by 0.33% to reach QR675.3 billion (bn) as compared
to QR677.6bn at the end of the previous week. Of the 43 listed
companies, 19 companies ended the week higher, while 23 fell and 1
remained unchanged. Qatari Investors Group (QIGD) was the best
performing stock for the week, with a gain of 6.7% on 1.7 million (mn)
shares traded. On the other hand, Qatar Cinema & Film Distribution
Co. (QCFS) was the worst performing stock with a decline of 12.4% on
only 2,336 shares traded.
Trading value during the week decreased by 14.7% to reach
QR2.3bn vs. QR2.7bn in the prior week. The Banks & Financial
Services sector led the trading value during the week, accounting for
32.3% of the total equity trading value. The Industrials sector was the
second biggest contributor to the overall trading value, accounting for
20.8% of the total trading value. Vodafone Qatar (VFQS) was the top
value traded stock during the week with total traded value of
QR233.8mn.
Trading volume decreased by 23.0% to reach 48.7mn shares vs.
63.3mn shares in the prior week. The number of transactions fell by
9.0% to reach 26,135 transactions versus 28,704 transactions in the
prior week. The Telecoms Services sector led the trading volume,
accounting for 27.4%, followed by the Real Estate sector, which
accounted for 26.7% of the overall trading volume. VFQS was the top
volume traded stock during the week with total traded volume of
13.2mn shares.
Foreign institutions remained bullish during the week with net
buying of QR82.4mn vs. net buying of QR28.8mn in the prior
week. Qatari institutions remained bearish with net selling of
QR41.8mn vs. net selling of QR14.4mn the week before. Foreign retail
investors turned bearish for the week with net selling of QR8.0mn vs.
net buying of QR43.2mn in the prior week. Qatari retail investors
remained bearish with net selling of QR32.9mn vs. net selling of
QR57.6mn the week before. In 2015 YTD, foreign institutions sold (on
a net basis) ~$5mn worth of Qatari equities.
During the week, QNBFS Research published an update report on
Masraf Al Rayan (MARK). We now expect MARK’s loan book to grow
by a CAGR of 11.3% in loans over 2014-18e. Furthermore, we expect
MARK to post net income of QR2.2bn (up 10.0% year-on-year) in
2015. On the dividend per share (DPS) front, we expect the bank to
pay cash DPS of QR2.00 (68.1% payout ratio) and QR2.25 (70.1%
payout ratio) for 2015 and 2016, respectively. On the valuation front,
MARK is trading at a P/E ratio of 16.6x and a P/B ratio of 3.0x on our
2015 estimates. The changes have resulted in a revised target price of
QR49.00 from QR46.00. However, we are maintaining our Market
Perform recommendation on MARK.
Market Indicators
Week ended
Feb. 26, 2015
Week ended
Feb. 19, 2015
Chg. %
Value Traded (QR mn) 2,272.2 2,665.0 (14.7)
Exch. Market Cap. (QR mn) 675,344.5 677,593.3 (0.3)
Volume (mn) 48.7 63.3 (23.0)
Number of Transactions 26,135 28,704 (8.9)
Companies Traded 43 42 2.4
Market Breadth 19:23 17:24 –
Market Indices Close WTD% MTD% YTD%
Total Return 18,812.58 (0.1) 6.0 2.7
All Share Index 3,244.90 (0.2) 6.0 3.0
Banks/Financial Svcs. 3,294.00 0.3 5.7 2.8
Industrials 4,047.37 0.4 6.3 0.2
Transportation 2,441.06 (0.1) 4.5 5.3
Real Estate 2,454.22 (1.8) 9.1 9.3
Insurance 4,105.50 0.5 6.3 3.7
Telecoms 1,424.16 1.1 3.8 (4.1)
Consumer 7,276.33 (3.5) 2.0 5.3
Al Rayan Islamic Index 4,429.96 0.8 9.7 8.0
Market Indices
Weekly Index Performance
Regional Indices Close WTD% MTD% YTD%
Weekly Exchange
Traded Value ($ mn)
Exchange Mkt.
Cap. ($ mn)
TTM P/E** P/B** Dividend Yield
Qatar (QSE)* 12,445.34 (0.4) 4.6 1.3 623.95 185,517.1 15.4 2.0 4.0
Dubai 3,864.67 0.2 5.2 2.4 615.93 95,095.0#
7.8 1.3 4.9
Abu Dhabi 4,686.19 0.4 5.1 3.5 223.48 130,408.1 12.4 1.6 3.7
Saudi Arabia#
9,320.31 0.2 5.0 11.8 10,403.11 535,013.1 18.5 2.2 2.9
Kuwait##
6,601.43 (0.6) 0.4 1.0 231.61 103,303.8 17.0 1.1 3.8
Oman 6,559.32 (1.2) 0.0 3.4 48.90 24,948.0 10.5 1.4 4.3
Bahrain 1,474.81 1.0 3.5 3.4 10.81 54,341.5 9.9 0.9 4.6
Source: Bloomberg, country exchanges and Zawya (** Trailing Twelve Months; * Value traded ($ mn) do not include special trades, if any) (
#
Data as of February 25, 2014,
##
Data as of February 24, 2015)
12,525.43 12,549.25
12,525.88
12,471.96
12,445.34
0
6,000,000
12,000,000
12,380
12,470
12,560
22-Feb 23-Feb 24-Feb 25-Feb 26-Feb
Volume QSE Index
1.0%
0.4% 0.2% 0.2%
(0.4%) (0.6%)
(1.2%)(2.0%)
(1.0%)
0.0%
1.0%
2.0%
Bahrain
AbuDhabi
Dubai
SaudiArabia
Qatar(QSE)*
Kuwait
Oman
2. Page 2 of 6
News
Economic News
New port in Mesaieed to open on February 26 – The Ministry
of Transport (MoT) and the New Port Steering Committee
announced that the name of the new port established at Umm
Al-Hul, Mesaieed Area will be revealed on February 26, 2015,
when its basin will be flooded with water. The basin of the new
port is around 4 kilometers long, 700 meters wide, and 17
meters deep, which can accommodate the largest vessels in
the world. The new port has 12 platform cranes, each capable
of handling 80 tons. The port will be employing around 17,000
workers during the peak phase. (Gulf-Times.com)
Market & Corporate News
Qatar to spend $12.5bn on housing until 2022 – The Minister
of Economy & Commerce (MoEC), HE Sheikh Ahmed bin
Jassim bin Mohamed Al Thani, said that $12.5bn is to be spent
to create adequate housing stocks in Qatar to cater to the
growing population ahead of the 2022 FIFA World Cup. The
sum to be spent over the next seven years will also cover the
basic infrastructure needed to create and support the massive
housing stocks. (Gulf-Times.com)
QFLS reports QR1.13bn net profit in FY2014, to execute 39
projects – Woqod (QFLS) reported a net profit of QR1.13bn in
FY2014, reflecting an increase of 1% YoY. The company’s total
assets rose by 10.56% YoY to QR10.55bn in FY2014. Similarly,
the shareholders’ equity registered an increase of 8% YoY to
QR6.76bn in FY2014. EPS amounted to QR13.41 in FY2014 as
compared to QR13.3 in FY2013. Meanwhile, the company’s
board has recommended the distribution of 90% cash dividend,
i.e. QR9.00/share. The dividend payout will sum up to
QR760mn and the recommendation will be placed before the
company’s general assembly, which is scheduled on March 15,
2015. Meanwhile, QFLS’ CEO, Ibrahim Jaham Al-Kuwari said
that the company is currently involved in the implementation of
as many as 39 projects under construction, while around 16 of
them are in design and approval stages. These projects include
new petrol stations, Fahes centers, Sidra C-Stores and bitumen
facilities. Further, the company said that it will set up seven
more compressed natural gas (CNG) stations within two years,
as part of its plan to develop the CNG sector under the
leadership of Qatar Petroleum. Some 13 fuel stations are under
construction across Qatar, while one is being built in
neighboring Saudi Arabia. The company said that some of
these fuel stations are expected to be opened in 2015 and the
rest in 2016. (Gulf-Times.com)
MCCS’ net profit rises 18% YoY to QR526mn in FY2014 –
Mannai Corporation (MCCS) a net profit of QR526mn in-line
with our estimate of QR518.9mn. Group revenues increased to
QR5.9bn. EPS amounted to QR11.54 in FY2014, reflecting an
increase of 18% YoY and return on equity stood at 24.3%.
Meanwhile, the company recommended QR6.00/share cash
dividend (in-line with our expectation) which will have to be
approved at the annual general assembly scheduled on March
22, 2015. (Gulf-Times.com)
DBIS’ net profit soars to QR66.8mn in FY2014,
recommends 28% bonus shares – Dlala Brokerage &
Investments Holding Company’s (DBIS) net profit surged to
QR66.8mn in FY2014, primarily due to higher net brokerage &
commission income and net investment income. The
company’s net brokerage & commission income grew strongly
to QR69.4mn in FY2014, showing an increase of 139.7% YoY,
while its investment income rose 17.4% YoY to QR26.2mn in
FY2014. Also, a 52.6% YoY decline in other expenses to
QR36.5mn contributed to net profit growth. EPS stood at
QR3.01 in FY2014 versus QR0.25 in FY2013. Meanwhile, the
company’s board recommended the distribution of 28% bonus
shares of the company’s capital. (QSE)
QGMD’s net loss widens in FY2014 – Qatar German
Company for Medical Devices’ (QGMD) net loss increased to
QR11.4mn in FY2014 from a net loss of QR9.4mn in FY2013.
The company reported a higher gross loss of QR0.9mn in
FY2014 versus QR0.3mn in FY2013 as a 38.6% YoY increase
in revenue (QR15.8mn) was overshadowed by a 42.5% YoY
rise in direct costs (QR16.7mn). The loss per share (LPS)
amounted to QR0.55 in FY2014 versus LPS of QR0.27 in
FY2013. (QSE)
WDAM’s net profit rises 13.3% YoY in FY2014,
recommends 2.50/share cash dividend – Widam Food
Company’s (WDAM) net profit increased by 13.3% YoY to
QR62.2mn in FY2014 on the back of higher government
compensation (up 8% YoY to QR361.6mn). The company’s
revenue rose 14.9% YoY to QR409.5mn in FY2014. EPS
amounted to QR3.46 in FY2014 as compared to QR3.05 in
FY2013. Meanwhile, WDAM’s board has recommended
distributing cash dividends of 2.50/share. (QSE)
QIBK to raise QR5bn through Sukuk, to relocate HQ to
Lusail City – Qatar Islamic Bank’s (QIBK) shareholders have
given the nod for raising up to QR5bn through a capital
boosting Sukuk. The bank’s extraordinary general assembly
gave the approval for the issuance of unlisted Sukuk that shall
be eligible for inclusion as the Addition Tier 1 Capital in
accordance with Basel III norms, as instructed by the Qatar
Central Bank. QIBK’s Chairman Sheikh Jassim bin Hamad bin
Jassim Jaber Al-Thani said that the bank is currently working
on issuing an ‘Additional Tier 1 Sukuk’ of up to QR2bn. Further,
the bank’s ordinary AGM and the EGM approved all the items
in the agenda, including the board of directors’ proposal to
distribute 4.25/share cash dividend. Meanwhile, QIBK is
planning to move its headquarters to the upcoming Lusail City
from its current location at the Grand Hamad Street. The bank
has also announced plans to open several new branches at
strategic locations across the country. (Peninsula Qatar)
Qatar Rail inks deal for Doha Metro driverless trains – A
consortium of five companies have signed an agreement to
build and deliver a fully-automated driverless metro system in
Doha, Qatar. The group consisting of Mitsubishi Heavy
Industries, Mitsubishi Corporation, Hitachi, Thales and The
Kinki Sharyo Co., has received a letter of conditional
acceptance from the Qatar Railways Company (Qatar Rail) for
the systems package of the metro project, which is slated for
completion in October 2019. (Bloomberg)
Qatar Holding, Nebras Power signs MoU with Japanese
firms – Nebras Power and Qatar Holding have signed a MoU
with Mitsubishi Corporation, Marubeni and Chubu Electric
Power of Japan to conduct a feasibility study on the possibility
of developing Afsin Elbistan project in Turkey. The MoU aims to
study the development, financing, construction, operation and
maintenance of coal mines and coal-operated power plants.
Located in Afisn Elbistan, southeast of the capital Ankara, the
project includes building around 4,500 MW power plants to
generate power and developing the coal mines in the project
area as the coal will be used as fuel for power generation.
(QSE)
3. Page 3 of 6
Qatar Stock Exchange
Top 5 Gainers Top 5 Decliners
Source: Qatar Stock Exchange (QSE) Source: Qatar Stock Exchange (QSE)
Most Active Shares by Value (QR Million) Most Active Shares by Volume (Million)
Source: Qatar Stock Exchange (QSE) Source: Qatar Stock Exchange (QSE)
Investor Trading Percentage to Total Value Traded Net Traded Value by Nationality (QR Million)
Source: Qatar Stock Exchange (QSE) Source: Qatar Stock Exchange (QSE)
6.7%
6.3%
5.9%
5.6%
4.1%
0.0%
3.0%
6.0%
9.0%
Qatari
Investors
Group
Medicare
Group
Qatar & Oman
Investment
Doha
Insurance
Qatar General
Insurance &
Reinsurance
-12.4%
-9.3%
-7.8%
-5.2%
-3.7%
-18.0%
-12.0%
-6.0%
0.0%
Qatar Cinema &
Film Distribution
Al Ahli Bank Qatar Fuel Widam Food Co. Ezdan Real
Estate
233.8
217.2
186.0
165.3
119.2
0.0
80.0
160.0
240.0
Vodafone
Qatar
Barwa Real
Estate
QNB Group Qatar
International
Islamic Bank
Qatar Fuel
13.2
4.4 4.4
2.4 2.4
0.0
5.0
10.0
15.0
Vodafone Qatar Ezdan Real
Estate
Barwa Real
Estate
Mazaya Qatar Masraf Al Rayan
0%
20%
40%
60%
80%
100%
Buy Sell
42.03% 43.48%
22.77% 24.61%
13.70%
14.05%
21.49% 17.86%
Qatari Individuals Qatari Institutions
Non-Qatari Individuals Non-Qatari Institutions
1,472
800
1,547
725
(75)
75
(200) - 200 400 600 800 1,000 1,200 1,400 1,600 1,800
Qatari
Non-Qatari
Net Investment Total Sold Total Bought
4. Page 4 of 6
TECHNICAL ANALYSIS OF THE QSE INDEX
Source: Bloomberg
The QSE Index was inactive for the most part of the week and traded in a thin range with low volumes. It ended the week at 12,445.34, losing 0.41% from
the previous week’s close. The Bearish Engulfing candlestick created the previous week had a marginal bearish effect on last week’s performance. Yet, it
could extend its impact in the coming week. Technical indicators remain flat. However, the 21SMA crossed below the 55SMA, which could have a bearish
effect in the foreseeable future. We expect the next resistance level at the 12,800 level while the support level is positioned at the 12,000 level.
DEFINITIONS OF KEY TERMS USED IN TECHNICAL ANALYSIS
RSI (Relative Strength Index) indicator – RSI is a momentum oscillator that measures the speed and change of price movements. The RSI oscillates
between 0 to 100. The index is deemed to be overbought once the RSI approaches the 70 level, indicating that a correction is likely. On the other hand, if
the RSI approaches 30, it is an indication that the index may be getting oversold and therefore likely to bounce back.
MACD (Moving Average Convergence Divergence) indicator – The indicator consists of the MACD line and a signal line. The divergence or the
convergence of the MACD line with the signal line indicates the strength in the momentum during the uptrend or downtrend, as the case may be. When the
MACD crosses the signal line from below and trades above it, it gives a positive indication. The reverse is the situation for a bearish trend.
Candlestick chart – A candlestick chart is a price chart that displays the high, low, open, and close for a security. The ‘body’ of the chart is portion between
the open and close price, while the high and low intraday movements form the ‘shadow’. The candlestick may represent any time frame. We use a one-day
candlestick chart (every candlestick represents one trading day) in our analysis.
Doji candlestick pattern – A Doji candlestick is formed when a security's open and close are practically equal. The pattern indicates indecisiveness, and
based on preceding price actions and future confirmation, may indicate a bullish or bearish trend reversal.
Shooting Star/Inverted Hammer candlestick patterns – These candlestick patterns have a small real body (open price and close price are near to each
other), and a long upper shadow (large intraday movement on the upside). The Shooting Star is a bearish reversal pattern that forms after a rally. The
Inverted Hammer looks exactly like a Shooting Star, but forms after a downtrend. Inverted Hammers represent a potential bullish trend reversal.
5. Page 5 of 6
Source: Bloomberg
Company Name
Price
(February 26)
% Change
5-Day
% Change
YTD
Market Cap.
QR Million TTM P/E P/B Div. Yield
Qatar National Bank 203.30 0.59 (4.51) 142,255 13.6 2.5 3.7
Qatar Islamic Bank 103.70 (2.54) 1.47 24,504 15.4 2.0 4.1
Commercial Bank of Qatar 69.00 1.17 0.73 20,489 10.9 1.2 2.4
Doha Bank 58.10 (0.34) 1.93 15,011 11.1 1.3 7.7
Al Ahli Bank 51.00 (0.18) 2.75 8,425 15.4 2.2 2.7
Qatar International Islamic Bank 86.70 (1.03) 6.12 13,124 15.9 2.4 4.3
Masraf Al Rayan 48.10 (1.23) 8.82 36,075 18.0 3.2 3.1
Al Khaliji Bank 21.79 (2.81) (1.18) 7,844 13.8 1.4 4.6
National Leasing 21.00 (3.27) 5.00 1,039 24.1 0.8 4.0
Dlala Holding 43.65 (3.11) 1.99 969 14.5 3.3 N/A
Qatar & Oman Investment 16.05 5.94 4.22 506 19.5 1.4 3.7
Islamic Holding Group 122.30 3.82 (1.77) 489 30.4 7.2 2.5
Banking and Financial Services 270,730
Zad Holding 90.20 1.92 7.38 1,180 10.9 0.9 3.9
Qatar German Co. for Medical Devices 11.05 1.38 8.87 128 N/A 0.8 N/A
Salam International Investment 14.45 (3.60) (8.83) 1,652 21.5 1.0 6.9
Medicare Group 155.30 6.30 32.74 4,371 24.1 4.7 1.2
Qatar Cinema & Film Distribution 41.00 (12.39) (6.82) 234 19.0 1.6 N/A
Qatar Fuel 204.70 (7.79) 0.20 17,289 15.3 2.6 3.8
Qatar Meat and Livestock 58.60 (5.18) (2.98) 1,055 16.9 3.9 3.6
Al Meera Consumer Goods 218.00 1.40 9.00 4,360 16.1 3.2 3.7
Consumer Goods and Services 30,268
Qatar Industrial Manufacturing 49.85 0.91 14.99 2,369 14.7 1.6 N/A
Qatar National Cement 137.00 (1.23) 3.79 6,727 16.0 2.6 4.4
Industries Qatar 155.00 1.11 (7.74) 93,775 14.8 2.8 7.1
Qatari Investors Group 44.90 6.65 8.45 5,582 24.7 2.5 1.7
Qatar Electricity and Water 190.50 (1.30) 1.60 20,955 13.3 3.1 3.9
Mannai Corp. 109.00 2.06 0.00 4,972 9.4 2.3 5.0
Aamal 18.45 0.65 21.46 11,070 19.3 1.5 N/A
Gulf International Services 95.40 (2.25) (1.75) 17,729 12.7 4.9 5.8
Mesaieed Petrochemical Holding 28.00 (0.53) -5.1 35,177 19.6 2.4 5.2
Industrials 198,357
Qatar Insurance 78.70 (16.01) (0.10) 12,635 14.5 2.5 2.8
Doha Insurance 28.50 5.56 (1.72) 1,425 11.1 1.3 7.1
Qatar General Insurance & Reinsurance 63.50 4.10 7.63 4,393 5.0 0.8 2.0
Al Khaleej Takaful Insurance 54.00 (0.18) 6.30 1,199 16.1 1.8 N/A
Qatar Islamic Insurance 86.00 (1.15) 8.86 1,290 17.6 4.1 4.4
Insurance 20,941
United Development 24.27 0.71 2.88 8,594 13.7 0.8 3.9
Barw a Real Estate 48.70 1.04 16.23 18,950 13.9 1.4 4.1
Ezdan Real Estate 16.13 (3.70) 8.11 42,785 31.8 1.4 1.9
Mazaya Qatar Real Estate Development 19.50 (1.22) 1.83 1,950 9.1 1.6 3.8
Real Estate 72,279
Qatar Telecom 114.50 0.88 (7.59) 36,677 14.4 1.5 3.5
Vodafone Qatar 17.73 1.90 7.78 14,989 N/A 2.7 1.0
Telecoms 51,666
Qatar Navigation (Milaha) 104.30 (0.19) 4.82 11,945 11.3 0.9 4.8
Gulf Warehousing 58.00 0.00 2.84 2,759 19.7 3.2 2.6
Qatar Gas Transport (Nakilat) 24.40 (0.08) 5.63 13,664 15.2 3.6 4.5
Transportation 28,368
Qatar Exchange 675,345
6. Contacts
Saugata Sarkar Abdullah Amin, CFA Shahan Keushgerian
Head of Research Senior Research Analyst Senior Research Analyst
Tel: (+974) 4476 6534 Tel: (+974) 4476 6569 Tel: (+974) 4476 6509
saugata.sarkar@qnbfs.com.qa abdullah.amin@qnbfs.com.qa shahan.keushgerian@qnbfs.com.qa
Badar Husain Sahbi Kasraoui Ahmed Al-Khoudary
Head of Trading Manager – HNWI Head of Sales Trading – Institutional
Tel: (+974) 4476 6547 Tel: (+974) 4476 6544 Tel: (+974) 4476 6548
badar.husain@qnbfs.com.qa sahbi.alkasraoui@qnbfs.com.qa ahmed.alkhoudary@qnbfs.com.qa
QNB Financial Services SPC
Contact Center: (+974) 4476 6666
PO Box 24025
Doha, Qatar
Disclaimer and Copyright Notice: This publication has been prepared by QNB Financial Services SPC (“QNBFS”) a wholly-owned subsidiary of QNB SAQ (“QNB”). QNBFS is
regulated by the Qatar Financial Markets Authority and the Qatar Exchange QNB SAQ is regulated by the Qatar Central Bank. This publication expresses the views and opinions of
QNBFS at a given time only. It is not an offer, promotion or recommendation to buy or sell securities or other investments, nor is it intended to constitute legal, tax, accounting, or
financial advice. QNBFS accepts no liability whatsoever for any direct or indirect losses arising from use of this report. Any investment decision should depend on the individual
circumstances of the investor and be based on specifically engaged investment advice. We therefore strongly advise potential investors to seek independent professional advice
before making any investment decision. Although the information in this report has been obtained from sources that QNBFS believes to be reliable, we have not independently
verified such information and it may not be accurate or complete. QNBFS does not make any representations or warranties as to the accuracy and completeness of the information
it may contain, and declines any liability in that respect. For reports dealing with Technical Analysis, expressed opinions and/or recommendations may be different or contrary to
the opinions/recommendations of QNBFS Fundamental Research as a result of depending solely on the historical technical data (price and volume). QNBFS reserves the right to
amend the views and opinions expressed in this publication at any time. It may also express viewpoints or make investment decisions that differ significantly from, or even
contradict, the views and opinions included in this report. This report may not be reproduced in whole or in part without permission from QNBFS
COPYRIGHT: No part of this document may be reproduced without the explicit written permission of QNBFS.
Page 6 of 6