

Recommended
More Related Content
What's hot
What's hot (20)
Viewers also liked
Viewers also liked (20)
Similar to Weekly market report
Similar to Weekly market report (20)
More from QNB Group
More from QNB Group (20)
Recently uploaded
Recently uploaded (20)
Weekly market report
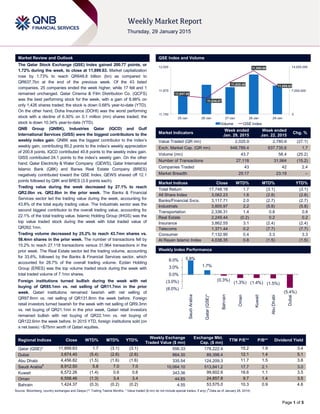
- 1. Page 1 of 5 Market Review and Outlook QSE Index and Volume The Qatar Stock Exchange (QSE) Index gained 200.77 points, or 1.72% during the week, to close at 11,899.63. Market capitalization rose by 1.73% to reach QR648.8 billion (bn) as compared to QR637.7bn at the end of the previous week. Of the 43 listed companies, 25 companies ended the week higher, while 17 fell and 1 remained unchanged. Qatar Cinema & Film Distribution Co. (QCFS) was the best performing stock for the week, with a gain of 8.98% on only 1,426 shares traded; the stock is down 0.68% year-to-date (YTD). On the other hand, Doha Insurance (DOHI) was the worst performing stock with a decline of 6.30% on 0.1 million (mn) shares traded; the stock is down 10.34% year-to-date (YTD). QNB Group (QNBK), Industries Qatar (IQCD) and Gulf International Services (GISS) were the biggest contributors to the weekly index gain. QNBK was the biggest contributor to the index’s weekly gain, contributing 80.2 points to the index’s weekly appreciation of 200.8 points. IQCD contributed 40.8 points to the weekly index gain. GISS contributed 24.1 points to the index’s weekly gain. On the other hand, Qatar Electricity & Water Company (QEWS), Qatar International Islamic Bank (QIIK) and Barwa Real Estate Company (BRES) negatively contributed toward the QSE Index. QEWS shaved off 12.1 points followed by QIIK and BRES (3.9 points each). Trading value during the week decreased by 27.1% to reach QR2.0bn vs. QR2.8bn in the prior week. The Banks & Financial Services sector led the trading value during the week, accounting for 43.8% of the total equity trading value. The Industrials sector was the second biggest contributor to the overall trading value, accounting for 22.1% of the total trading value. Islamic Holding Group (IHGS) was the top value traded stock during the week with total traded value of QR262.1mn. Trading volume decreased by 25.2% to reach 43.7mn shares vs. 58.4mn shares in the prior week. The number of transactions fell by 15.2% to reach 27,118 transactions versus 31,964 transactions in the prior week. The Real Estate sector led the trading volume, accounting for 33.6%, followed by the Banks & Financial Services sector, which accounted for 28.7% of the overall trading volume. Ezdan Holding Group (ERES) was the top volume traded stock during the week with total traded volume of 7.1mn shares. Foreign institutions turned bullish during the week with net buying of QR85.1mn vs. net selling of QR11.7mn in the prior week. Qatari institutions remained bearish with net selling of QR97.6mn vs. net selling of QR131.8mn the week before. Foreign retail investors turned bearish for the week with net selling of QR9.3mn vs. net buying of QR21.1mn in the prior week. Qatari retail investors remained bullish with net buying of QR22.1mn vs. net buying of QR122.6mn the week before. In 2015 YTD, foreign institutions sold (on a net basis) ~$75mn worth of Qatari equities. Market Indicators Week ended Jan. 29, 2015 Week ended Jan. 22, 2015 Chg. % Value Traded (QR mn) 2,025.9 2,780.6 (27.1) Exch. Market Cap. (QR mn) 648,789.4 637,735.6 1.7 Volume (mn) 43.7 58.4 (25.2) Number of Transactions 27,118 31,964 (15.2) Companies Traded 43 42 2.4 Market Breadth 25:17 23:19 – Market Indices Close WTD% MTD% YTD% Total Return 17,748.18 1.7 (3.1) (3.1) All Share Index 3,062.23 1.6 (2.8) (2.8) Banks/Financial Svcs. 3,117.71 2.0 (2.7) (2.7) Industrials 3,805.97 2.2 (5.8) (5.8) Transportation 2,336.31 1.4 0.8 0.8 Real Estate 2,249.44 (0.2) 0.2 0.2 Insurance 3,862.55 3.1 (2.4) (2.4) Telecoms 1,371.44 0.2 (7.7) (7.7) Consumer 7,132.90 0.4 3.3 3.3 Al Rayan Islamic Index 4,038.35 0.8 (1.5) (1.5) Market Indices Weekly Index Performance Regional Indices Close WTD% MTD% YTD% Weekly Exchange Traded Value ($ mn) Exchange Mkt. Cap. ($ mn) TTM P/E** P/B** Dividend Yield Qatar (QSE)* 11,899.63 1.7 (3.1) (3.1) 556.33 178,222.4 15.2 1.9 3.4 Dubai 3,674.40 (5.4) (2.6) (2.6) 864.30 89,398.4 12.1 1.4 5.1 Abu Dhabi 4,456.82 (1.5) (1.6) (1.6) 335.54 124,209.3 11.7 1.5 3.8 Saudi Arabia# 8,912.50 5.8 7.0 7.0 10,064.10 513,841.2 17.7 2.1 3.0 Kuwait 6,572.26 (1.4) 0.6 0.6 343.36 99,602.6 16.6 1.1 3.5 Oman 6,558.46 (1.3) 3.4 3.4 44.85 24,857.8 9.7 1.4 3.5 Bahrain 1,424.37 (0.3) (0.2) (0.2) 4.55 53,575.0 10.3 0.9 4.6 Source: Bloomberg, country exchanges and Zawya (** Trailing Twelve Months; * Value traded ($ mn) do not include special trades, if any) ( # Data as of January 28, 2014) 11,847.48 11,836.07 11,920.48 11,980.66 11,899.63 0 7,000,000 14,000,000 11,750 11,875 12,000 25-Jan 26-Jan 27-Jan 28-Jan 29-Jan Volume QSE Index 5.8% 1.7% (0.3%) (1.3%) (1.4%) (1.5%) (5.4%) (6.0%) (3.0%) 0.0% 3.0% 6.0% SaudiArabia Qatar(QSE)* Bahrain Oman Kuwait AbuDhabi Dubai
- 2. Page 2 of 5 News Economic News Finance Minister: No change in spending despite falling oil prices – The Minister of Finance HE Ali Shareef Al Emadi said despite the decline in oil prices, Qatar will continue the path of development and there will be no change in fiscal policy on spending or investment in infrastructure. He added that around $200bn has been approved for various development projects until 2022. He explained that these allocations would focus on transportation projects and infrastructure, including the railway network, the new port, health, education and sports facilities, including the establishment of stadiums for the 2022 FIFA World Cup. He further said that Qatar has important investments in the US and has plans to increase these investments over the next five years to exceed $35bn. (Peninsula Qatar) Market & Corporate News MARK’s net profit and dividend in-line with estimates – Masraf Al Rayan (MARK) posted a 17.6% rise in its FY2014 net profit to QR2.00bn vs. our estimate of QR1.98bn (Bloomberg consensus: QR1.93bn). EPS came in at QR2.67 vs. our estimate of QR2.64 and QR2.27 in 2013. Further, the bank’s board recommended a cash DPS of QR1.75/share (Yield of 4.0), in-line with our estimate. The bank’s total assets surged 20.4% YoY to QR80.1bn with its financing portfolio growing 39.7% YoY to QR57.9bn. Investments decreased by 10.6% from QR16.6bn to QR14.8bn, due to the maturity of government Sukuk (QR5bn) in 2014. Customer deposits grew 29.5% to QR62.6bn. Thus, the LDR stood at 92.6% vs. 92.7% in 2013. The bank generated an RoA of 2.50% and an RoE of 17.6%. The CAR reached 18.36% under Basel III standards as compared to 20.55% on December 31, 2013 under Basel II standards. MARK ended 2014 with an NPL ratio of 0.09%. We maintain our Market Perform rating for the stock with a Price Target of QR46.00. (Company Press Release, QNBFS Research) KCBK reports QR563mn net profit in 2014, recommends cash dividend of QR1.00/share – Al Khalij Commercial Bank (KCBK) reported a net profit of QR563mn in 2014 (+2.2% YoY) inline with our expectations. KCBK’s net operating income increased 8% YoY to exceed QR1bn, mainly driven by a 27% YoY growth in net interest income and a 39% YoY growth in net fee & commission income that reached QR749.5mn and QR198.1mn, respectively in 2014. EPS amounted to QR1.56 in 2014, up 2% YoY. The bank’s total assets reached QR51.2bn in 2014, up 24% on QR41.3bn registered in 2013. Loans & advances grew to QR26.9bn in 2014, reflecting an increase of 30% YoY, while deposits grew 38% YoY and stood at QR27.4bn in 2014. The bank’s capital adequacy ratio under Basel III was 15.3%. Meanwhile, KCBK’s board recommended the distribution of QR1.00/share cash dividend, in line with our estimate. (Gulf-Times.com) QEWS posts 11% YoY rise in 2014 net profit – Qatar Electricity & Water Company (QEWS) reported a net profit of QR1.53bn in FY2014, reflecting an increase of 11% YoY. The company’s board has recommended cash dividends of QR7.50 per share. The results and dividend were in line with our estimates. The board also discussed QEWS’s foreign investments in power and water projects through Nebras Power, in which QEWS owns 60% shares. Further, the board had approved the “partnership principle” between QEWS and Qatar Petroleum (QP) to establish a company for building solar power plants in Qatar. The feasibility study shall be completed and submitted to the board for its final go-ahead. The QEWS’ general assembly will be held on February 17. (Gulf- Times.com) QATI net profit rises 33.1% to QR1.0bn in FY2014 – Qatar Insurance Company (QATI) reported a 33.1% YoY rise in its FY2014 net profit to QR1.0bn, mainly driven by diversification of underwriting and strong investment earnings. The company’s gross written premiums grew 59.0% YoY to QR5.61bn, net underwriting grew by 37.6% to QR663.8mn and investment income grew by 45.3% YoY to QR846.3mn vs. QR582.4mn. QATI has grown its asset base to QR16.1bn in FY2014 from QR11.6bn in FY2013, while maintaining robust levels of profitability, liquidity and market capitalization. Meanwhile, the company’s board of directors has recommended distribution of cash dividend of QR2.50/share and bonus shares of 15%. (Gulf-Times.com, QNBFS Research) GDI signs contract with GLB to provide liftboat services – Gulf Drilling International Limited (GDI), a subsidiary of Gulf International Services (GISS), has signed a contract with Gulf LiftBoat (GLB) for the provision of liftboat services. The contract covers services that commenced in January 2015 and will continue till August 2015. The liftboat is being used by Dolphin Energy Limited (DEL) pursuant to a contract extension recently awarded to GDI, thereby providing DEL with the continued use of the liftboat over the same period. Liftboat services performed under this contract are providing DEL with vital support to its operations while enabling GDI to continue serving a growing business segment. The liftboat utilized by DEL under this contract will ultimately be replaced by a new Liftboat, Al Safliya that GDI has ordered and is under construction at NKOM Shipyard. GDI is scheduled to take delivery of Al Safliya in December 2015 and the vessel will immediately go to work for DEL under a five-year contact. (Peninsula Qatar) MARK and QInvest have announced their respective decisions to launch three separate investments funds – MARK announced that its board of directors approved the setting up of two investment funds. QInvest announced that it is launching a Shari’ah-compliant European Equities fund in partnership with Pioneer Investments. Pioneer will manage the fund and act as sub-advisor. MARK’s first fund is an exchange traded fund (ETF) that will be the largest in the market, trading Shari’ah-compliant stocks at Qatar Stock Exchange wherein tracking Al Rayan Islamic Index. The second fund is a Shari’ah- compliant Sukuk trading fund (income generating fund), for investment in fixed income markets with target yield exceeding earnings from deposit accounts and will be distributed annually to investors. Al Rayan investment (ARI) will manage both funds. The QInvest fund will focus on investing in pan-European blue- chip, mid and large-cap stocks. It will be actively managed by the specialist European Equity team at Pioneer Investments, with Andrew Arbuthnot as the Portfolio Manager. (Peninsula Qatar) Qatar Petroleum to absorb investment unit in sign of consolidation – Qatar Petroleum (QP) will absorb its wholly- owned subsidiary Qatar Petroleum International (QPI), a move suggesting authorities want to consolidate the industry given the plunging oil prices. The integration will see QPI's employees, assets and projects transition into the new QP organization commencing in March 2015. In the period before full integration, QPI's management and employees will continue to run the company's day-to-day operations. (Reuters)
- 3. Page 3 of 5 Qatar Stock Exchange Top 5 Gainers Top 5 Decliners Source: Qatar Stock Exchange (QSE) Source: Qatar Stock Exchange (QSE) Most Active Shares by Value (QR Million) Most Active Shares by Volume (Million) Source: Qatar Stock Exchange (QSE) Source: Qatar Stock Exchange (QSE) Investor Trading Percentage to Total Value Traded Net Traded Value by Nationality (QR Million) Source: Qatar Stock Exchange (QSE) Source: Qatar Stock Exchange (QSE) 9.0% 7.9% 4.8% 4.5% 4.2% 0.0% 4.0% 8.0% 12.0% Qatar Cinema & Film Distribution Aamal Qatar Insurance Gulf International Services QNB Group -6.3% -5.7% -4.9% -4.4% -4.2% -9.0% -6.0% -3.0% 0.0% Doha Insurance Islamic Holding Group Dlala Holding National Leasing Al Ahli Bank 262.1 229.2 155.4 152.5 126.8 0.0 100.0 200.0 300.0 Islamic Holding Group QNB Group Industries Qatar Barwa Real Estate Gulf International Services 7.1 5.1 3.5 3.4 2.3 0.0 3.0 6.0 9.0 Ezdan Real Estate Vodafone Qatar Mazaya Qatar Barwa Real Estate National Leasing 0% 20% 40% 60% 80% 100% Buy Sell 43.79% 42.70% 15.32% 20.14% 15.68% 16.14% 25.22% 21.02% Qatari Individuals Qatari Institutions Non-Qatari Individuals Non-Qatari Institutions 1,197 829 1,273 753 (76) 76 (200) - 200 400 600 800 1,000 1,200 1,400 Qatari Non-Qatari Net Investment Total Sold Total Bought
- 4. Page 4 of 5 TECHNICAL ANALYSIS OF THE QSE INDEX Source: Bloomberg The QSE Index ended the week 1.72% higher than the week before, standing at the 11,889.63 level. Volatility was at its minimum. Uncertainty remains to be a factor as the influence of oil prices on the market persists. Technical Indicators are showing some positive signs. The MACD, although below the zero line, is losing its bearish momentum and becoming flat which could be a start for a positive move. The RSI is trending down but starting to point north. The immediate support is positioned at 11,600 followed by 11,400. On the flipside, if the Index manages to close above the 12,000 level then it could face resistance at the 12,350 level. DEFINITIONS OF KEY TERMS USED IN TECHNICAL ANALYSIS RSI (Relative Strength Index) indicator – RSI is a momentum oscillator that measures the speed and change of price movements. The RSI oscillates between 0 to 100. The index is deemed to be overbought once the RSI approaches the 70 level, indicating that a correction is likely. On the other hand, if the RSI approaches 30, it is an indication that the index may be getting oversold and therefore likely to bounce back. MACD (Moving Average Convergence Divergence) indicator – The indicator consists of the MACD line and a signal line. The divergence or the convergence of the MACD line with the signal line indicates the strength in the momentum during the uptrend or downtrend, as the case may be. When the MACD crosses the signal line from below and trades above it, it gives a positive indication. The reverse is the situation for a bearish trend. Candlestick chart – A candlestick chart is a price chart that displays the high, low, open, and close for a security. The ‘body’ of the chart is portion between the open and close price, while the high and low intraday movements form the ‘shadow’. The candlestick may represent any time frame. We use a one-day candlestick chart (every candlestick represents one trading day) in our analysis. Doji candlestick pattern – A Doji candlestick is formed when a security's open and close are practically equal. The pattern indicates indecisiveness, and based on preceding price actions and future confirmation, may indicate a bullish or bearish trend reversal. Shooting Star/Inverted Hammer candlestick patterns – These candlestick patterns have a small real body (open price and close price are near to each other), and a long upper shadow (large intraday movement on the upside). The Shooting Star is a bearish reversal pattern that forms after a rally. The Inverted Hammer looks exactly like a Shooting Star, but forms after a downtrend. Inverted Hammers represent a potential bullish trend reversal.
- 5. Contacts Saugata Sarkar Abdullah Amin, CFA Shahan Keushgerian Head of Research Senior Research Analyst Senior Research Analyst Tel: (+974) 4476 6534 Tel: (+974) 4476 6569 Tel: (+974) 4476 6509 saugata.sarkar@qnbfs.com.qa abdullah.amin@qnbfs.com.qa shahan.keushgerian@qnbfs.com.qa Sahbi Kasraoui Ahmed Al-Khoudary QNB Financial Services SPC Manager – HNWI Head of Sales Trading – Institutional Contact Center: (+974) 4476 6666 Tel: (+974) 4476 6544 Tel: (+974) 4476 6548 PO Box 24025 sahbi.alkasraoui@qnbfs.com.qa ahmed.alkhoudary@qnbfs.com.qa Doha, Qatar Disclaimer and Copyright Notice: This publication has been prepared by QNB Financial Services SPC (“QNBFS”) a wholly-owned subsidiary of QNB SAQ (“QNB”). QNBFS is regulated by the Qatar Financial Markets Authority and the Qatar Exchange QNB SAQ is regulated by the Qatar Central Bank. This publication expresses the views and opinions of QNBFS at a given time only. It is not an offer, promotion or recommendation to buy or sell securities or other investments, nor is it intended to constitute legal, tax, accounting, or financial advice. QNBFS accepts no liability whatsoever for any direct or indirect losses arising from use of this report. Any investment decision should depend on the individual circumstances of the investor and be based on specifically engaged investment advice. We therefore strongly advise potential investors to seek independent professional advice before making any investment decision. Although the information in this report has been obtained from sources that QNBFS believes to be reliable, we have not independently verified such information and it may not be accurate or complete. QNBFS does not make any representations or warranties as to the accuracy and completeness of the information it may contain, and declines any liability in that respect. For reports dealing with Technical Analysis, expressed opinions and/or recommendations may be different or contrary to the opinions/recommendations of QNBFS Fundamental Research as a result of depending solely on the historical technical data (price and volume). QNBFS reserves the right to amend the views and opinions expressed in this publication at any time. It may also express viewpoints or make investment decisions that differ significantly from, or even contradict, the views and opinions included in this report. This report may not be reproduced in whole or in part without permission from QNBFS. COPYRIGHT: No part of this document may be reproduced without the explicit written permission of QNBFS. Page 5 of 5 Source: Bloomberg Com pany Nam e Price (January 29) % Change 5-Day % Change YTD Market Cap. QR Million TTM P/E P/B Div. Yield Qatar National Bank 198.00 4.16 (7.00) 138,546 13.2 2.4 3.5 Qatar Islamic Bank 103.00 (0.48) 0.78 24,338 15.3 1.9 3.9 Commercial Bank of Qatar 67.50 3.21 (1.46) 20,043 11.1 1.2 2.5 Doha Bank 58.50 1.74 2.63 15,115 11.2 1.3 7.7 Al Ahli Bank 56.40 (4.24) 3.30 9,317 15.5 2.2 N/A Qatar International Islamic Bank 77.50 (1.27) (5.14) 11,731 14.5 2.2 4.8 Masraf Al Rayan 44.80 2.05 1.36 33,600 16.8 3.0 3.3 Al Khaliji Bank 21.73 0.14 (1.45) 7,823 13.8 1.4 4.6 National Leasing 20.60 (4.36) 3.00 1,019 25.4 0.8 7.3 Dlala Holding 43.00 (4.87) 0.47 955 12.0 3.2 N/A Qatar & Oman Investment 15.32 2.13 (0.52) 483 19.2 1.3 3.9 Islamic Holding Group 120.00 (5.66) (3.61) 480 29.9 7.1 1.4 Banking and Financial Services 263,450 Zad Holding 87.50 3.92 4.17 1,145 10.6 0.9 4.0 Qatar German Co. for Medical Devices 9.57 (0.31) (5.71) 111 N/M 0.7 N/A Salam International Investment 16.40 2.50 3.47 1,875 25.6 1.1 6.1 Medicare Group 124.00 0.49 5.98 3,490 23.4 4.1 1.5 Qatar Cinema & Film Distribution 43.70 8.98 (0.68) 250 21.0 1.7 N/A Qatar Fuel 212.00 0.24 3.77 17,905 15.6 2.7 3.6 Qatar Meat and Livestock 59.20 (2.95) (1.99) 1,066 19.9 4.2 3.5 Al Meera Consumer Goods 200.00 (1.23) 0.00 4,000 14.8 2.9 4.0 Consum er Goods and Services 29,840 Qatar Industrial Manufacturing 45.70 2.01 5.42 2,172 11.1 1.4 N/A Qatar National Cement 133.00 1.29 0.76 6,530 14.6 2.5 4.5 Industries Qatar 149.20 2.83 (11.19) 90,266 14.1 2.8 7.4 Qatari Investors Group 38.40 (0.52) (7.25) 4,774 22.4 2.2 2.0 Qatar Electricity and Water 188.50 (2.84) 0.53 20,735 13.2 3.1 3.6 Mannai Corp. 103.50 0.00 (5.05) 4,722 8.9 2.3 5.3 Aamal 14.55 7.86 (4.21) 8,730 16.1 1.2 N/A Gulf International Services 100.00 4.49 2.99 18,584 18.6 5.2 1.6 Mesaieed Petrochemical Holding 27.30 0.74 -7.5 34,297 N/A 2.4 1.3 Industrials 190,810 Qatar Insurance 88.00 4.76 (2.87) 14,128 14.1 2.5 2.3 Doha Insurance 26.00 (6.31) (10.34) 1,300 10.1 1.2 7.7 Qatar General Insurance & Reinsurance 58.90 1.55 (0.17) 4,074 2.7 0.7 2.1 Al Khaleej Takaful Insurance 51.80 3.81 1.97 1,150 13.1 1.6 N/A Qatar Islamic Insurance 80.40 (0.12) 1.77 1,206 14.7 4.0 4.7 Insurance 21,858 United Development 24.11 0.29 2.20 8,537 22.7 0.8 4.0 Barw a Real Estate 44.05 (0.68) 5.13 17,141 12.5 1.2 4.5 Ezdan Real Estate 14.51 (0.07) (2.75) 38,488 28.6 1.2 2.1 Mazaya Qatar Real Estate Development 20.12 (0.89) 5.07 2,012 9.4 1.6 3.7 Real Estate 66,178 Qatar Telecom 115.00 0.17 (7.18) 36,837 14.5 1.5 3.5 Vodafone Qatar 14.90 0.13 (9.42) 12,596 N/M 2.3 1.1 Telecom s 49,433 Qatar Navigation (Milaha) 100.00 3.63 0.50 11,453 11.4 0.9 5.0 Gulf Warehousing 56.00 1.82 (0.71) 2,663 19.0 3.1 2.7 Qatar Gas Transport (Nakilat) 23.40 (0.34) 1.30 13,104 14.9 3.3 4.7 Transportation 27,220 Qatar Exchange 648,789