1. `
Page 1 of 6
Market Review and Outlook QSE Index and Volume
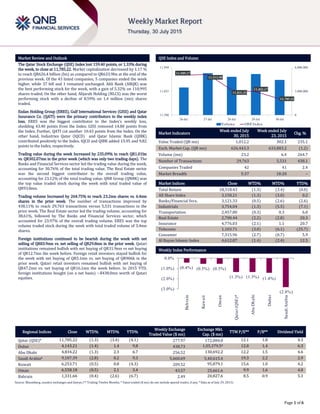
The Qatar Stock Exchange (QSE) Index lost 159.40 points, or 1.33% during
the week, to close at 11,785.22. Market capitalization decreased by 1.17 %
to reach QR626.4 billion (bn) as compared to QR633.9bn at the end of the
previous week. Of the 43 listed companies, 5 companies ended the week
higher, while 37 fell and 1 remained unchanged. Ahli Bank (ABQK) was
the best performing stock for the week, with a gain of 5.32% on 110,995
shares traded. On the other hand, Alijarah Holding (NLCS) was the worst
performing stock with a decline of 8.59% on 1.4 million (mn) shares
traded.
Ezdan Holding Group (ERES), Gulf International Services (GISS) and Qatar
Insurance Co. (QATI) were the primary contributors to the weekly index
loss. ERES was the biggest contributor to the Index’s weekly loss,
shedding 43.40 points from the Index. GISS removed 14.80 points from
the Index. Further, QATI cut another 10.43 points from the Index. On the
other hand, Industries Qatar (IQCD) and Qatar Islamic Bank (QIBK)
contributed positively to the Index. IQCD and QIBK added 15.95 and 9.82
points to the Index, respectively.
Trading value during the week Increased by 235.09% to reach QR1.01bn
vs. QR302.07mn in the prior week (which was only two trading days). The
Banks and Financial Services sector led the trading value during the week,
accounting for 30.76% of the total trading value. The Real Estate sector
was the second biggest contributor to the overall trading value,
accounting for 23.12% of the total trading value. QNB Group (QNBK) was
the top value traded stock during the week with total traded value of
QR93.8mn.
Trading volume Increased by 264.75% to reach 23.2mn shares vs. 6.4mn
shares in the prior week. The number of transactions improved by
438.11% to reach 29,763 transactions versus 5,531 transactions in the
prior week. The Real Estate sector led the trading volume, accounting for
38.61%, followed by The Banks and Financial Services sector, which
accounted for 23.97% of the overall trading volume. ERES was the top
volume traded stock during the week with total traded volume of 3.4mn
shares.
Foreign institutions continued to be bearish during the week with net
selling of QR83.9mn vs. net selling of QR29.8mn in the prior week. Qatari
institutions remained bullish with net buying of QR31.9mn vs net buying
of QR12.7mn the week before. Foreign retail investors stayed bullish for
the week with net buying of QR5.1mn vs. net buying of QR906k in the
prior week. Qatari retail investors remained bullish with net buying of
QR47.2mn vs. net buying of QR16.1mn the week before. In 2015 YTD,
foreign institutions bought (on a net basis) ~$438.0mn worth of Qatari
equities.
Market Indicators
Week ended July
30, 2015
Week ended July
23, 2015
Chg. %
Value Traded (QR mn) 1,012.2 302.1 235.1
Exch. Market Cap. (QR mn) 626,443.3 633,883.2 (1.2)
Volume (mn) 23.2 6.4 264.7
Number of Transactions 29,763 5,531 438.1
Companies Traded 42 41 2.4
Market Breadth 5:37 18:20 –
Market Indices Close WTD% MTD% YTD%
Total Return 18,318.43 (1.3) (3.4) (0.0)
All Share Index 3,158.21 (1.3) (3.0) 0.2
Banks/Financial Svcs. 3,121.33 (0.5) (2.6) (2.6)
Industrials 3,754.04 (1.3) (5.5) (7.1)
Transportation 2,457.80 (0.3) 0.3 6.0
Real Estate 2,700.44 (2.2) (2.8) 20.3
Insurance 4,776.03 (2.1) 1.1 20.7
Telecoms 1,103.71 (3.0) (6.1) (25.7)
Consumer 7,315.96 (2.7) (0.7) 5.9
Al Rayan Islamic Index 4,612.87 (1.4) (2.4) 12.5
Market Indices
Weekly Index Performance
Regional Indices Close WTD% MTD% YTD%
Weekly Exchange
Traded Value ($ mn)
Exchange Mkt.
Cap. ($ mn)
TTM P/E** P/B** Dividend Yield
Qatar (QSE)* 11,785.22 (1.3) (3.4) (4.1) 277.97 172,084.0 12.1 1.8 4.3
Dubai 4,143.21 (1.4) 1.4 9.8 438.73 1,05,379.5# 12.0 1.4 6.3
Abu Dhabi 4,834.22 (1.3) 2.3 6.7 256.52 130,692.2 12.2 1.5 4.6
Saudi Arabia# 9,107.39 (2.8) 0.2 9.3 5,660.69 5,40,615.4 19.3 2.2 2.9
Kuwait 6,253.71 (0.5) 0.8 (4.3) 209.52 95,879.1 15.6 1.0 4.2
Oman 6,558.18 (0.5) 2.1 3.4 43.57 25,661.6 9.9 1.6 4.0
Bahrain 1,331.66 (0.4) (2.6) (6.7) 2.49 20,827.6 8.5 0.9 5.3
Source: Bloomberg, country exchanges and Zawya (** Trailing Twelve Months; * Value traded ($ mn) do not include special trades, if any; # Data as of July 29, 2015)
11,909.17
11,913.58
11,831.33
11,822.17
11,785.22
0
3,000,000
6,000,000
11,700
11,825
11,950
26-Jul 27-Jul 28-Jul 29-Jul 30-Jul
Volume QSEIndex
(0.4%) (0.5%) (0.5%)
(1.3%) (1.3%) (1.4%)
(2.8%)
(3.0%)
(2.0%)
(1.0%)
0.0%
Bahrain
Kuwait
Oman
Qatar(QSE)*
AbuDhabi
Dubai
SaudiArabia
2. Page 2 of 6
News
Economic News
QCB real estate price index hits record high – Qatar’s real estate
price value rebounded by 23.5% YoY in June 2015 after softening
a bit in April 2015. The Qatar Central Bank (QCB) updated the real
estate price index, which tracks Qatar’s real estate market value.
The bank noted that the index hit a record high of 284.0 points in
June 2015 compared to 230.6 points in June 2014. The QCB’s real
estate index witnessed a slowdown during April 2015. The index
slipped to 269.5 points in April 2015 from the previous month’s
271.3 points. The index rose by 27.7 points in May, before
jumping to 284.0 points in June. The QCB index performance is a
reflection of the surging value of the country’s real estate market.
(Peninsula Qatar)
MDPS: Qatar machinery, equipment index edges higher in 1H2015
– According to statistics released by the Ministry of Development
Planning & Statistics (MDPS), higher prices, especially for special
purpose machines such as underground rock cutters and
earthmovers as well as machinery like electric motors, led Qatar
to register a 0.69% YoY increase in the Machinery & Equipment
Index (MEPI) in 1H2015. MDPS said the MEPI, which is calculated
semi-annually, had shown a 0.39% increase compared to 2H2014.
Under the new indicator, office, accounting and computing
machinery group carries the maximum weight of 41.45%
followed by transport equipment (28.34%), special purpose
machines (22.78%) and machinery and electrical appliances
(7.43%). The special purpose machines saw their index expand by
1.58% YoY owing to a 1.99% increase in the prices of
underground rock cutters and tunneling machinery; 1.58% in
mining and quarrying machinery and 1.48% in excavators,
bulldozers and such other equipment. The special purpose
machines index grew by 0.39% on the back of 1.89% rise in the
price of underground rock cutters and tunneling machinery;
0.39% in mining and quarrying machinery and 0.19% in
excavators, bulldozers and such other equipments against
2H2014. (Gulf-Times.com)
GOIC: Qatar ranks second in manufacturing sector investments in
GCC – According to GCC manufacturing industries report by the
Gulf Organization for Industrial Consulting (GOIC), Qatar is
ranked second in terms of the size of investments. Qatar, at
21.7%, is second only to Saudi Arabia (55.3%) in terms of the size
of investments in manufacturing sector. The GOIC Secretary
General Abdulaziz bin Hamad al-Ageel noted that GOIC, in
collaboration with Qatar’s Ministry of Environment, the GCC
Standardization Organization and Gulf Association for Metrology
(GULFMET) will hold the first Gulf Metrology Forum in Doha in
December. Through this event, experts hope to shed light on the
importance of metrology in guaranteeing industrial development
in GCC countries. Further, GOIC and ICIS will organize the first
Middle East Surfactants Summit in Qatar in October 2015. (Gulf-
Times.com)
Market & Corporate News
VFQS reports a net loss of QR99.9mn in 1QFY2016 – Vodafone
(VFQS) reported a higher net loss of QR99.9mn in 1QFY2016
compared to a net loss of QR66.0mn in March 2015 and our
estimate of a net loss of QR57.2mn (Bloomberg mean estimate:
QR42.8mn). The company’s revenue declined 5.8% QoQ and 8.0%
YoY to QR537.9mn in June 2015 (a 6.8% divergence vs. our
estimate). Led by the decline in net revenue, the company’s
EBITDA decreased to QR110.1mn in June 2015 compared to
QR145.8mn in March 2015 and QR159.1mn in June 2014,
representing a QoQ decline of 24.5% and a YoY decline of 30.8%.
The company’s loss per share amounted to QR0.12 in 1QFY2016
versus QR0.03 in 1QFY2015. VFQS continues to report below
forecast results, facing significant competition and market share
erosion from ORDS. We rate the stock a Market Perform with a
QR14.60 price target and believe company fundamentals do not
justify its current market price. (QNBFS Research, Company
Financials)
ORDS reports QR501.22mn net profit in 2Q2015 – Ooredoo (ORDS)
reported a net profit of QR501.22mn in 2Q2015 as compared to a
net profit of QR501.16mn in 1Q2015 and QR817.39mn in 2Q2014.
ORDS net profit increased marginally on a QoQ basis, however it
plunged 38.7% on a YoY basis. The YoY profit slump at the former
monopoly follows difficulties in North Africa and war-torn Iraq
and sharp declines in the Indonesian rupiah. The company’s
revenue stood at QR8.0bn, reflecting a decrease of 0.4% QoQ and
4.7% YoY. Also, EBITDA declined 7% YoY to QR3,251mn in
2Q2015 while EBITDA margin stood at 41% in 2Q2015 against
42% in 2Q2014. The company’s EPS amounted to QR1.56 in
2Q2015 versus QR1.56 in 1Q2015. On the other hand, the
company’s customer base increased from 94.3mn in 2Q2014 to
114.2mn in 2Q2015 driven by strong performances in Indonesia,
Myanmar and Algeria. (Company Financials & Press Release,
QNBFS Research, Reuters)
SIIS net profit declines 48.1% QoQ in 2Q2015 – Salam International
Investment Limited’s (SIIS) operating income declined 1.3% QoQ
(up 2.8% YoY) in 2Q2015 to reach QR623.2mn. Also, the
company’s other income fell 89.7% QoQ and 47.0% YoY to
QR0.8mn in 2Q2015. Net profit stood at QR15.4mn, representing a
decline of 48.1% QoQ and 10.8% YoY in 2Q2015. Consequently,
earnings per share (EPS) declined to QR0.13 in 2Q2015 from
QR0.26 in 1Q2015. Meanwhile, in a preliminary approval, the
Board of Directors has approved investment worth QR33.7mn to
acquire small residential real estate in Doha. (QSE, Company Press
Release, QNBFS Research)
Milaha’s net profit surges 69.6% YoY but declines 21.4% QoQ in
2Q2015 – Qatar Navigation’s (Milaha) net profit fell 21.4% QoQ to
QR286.4mn in 2Q2015. The net profit declined as operating
revenue fell 8.2% QoQ (up 32.3% YoY) to QR721.4mn while
operating expenses rose 10.3% QoQ (+16.2% YoY) to
QR558.6mn. The rise in operating expense was partially due to
the company booking an expense of QR37.9mn on vessel
impairment in 2Q2015. Net profit surged 69.6% YoY in 2Q2015.
Earnings per share (EPS) declined to QR2.52 in 2Q2015 from
QR3.21 in 1Q2015. Milaha’s Chairman Sheikh Ali bin Jassim al
Thani said that the company’s management team remains focused
and committed to various Milaha segments with a particular
emphasis on gas transportation, container shipping, offshore,
warehousing and logistics. (QNBFS Research, QSE, Qatar Tribune)
ERES net profit plummeted 35.8% QoQ in 2Q2015 – Ezdan Holding
Group’s (ERES) net profit plummeted 35.8% QoQ to QR335.7mn
in 2Q2015, primarily due to lower dividend income from
available-for-sale financial assets (QR0.2mn in 2Q2015 against
QR183.6mn in 1Q2015) and increased G&A expenses (up by
104.8% QoQ to QR78.0mn in 2Q2015) along with higher finance
costs (up by 34.8% QoQ to QR93.9mn in 2Q2015). However, the
net profit surged 30.4% YoY in 2Q2015. The company’s rental
income grew 6.6% QoQ (up 13.9% YoY) to QR386.9mn in 2Q2015
while its share of results of equity-accounted investees surged
60.6% QoQ (up 69.6%YoY) to QR121.0mn. Earnings per share
(EPS) amounted to QR0.13 in 2Q2015 versus QR0.20 in 1Q2015.
(QSE, QNBFS Research)
3. Page 3 of 6
Qatar Stock Exchange
Top Gainers Top Decliners
Source: Qatar Stock Exchange (QSE) Source: Qatar Stock Exchange (QSE)
Most Active Shares by Value (QR Million) Most Active Shares by Volume (Million)
Source: Qatar Stock Exchange (QSE) Source: Qatar Stock Exchange (QSE)
Investor Trading Percentage to Total Value Traded Net Traded Value by Nationality (QR Million)
Source: Qatar Stock Exchange (QSE) Source: Qatar Stock Exchange (QSE)
5.3%
1.5% 1.4%
1.2%
0.8%
0.0%
2.0%
4.0%
6.0%
Al Ahli Bank Milaha Qatar Islamic
Bank
Industries
Qatar
United
Development
-8.6%
-5.7%
-4.7% -4.6%
-4.1%
-9.0%
-6.0%
-3.0%
0.0%
National Leasing Gulf International
Services
Qatar Fuel Qatari Investors
Group
Vodafone Qatar
93.8
78.1 77.7 75.0
60.2
0.0
40.0
80.0
120.0
QNB Group Barwa Real
Estate
United
Development
Gulf
International
Services
Ezdan Real
Estate
3.4
3.0
1.9
1.5 1.4
0.0
1.5
3.0
4.5
Ezdan Real
Estate
United
Development
Vodafone
Qatar
Barwa Real
Estate
National
Leasing
0%
20%
40%
60%
80%
100%
Buy Sell
42.70% 38.03%
24.33%
21.20%
14.57%
14.07%
18.41%
26.70%
Qatari Individuals Qatari Institutions
Non-Qatari Individuals Non-Qatari Institutions
678
334
600
413
79
(79)
(200) - 200 400 600 800
Qatari
Non-Qatari
Net Investment Total Sold Total Bought
4. Page 4 of 6
TECHNICAL ANALYSIS OF THE QSE INDEX
Source: Bloomberg
Although it dropped on low volumes, the Index dipped 1.3% vs. the week before. Furthermore, it breached the 11,800 strong support level. The MACD is below
the zero on the weekly chart which has negative connotation, yet the RSI is still flat and close to the neutral area. As a result, we are more inclined to expect
further correction, and update our weekly support and resistance levels between 11,230 and 12,000 points, respectively.
DEFINITIONS OF KEY TERMS USED IN TECHNICAL ANALYSIS
RSI (Relative Strength Index) indicator – RSI is a momentum oscillator that measures the speed and change of price movements. The RSI oscillates between 0 to
100. The index is deemed to be overbought once the RSI approaches the 70 level, indicating that a correction is likely. On the other hand, if the RSI approaches
30, it is an indication that the index may be getting oversold and therefore likely to bounce back.
MACD (Moving Average Convergence Divergence) indicator – The indicator consists of the MACD line and a signal line. The divergence or the convergence of the
MACD line with the signal line indicates the strength in the momentum during the uptrend or downtrend, as the case may be. When the MACD crosses the signal
line from below and trades above it, it gives a positive indication. The reverse is the situation for a bearish trend.
Candlestick chart – A candlestick chart is a price chart that displays the high, low, open, and close for a security. The ‘body’ of the chart is portion between the
open and close price, while the high and low intraday movements form the ‘shadow’. The candlestick may represent any time frame. We use a one-day
candlestick chart (every candlestick represents one trading day) in our analysis.
Doji candlestick pattern – A Doji candlestick is formed when a security's open and close are practically equal. The pattern indicates indecisiveness, and based on
preceding price actions and future confirmation, may indicate a bullish or bearish trend reversal.
Shooting Star/Inverted Hammer candlestick patterns – These candlestick patterns have a small real body (open price and close price are near to each other),
and a long upper shadow (large intraday movement on the upside). The Shooting Star is a bearish reversal pattern that forms after a rally. The Inverted Hammer
looks exactly like a Shooting Star, but forms after a downtrend. Inverted Hammers represent a potential bullish trend reversal.
5. Page 5 of 6
Source: Bloomberg
Company Name
Price
(July 30)
% Change 5-
Day
% Change
YTD
Market Cap.
QR Million TTM P/E P/B Div. Yield
Qatar National Bank 182.50 (0.82) (14.28) 127,701 11.6 2.3 4.1
Qatar Islamic Bank 109.50 1.39 7.14 25,874 14.8 1.8 3.9
Commercial Bank of Qatar 54.20 (1.28) (12.96) 17,703 9.4 1.1 5.9
Doha Bank 53.00 (1.12) (7.02) 13,694 10.0 1.0 7.5
Al Ahli Bank 50.50 5.32 1.74 9,177 14.4 2.2 2.7
Qatar International Islamic Bank 77.90 (1.27) (4.65) 11,792 13.7 2.3 5.1
Masraf Al Rayan 45.00 (1.32) 1.81 33,750 16.1 3.4 3.9
Al Khaliji Bank 22.43 (0.31) 1.72 8,075 13.3 1.4 4.5
National Leasing 18.51 (8.59) (7.45) 916 33.1 0.8 4.6
Dlala Holding 26.10 (3.69) (21.94) 742 13.2 2.5 N/A
Qatar & Oman Investment 15.85 (1.67) 2.92 499 16.3 1.4 5.0
Islamic Holding Group 132.20 (1.12) 6.18 529 36.3 8.5 2.3
Banking and Financial Services 250,451
Zad Holding 99.70 (2.73) 18.69 1,304 11.8 1.6 4.0
Qatar German Co. for Medical Devices 16.21 (3.80) 59.70 187 N/A 1.2 N/A
Salam International Investment 13.98 (0.14) (11.80) 1,598 20.5 1.0 4.3
Medicare Group 186.60 (0.74) 59.49 5,252 26.7 5.9 1.0
Qatar Cinema & Film Distribution 42.50 0.00 6.25 267 21.4 1.9 2.1
Qatar Fuel 164.70 (4.74) (19.38) 13,910 12.2 2.1 5.5
Qatar Meat and Livestock 61.60 (0.48) 1.99 1,109 20.5 4.3 4.1
Al Meera Consumer Goods 270.50 (0.95) 35.25 5,410 23.5 4.3 3.3
Consumer Goods and Services 29,037
Qatar Industrial Manufacturing 46.00 (1.60) 6.11 2,186 13.2 1.6 6.5
Qatar National Cement 119.00 (0.50) (0.83) 6,427 15.1 2.4 3.1
Industries Qatar 135.30 1.20 (19.46) 81,857 14.3 2.7 5.2
Qatari Investors Group 50.10 (4.57) 21.01 6,229 26.6 2.7 1.5
Qatar Electricity and Water 220.90 (1.78) 17.81 24,299 15.2 3.7 3.4
Mannai Corp. 109.10 (0.27) 0.09 4,977 9.2 2.4 5.5
Aamal 14.64 (3.49) 1.20 9,223 14.6 1.3 6.5
Gulf International Services 69.00 (5.74) (28.94) 12,823 8.1 3.6 8.0
Mesaieed Petrochemical Holding 23.51 (2.04) -20.3 29,536 20.4 2.2 4.7
Industrials 177,557
Qatar Insurance 98.30 (2.67) 24.77 18,148 19.2 3.2 2.2
Doha Insurance 26.00 (0.76) (10.34) 1,300 14.7 1.2 3.8
Qatar General Insurance & Reinsurance 55.50 (0.72) 8.18 4,415 4.7 0.8 3.2
Al Khaleej Takaful Insurance 41.95 (1.99) (5.03) 1,071 14.4 1.7 3.1
Qatar Islamic Insurance 82.20 (0.36) 4.05 1,233 14.7 4.3 4.9
Insurance 26,167
United Development 25.30 0.80 7.25 8,958 13.1 0.8 4.9
Barw a Real Estate 50.00 (1.77) 19.33 19,456 3.1 1.1 4.4
Ezdan Real Estate 17.55 (2.99) 17.63 46,551 31.9 1.6 2.3
Mazaya Qatar Real Estate Development 18.00 (3.33) (1.31) 1,890 10.9 1.4 1.6
Real Estate 76,856
Qatar Telecom 80.60 (2.54) (34.95) 25,818 18.1 1.2 5.0
Vodafone Qatar 15.73 (4.09) (4.38) 13,298 N/A 2.4 1.3
Telecoms 39,116
Qatar Navigation (Milaha) 99.60 1.53 0.10 11,407 9.6 0.8 5.5
Gulf Warehousing 73.10 (3.56) 29.61 3,477 21.7 3.9 2.0
Qatar Gas Transport (Nakilat) 22.10 (0.90) (4.33) 12,376 13.0 3.1 5.4
Transportation 27,259
Qatar Exchange 626,443
6. Contacts
Saugata Sarkar Sahbi Kasraoui QNB Financial Services SPC
Head of Research Head of HNI Contact Center: (+974) 4476 6666
Tel: (+974) 4476 6534 Tel: (+974) 4476 6544 PO Box 24025
saugata.sarkar@qnbfs.com.qa sahbi.alkasraoui@qnbfs.com.qa Doha, Qatar
Disclaimer and Copyright Notice: This publication has been prepared by QNB Financial Services SPC (“QNBFS”) a wholly-owned subsidiary of QNB SAQ (“QNB”). QNBFS is regulated by the Qatar
Financial Markets Authority and the Qatar Exchange QNB SAQ is regulated by the Qatar Central Bank. This publication expresses the views and opinions of QNBFS at a given time only. It is not an offer,
promotion or recommendation to buy or sell securities or other investments, nor is it intended to constitute legal, tax, accounting, or financial advice. QNBFS accepts no liability whatsoever for any
direct or indirect losses arising from use of this report. Any investment decision should depend on the individual circumstances of the investor and be based on specifically engaged investment advice.
We therefore strongly advise potential investors to seek independent professional advice before making any investment decision. Although the information in this report has been obtained from
sources that QNBFS believes to be reliable, we have not independently verified such information and it may not be accurate or complete. QNBFS does not make any representations or warranties as to
the accuracy and completeness of the information it may contain, and declines any liability in that respect. For reports dealing with Technical Analysis, expressed opinions and/or recommendations
may be different or contrary to the opinions/recommendations of QNBFS Fundamental Research as a result of depending solely on the historical technical data (price and volume). QNBFS reserves the
right to amend the views and opinions expressed in this publication at any time. It may also express viewpoints or make investment decisions that differ significantly from, or even contradict, the views
and opinions included in this report. This report may not be reproduced in whole or in part without permission from QNBFS
COPYRIGHT: No part of this document may be reproduced without the explicit written permission of QNBFS.
Page 6 of 6