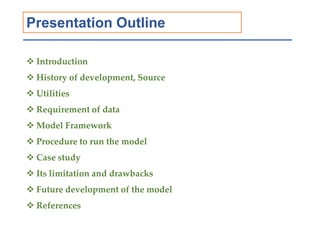
The document provides an outline for a presentation on the SWAT (Soil and Water Assessment Tool) hydrological model. It begins with an introduction to hydrological modeling and the development and utilities of the SWAT model. It describes the data requirements, model framework, and step-by-step procedure to run the model. A case study applying the SWAT model to the Simly Dam watershed in Pakistan is summarized. The limitations and future developments of the SWAT model are briefly discussed, followed by references.
2. Presentation Outline
Introduction
History of development, Source
Utilities
Requirement of data
Model Framework
Procedure to run the model
Case study
Its limitation and drawbacks
Future development of the model
References
3. Introduction
Hydrological modelling is a powerful technique for
planning and development of integrated approach for
management of water resources.
The Soil and Water Assessment Tool (SWAT) is a small
watershed to river basin-scale model developed by the
United States Department of Agriculture – Agricultural
Research Services (USDA – ARS).
4. Development of SWAT model is an ongoing process and it is the
successor of “the Simulator for Water Resources in Rural Basins”
model (SWRRB).
5. It is designed to predict the impact of land use and management on
water, sediment, and agricultural chemical yields in ungauged
watersheds.
The model breaks the entire catchment in to sub catchments which
are further divided in to hydrologic response units (HRU), land
use, vegetation and soil characteristics.
It is semi distributed, physically and process based and data driven
river basin model.
It is a continuous time model that operates on a daily time step.
It is computationally efficient, and capable of continuous
simulation over long time periods.
6. Go to SWAT website: https://swat.tamu.edu/
SWAT is a public domain software enabled model actively
supported by the USDA Agricultural Research Service at the
Blackland Research & Extension Center in Temple, Texas, USA.
7. UTILITIES
• SWAT model is used to run hydrological models to get water
balance ratios like: stream flow-precipitation ratio, base flow-total
flow ratio, ET-precipitation ratio etc.
• It provides maximum upland sediment yield.
• In reservoir models, it provides average values of trapping
efficiency, water losses, and reservoir trends.
• SWAT model also deals with nitrogen and phosphorus cycles, plant
growth, landscape nutrient losses, land use summary, instream
processes, and point sources.
• Quantifying the impacts from land use changes on the runoff and
modelling the long term impact of management practices
The utility of SWAT model is extensively vast in all hydrological field.
8. Data Requirement
The inputs, used by this model, are -
Daily rainfall data,
Maximum and minimum air temperature,
Solar radiation,
Relative air humidity and
Wind speed used
Using that data, it is able to describe water and
sediment circulation, vegetation growth and
nutrients circulation. Based on amount of
precipitation and mean daily air temperature rate of
snowfall can be determined.
9. Model framework
INPUTS
Hydrological
parameters
Meteorological
parameters
DEMs
Land Use/Land
cover maps
OUTPUTS
Surface Runoff
Evapo-
Transpiration
Total Flow
Infiltration
Soil Water
Assessment
Tool
(SWAT)
12. Calculation of Runoff volume(Land Phase)
SCS – CN Method
Runoff from the
catchment (Q)
Retention Parameter (S)
Curve Number (CN)
Range (0 ≤ CN ≤ 100)
Ia = 0.2*S
13. Peak Runoff rate (Qpeak)
where
C - runoff coefficient
i - mean intensity (mm/hr) of
precipitation for a duration
equals to tc and an
exceedance probability P
A – Subbasin area (Km2)
Time of Concentration (Tconc)
Peak Runoff rate Method
14. Overland flow Time of concentration (Tov)
Channel flow Time of concentration (Tch)
Modified Peak Runoff rate (Qpeak)
αtc = fraction of daily rainfall that occurs during the time of concentration
15. Water Balance approach (SWAT - WB)
Where
EDC - effective depth of the soil
profile
ε - total soil porosity
θ - volumetric soil moisture for each
day
Where
Q – Surface Runoff
P - Precipitation
• If the rain event is LARGER in volume than τ, the soil will saturated
and surface runoff will occur
• If the rain event is LESS than τ, the soil will not be saturated and there
will be no surface runoff
16. Penman Monteith, Priestly- Taylor and Hargreaves methods
are used for the estimation of evapotranspiration.
17. In order to obtain accurate forecasting of water, nutrient and sediment
circulation, it is necessary to simulate hydrologic cycle which integrates
overall water circulation in the catchment area and hence the model uses the
following water balance equation in the catchment.
Where SWt is the humidity of soil, SWo is base humidity, Rv is rainfall
volume in mm water, Qs is the surface runoff, Wseepage is seepage of
water from soil to underlying layers, ET is evapotranspiration, Qgw is
ground water runoff and t is time in days).
In case of base flow calculation,
19. Routing Phase
Muskingum routing method
Variable storage method
SWAT uses Manning’s equation to define the rate and
velocity of flow
20. SWAT
Model
Simulation
Sensitivity
Analysis & Model
Calibration
Model
Validation Output
Reading
Reports
Parameters
Optimal
Values
HRU
Definition
Watershed
Discretization
Discharge
Data
Discharge
Data
GIS
ProcessingInput Data
DEM
Meteorol
ogical
data
Weather
Time Series
SoilLand Use
Location of
Weather
Stations
Complete SWAT Model Project Setup
24. Step 2: Watershed Delineator
Open DEM Setup
Stream Definition
Stream network
Outlet and Inlet Definition
Outlet Selection and
definition
Subbasin Parameters and
Add Reservoir
25.
26. Step 3: HRU Analysis
Hydrologic Response units are portions of a subbasin that possess
unique landuse/management/soil attributes.
In a watershed ,the first level of subdivision is the subbasin which
will contain at least one HRU, a tributary channel and a main channel
or reach. As a general rule, a given subbasin should have 1-10
HRUs.
27. An HRU (the total area in the subbasin with a particular
landuse, slope and soil) is not synonymous to a field
(While individual fields with a specific landuse,
management and soil may be scattered throughout a
subbasin) ,these areas are lumped together to form one
HRU.
HRUs are used in most SWAT runs since they simplify a
run by lumping all similar soil and land use areas into a
single response unit. It is often not practical to simulate
individual fields.
41. Case Study
• Hydrological modeling of the Simly Dam watershed
(Pakistan) using GIS and SWAT model
Shimaa M. Ghoraba
To estimate the volume inflow to the Simly Dam, for
developing efficient decision framework to facilitate,plan
and access the management of reservoir
Objective
43. Materials and Methods
Digital Elevation Model (DEM) of the watershed area (a) Delineation of sub-basins of watershed; (b) Land
use map; (c) Soil map; (d) Location of weather
stations
44. Results and Discussion
Fig .3. Annual observed and simulated stream flow for the calibration period (1990–2001).
46. Contd…
Fig.5: Comparison of annually observed and simulated dam outflow for the calibration and
validation period
47. Contd…
Fig.6: Comparison of monthly observed and simulated stream flow for the calibration period (1990–2001).
48. Fig.7: Comparison of monthly observed and simulated stream flow for the validation period (2002-2011)
Contd…
49. Fig.8: Average annual water balance as a relative percentage to precipitation for calibration and validation years
Fig.9:Comparison of monthly observed and simulated dam inflow for the calibration and validation periods.
50. Conclusions
1) In this study calibrated SWAT model has been produced
good simulation results where Water balance components
such as surface runoff, lateral flow, base flow and
evapotranspiration have been simulated.
2) The monthly inflow to Simly Dam estimated by the model
and the simulated values shows very close agreement
(Coefficient of Determination (R2), NSE).
3) The performances of the model can be enhanced furthermore
by integration of some other climatic data such as solar
radiation, humidity and wind.
51. The main weakness of the model is a non-spatial representation
(site- specific, not robust model) of the HRU inside each
subcatchment. This also kept the model simple and supported
application of the model to almost every catchment.
Wide range of different data needs to be obtained to run the
model and numerous parameters needed to be modified during
the calibration which needs a lot of patience to deal with.
The model does not allow simulations of multicultural plant
communities which are common in organic farming, grasslands
and forests as they were originally developed for monocultures.
Limitations and drawbacks of SWAT
52. Some users have addressed weaknesses in SWAT by component
modifications, which support more accurate simulation of specific
processes or regions, or by interfacing SWAT with other models. Both of
these trends are expected to continue.
The SWAT model will continue to evolve in response to the needs of the
ever increasing worldwide user community and to provide improved
simulation accuracy of key processes.
A major challenge of the ongoing evolution of the model will be
meeting the desire for additional spatial complexity while maintaining
ease of model use. This goal will be kept in focus as the model
continues to develop in the future.
Future development of the model
53. [1] Gassman, P. W. et al (2007) . “The soil and water assesment tool:
histoorical development, applications, and future research directions.”
American Society of Agricultural and Biological Engineers ISSN 0001-
2351, Vol. 50(4): 1211-1250.
[2] J. R. Williams and J. G. Arnold. (2010) “History of Model
Development at Temple, Texas” Presentation.
https://swat.tamu.edu/docs/swat/conferences/2010/presentations/Opening.
Williams.pdf
[3] Gayathri K Devi, Ganasri B P, Dwarakish G S (2015).” A Review on
Hydrological Models.” Aquatic Procedia 4 ( 2015 ) 1001 – 1007.
www.elsevier.com/locate/procedia.
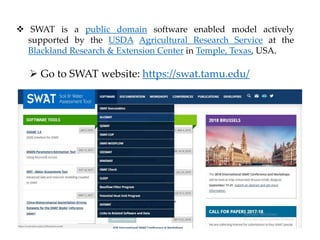
[5] SWAT Manual. https://swat.tamu.edu/documentation/
[6]"SWAT: Soil & Water Assessment Tool". Texas A&M University. Retrieved 1
March 2012.
References:
Editor's Notes
Trapping eff. Of sediment, nitrogen and phosphorous
WATER LOSS% by tot. removed+ losses, Seepage and Evaporation
Trends : no of reservoirs. Final/initial volume (max), Final/initial volume (min), fraction of period empty (max)
Configuration file, soil data(.Sol), Weather Generator Data(.Wgn), HRU/ Drainage Data (.HRU/.Sdr) Operation data, Watershed Data
Implicit in the concept of the HRU is the assumption that there is no
interaction between HRUs in one subbasin. Loadings (runoff with sediment,
nutrients, etc. transported by the runoff) from each HRU are calculated separately
and then summed together to determine the total loadings from the subbasin. If the interaction of one landuse area with another is important, rather than defining
those landuse areas as HRUs they should be defined as subbasins. It is only at the
subbasin level that spatial relationships can be specified.
The benefit of HRUs is the increase in accuracy it adds to the prediction of
loadings from the subbasin. The growth and development of plants can differ
greatly among species. When the diversity in plant cover within a subbasin is
accounted for, the net amount of runoff entering the main channel from the
subbasin will be much more accurate.