Download to read offline
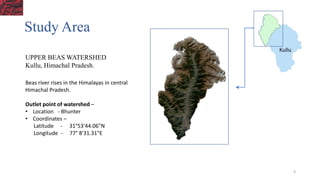
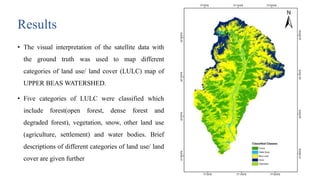
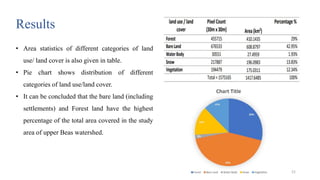

The document outlines the preparation of a land use/land cover map for the Upper Beas Watershed in Kullu, Himachal Pradesh using remote sensing (RS) and geographic information system (GIS) techniques. It details the methodology for delineating watersheds and classifications of land cover, along with the data sources and software used, particularly Landsat-8 satellite data and HEC-GeoHMS tools for analysis. The study categorizes land use into five classes: forest, vegetation, bare land, water bodies, and snow, concluding with the importance of accurate land cover information for planning activities.


