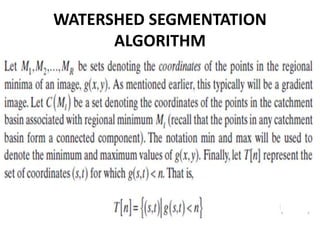
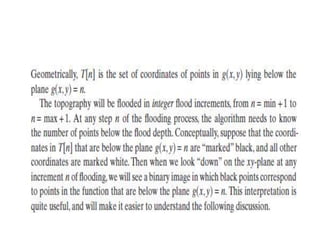
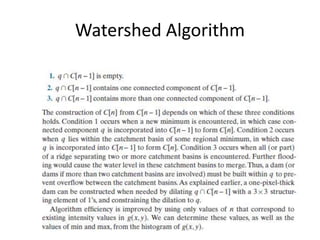
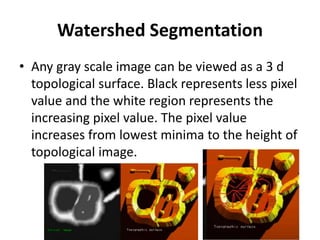
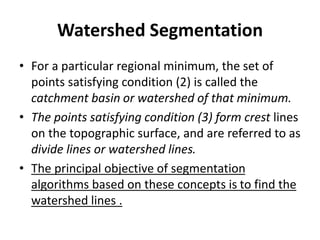
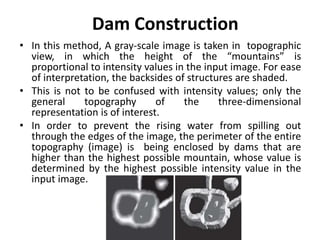
The watershed algorithm utilizes the topographical representation of grayscale images, where high-intensity pixels represent peaks and low-intensity pixels represent valleys, to segment objects by treating the image as a surface filled with water. Two primary approaches, rainfall and flooding, are employed to identify catchment basins and build barriers to prevent merging of different regions. The final segmentation result is obtained by determining the watershed lines that separate distinct regions based on the rise of water through local minima in the image.


![Dam Construction
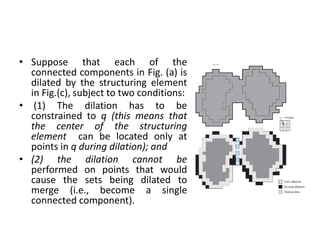
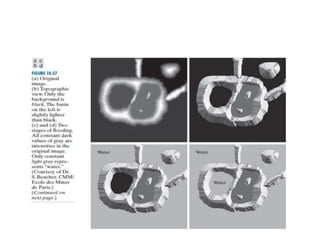
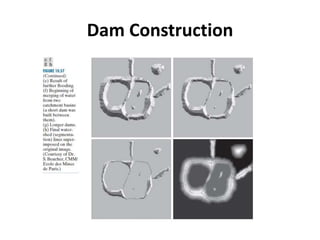
• Suppose that a hole is punched in each regional
minimum [shown as dark areas ] and that the entire
topography is flooded from below by letting water
rise through the holes at a uniform rate.
• Figure 10.57(c) shows the first stage of flooding,
where the “water,” shown in light gray, has covered
only areas that correspond to the black background
in the image.](https://image.slidesharecdn.com/watershedalgorithm-240401090615-9af1b18c/85/Watershed-Algorithm-for-segmentation-pptx-12-320.jpg)
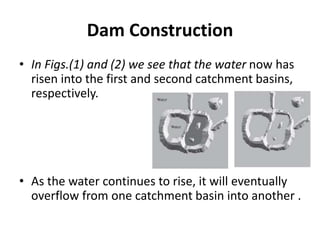
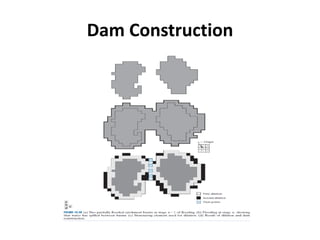
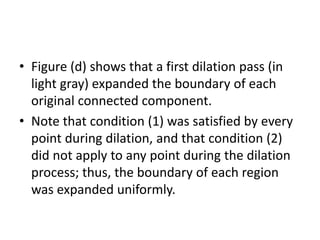
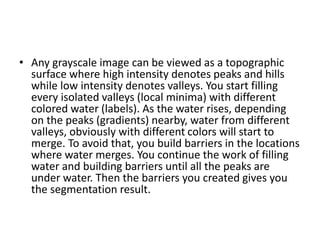
![• Let C[n − 1] denote the union of these two sets. There are
two connected components in Fig. (a), and only one
component in Fig.(b). This connected component
encompasses the earlier two components, which are
shown dashed.
• Two connected components having become a single
component indicates that water between the two
catchment basins has merged at flooding step n.
• Let this connected component be denoted by q. Note that
the two components from step n − 1 can be extracted from
q by performing a logical AND operation, qnC[n − 1].
• Observe also that all points belonging to an individual
catchment basin form a single connected component.](https://image.slidesharecdn.com/watershedalgorithm-240401090615-9af1b18c/85/Watershed-Algorithm-for-segmentation-pptx-21-320.jpg)