Downloaded 32 times


![5. Dam Construction
Dam construction is based on binary images, which are
members of 2-D integer space
The dam must be built to keep water from spilling across
the basins.
Let M1 and M2 be the set of coordinates of the points in the
two regional minima.
The set of coordinates of the points in the catchment basin
associated with the two minima in the flooding level n be
Cn(M1) and Cn(M2).
Let the Union of these sets be C[n].
17hars10203@gmail.com](https://image.slidesharecdn.com/ipwatershedseg-200819162113/85/Watershed-Segmentation-Image-Processing-17-320.jpg)
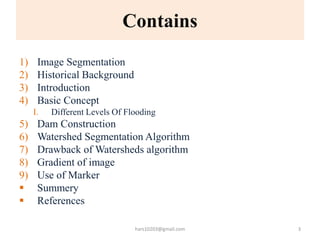
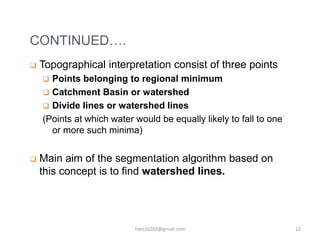
![6. WATERSHED SEGMENTATION
ALGORITHM
Let M1, M2, M3….Mn be the sets of coordinates of
points in the regional minima of the image g(x,y)
C(Mi) be the coordinates of points of the catchment basin
associated with regional minima Mi
T[n] = { (s,t) | g(s,t) < n }
T[n] = Set of points in g(x,y) which are lying below the
plane g(x,y) = n
n = Stage of flooding, varies from min+1 to max+1
min = minimum gray level value
max = maximum gray level value
21hars10203@gmail.com](https://image.slidesharecdn.com/ipwatershedseg-200819162113/85/Watershed-Segmentation-Image-Processing-21-320.jpg)
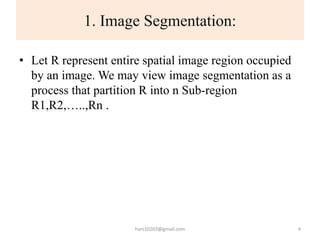
![ALGORITHM CONTD….
Let Cn(M1) be the set of points in the catchment
basin associated with M1 that are flooded at stage
n.
Cn(Mi) = 1 at location (x,y) if (x,y) Є C(Mi)
AND (x,y) Є T[n], otherwise it is 0.
C[n] be the union of flooded catchment basin
portions at the stage n
=>
=>
22hars10203@gmail.com](https://image.slidesharecdn.com/ipwatershedseg-200819162113/85/Watershed-Segmentation-Image-Processing-22-320.jpg)
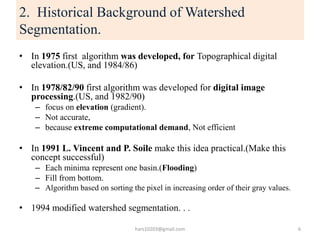
![ALGORITHM CONTD….
Algorithm keeps on increasing the level of flooding,
and during the process Cn(Mi) and T[n] either
increase or remain constant.
Algorithm initializes C[min +1] = T[min+1], and
then proceeds recursively assuming that at step n
C[n-1] has been constructed.
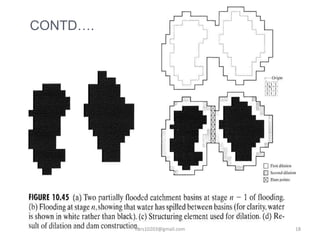
Let Q be set of connected components in T[n].
For each connected component q Є Q[n], there are
three possibilities:
23hars10203@gmail.com](https://image.slidesharecdn.com/ipwatershedseg-200819162113/85/Watershed-Segmentation-Image-Processing-23-320.jpg)
![ALGORITHM CONTD….
Condition (a) occurs when a new minima is
encountered, in this case q is added to set C[n-1] to
form C[n].
Condition (b) occurs when q lies within a catchment
basin of some regional minima, in that case
Condition (c) occurs when ridge between two
catchment basins is hit and further flooding will
cause the waters from two basins will merge, so a
dam must be built within q.
24hars10203@gmail.com](https://image.slidesharecdn.com/ipwatershedseg-200819162113/85/Watershed-Segmentation-Image-Processing-24-320.jpg)
![DAM CONSTRUCTION
As shown in the previous images, a one pixel thick
dam can be constructed when needed by dilating
q ∩ C[n-1] with a 3 × 3 Structuring matrix of 1’s
and constraining the dilation to q.
Algorithm efficiency can be improved by using only
values of n that correspond to existing gray level
values in g(x,y).
Histogram of g(x,y) can be used to evaluate min,
max and these values.
25hars10203@gmail.com](https://image.slidesharecdn.com/ipwatershedseg-200819162113/85/Watershed-Segmentation-Image-Processing-25-320.jpg)

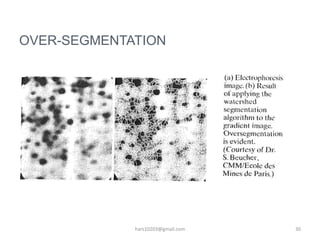
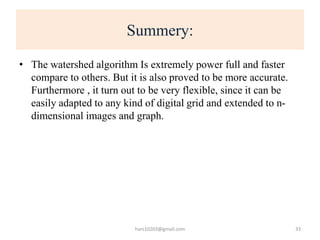


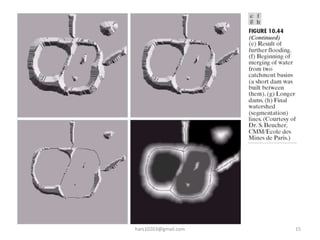
This document is a presentation on image segmentation using morphological watersheds, outlining its historical background, algorithms, and concepts. The watershed algorithm is described as a powerful and flexible method for segmenting images by visualizing them topographically and using flooding concepts for identifying regions. It highlights drawbacks such as over-segmentation and sensitivity to noise, while also discussing solutions like marker-based segmentation to improve accuracy.