2
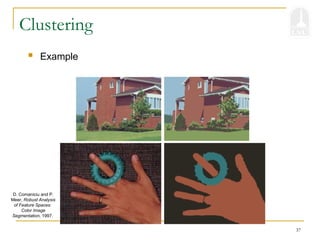
Image Segmentation
Groupsimilar components (such as, pixels in an
image, image frames in a video) to obtain a compact
representation.
Applications: Finding tumors, veins, etc. in medical
images, finding targets in satellite/aerial images,
finding people in surveillance images, summarizing
video, etc.
Methods: Thresholding, K-means clustering, etc.
3.
3
Image Segmentation
Segmentationalgorithms for monochrome images
generally are based on one of two basic properties of gray-
scale values:
Discontinuity
The approach is to partition an image based on abrupt changes
in gray-scale levels.
The principal areas of interest within this category are detection
of isolated points, lines, and edges in an image.
Similarity
The principal approaches in this category are based on
thresholding, region growing, and region splitting/merging.
4.
4
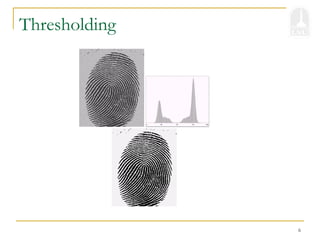
Thresholding
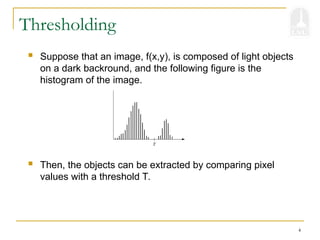
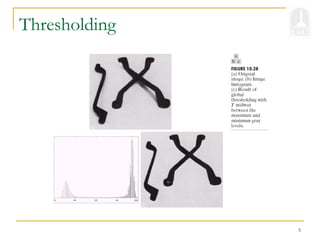
Suppose thatan image, f(x,y), is composed of light objects
on a dark backround, and the following figure is the
histogram of the image.
Then, the objects can be extracted by comparing pixel
values with a threshold T.
7
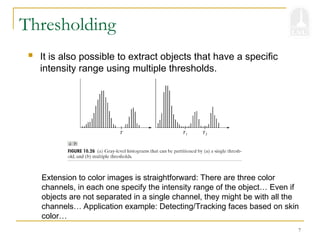
Thresholding
It isalso possible to extract objects that have a specific
intensity range using multiple thresholds.
Extension to color images is straightforward: There are three color
channels, in each one specify the intensity range of the object… Even if
objects are not separated in a single channel, they might be with all the
channels… Application example: Detecting/Tracking faces based on skin
color…
8.
8
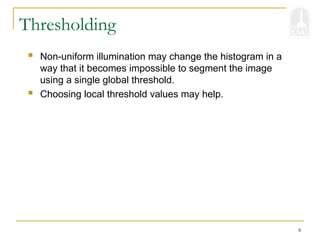
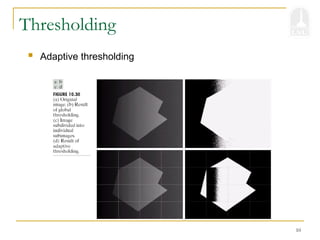
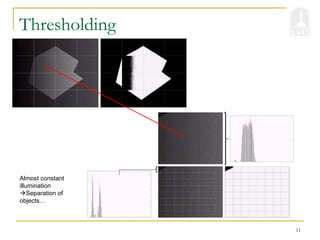
Thresholding
Non-uniform illuminationmay change the histogram in a
way that it becomes impossible to segment the image
using a single global threshold.
Choosing local threshold values may help.
12
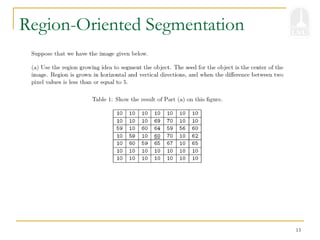
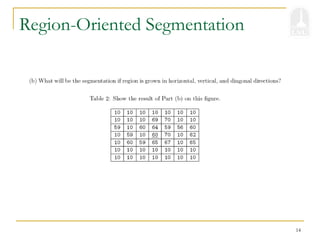
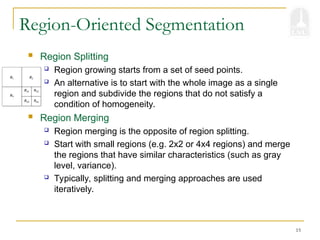
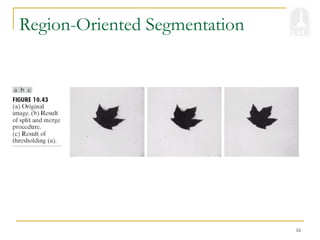
Region-Oriented Segmentation
RegionGrowing
Region growing is a procedure that groups pixels or
subregions into larger regions.
The simplest of these approaches is pixel aggregation, which
starts with a set of “seed” points and from these grows
regions by appending to each seed points those neighboring
pixels that have similar properties (such as gray level,
texture, color, shape).
Region growing based techniques are better than the edge-
based techniques in noisy images where edges are difficult to
detect.
15
Region-Oriented Segmentation
RegionSplitting
Region growing starts from a set of seed points.
An alternative is to start with the whole image as a single
region and subdivide the regions that do not satisfy a
condition of homogeneity.
Region Merging
Region merging is the opposite of region splitting.
Start with small regions (e.g. 2x2 or 4x4 regions) and merge
the regions that have similar characteristics (such as gray
level, variance).
Typically, splitting and merging approaches are used
iteratively.
17
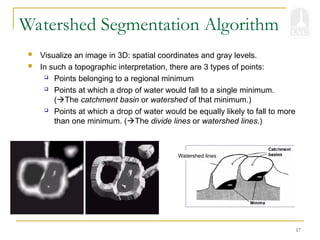
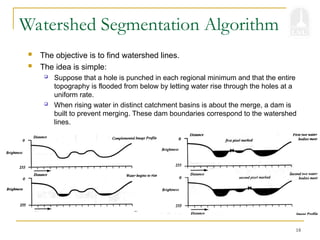
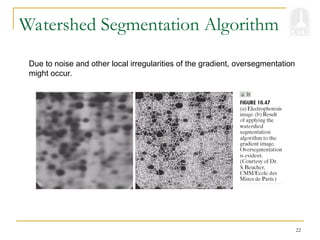
Watershed Segmentation Algorithm
Visualize an image in 3D: spatial coordinates and gray levels.
In such a topographic interpretation, there are 3 types of points:
Points belonging to a regional minimum
Points at which a drop of water would fall to a single minimum.
(The catchment basin or watershed of that minimum.)
Points at which a drop of water would be equally likely to fall to more
than one minimum. (The divide lines or watershed lines.)
Watershed lines
18.
18
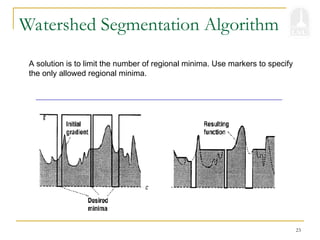
Watershed Segmentation Algorithm
The objective is to find watershed lines.
The idea is simple:
Suppose that a hole is punched in each regional minimum and that the entire
topography is flooded from below by letting water rise through the holes at a
uniform rate.
When rising water in distinct catchment basins is about the merge, a dam is
built to prevent merging. These dam boundaries correspond to the watershed
lines.
20
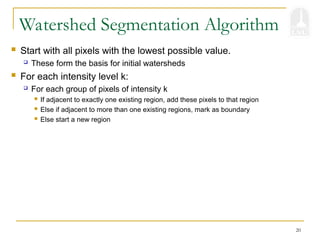
Start withall pixels with the lowest possible value.
These form the basis for initial watersheds
For each intensity level k:
For each group of pixels of intensity k
If adjacent to exactly one existing region, add these pixels to that region
Else if adjacent to more than one existing regions, mark as boundary
Else start a new region
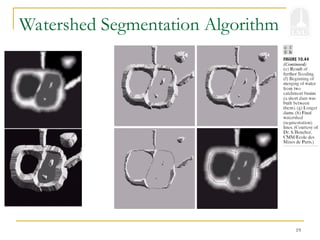
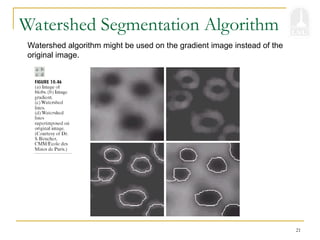
Watershed Segmentation Algorithm
24
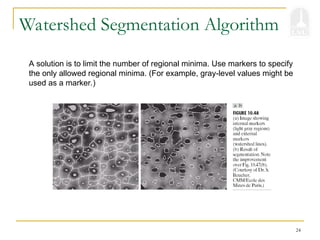
Watershed Segmentation Algorithm
Asolution is to limit the number of regional minima. Use markers to specify
the only allowed regional minima. (For example, gray-level values might be
used as a marker.)
25.
25
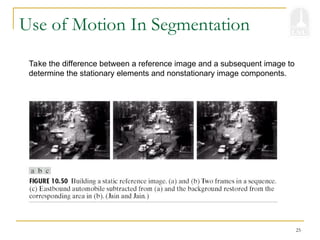
Use of MotionIn Segmentation
Take the difference between a reference image and a subsequent image to
determine the stationary elements and nonstationary image components.
26.
26
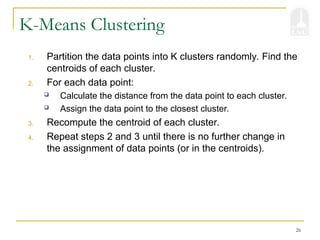
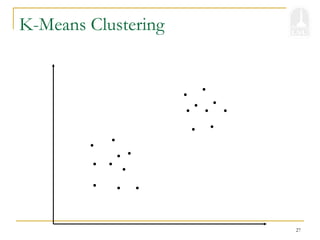
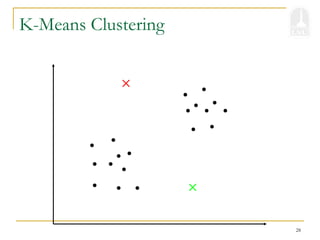
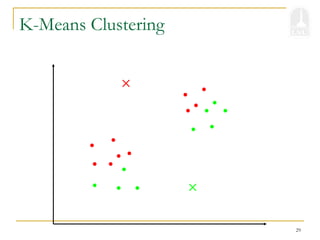
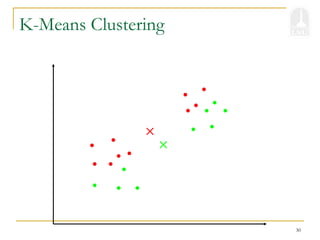
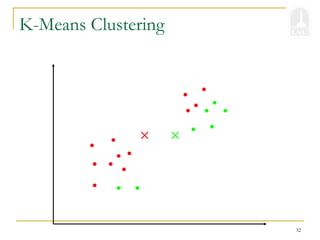
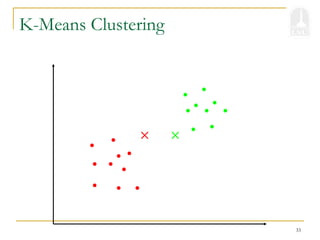
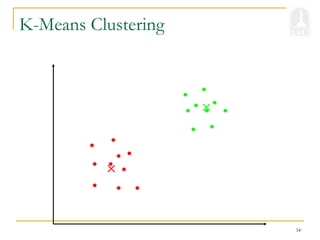
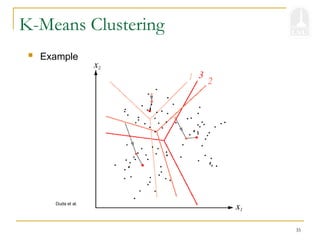
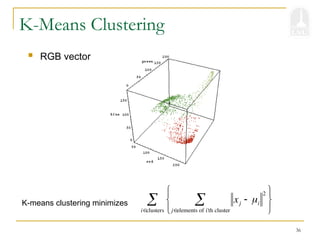
K-Means Clustering
1. Partitionthe data points into K clusters randomly. Find the
centroids of each cluster.
2. For each data point:
Calculate the distance from the data point to each cluster.
Assign the data point to the closest cluster.
3. Recompute the centroid of each cluster.
4. Repeat steps 2 and 3 until there is no further change in
the assignment of data points (or in the centroids).
39
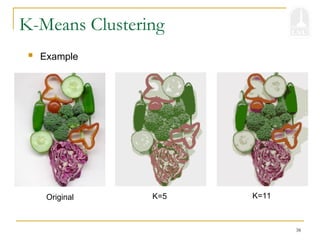
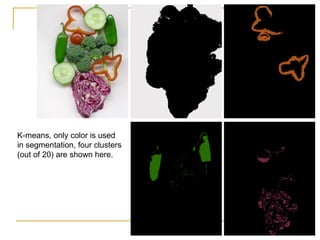
K-means, only coloris used
in segmentation, four clusters
(out of 20) are shown here.
40.
40
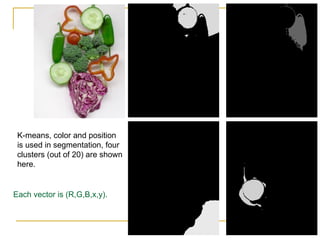
K-means, color andposition
is used in segmentation, four
clusters (out of 20) are shown
here.
Each vector is (R,G,B,x,y).
41.
41
K-Means Clustering: AxisScaling
Features of different types may have different scales.
For example, pixel coordinates on a 100x100 image vs. RGB
color values in the range [0,1].
Problem: Features with larger scales dominate
clustering.
Solution: Scale the features.

![41
K-Means Clustering: Axis Scaling
Features of different types may have different scales.
For example, pixel coordinates on a 100x100 image vs. RGB
color values in the range [0,1].
Problem: Features with larger scales dominate
clustering.
Solution: Scale the features.](https://image.slidesharecdn.com/segmentationofimage-250223062716-bb644f1d/85/Segmentation-of-Image-practical-applications-ppt-41-320.jpg)