Visual acuity measurement in children can be challenging due to their young age and inability to communicate verbally. The document discusses several methods to qualitatively and quantitatively assess visual acuity in infants, toddlers, preschoolers, and school-aged children. Key methods include preferential looking tests, Teller acuity cards, visual evoked potentials, optokinetic nystagmus, Sheridan letter tests, Kay picture tests, and Snellen charts adapted for children with pictures or isolated optotypes. The appropriate test depends on the child's age and development level, with qualitative assessments used for younger infants and standardized tests for older children.
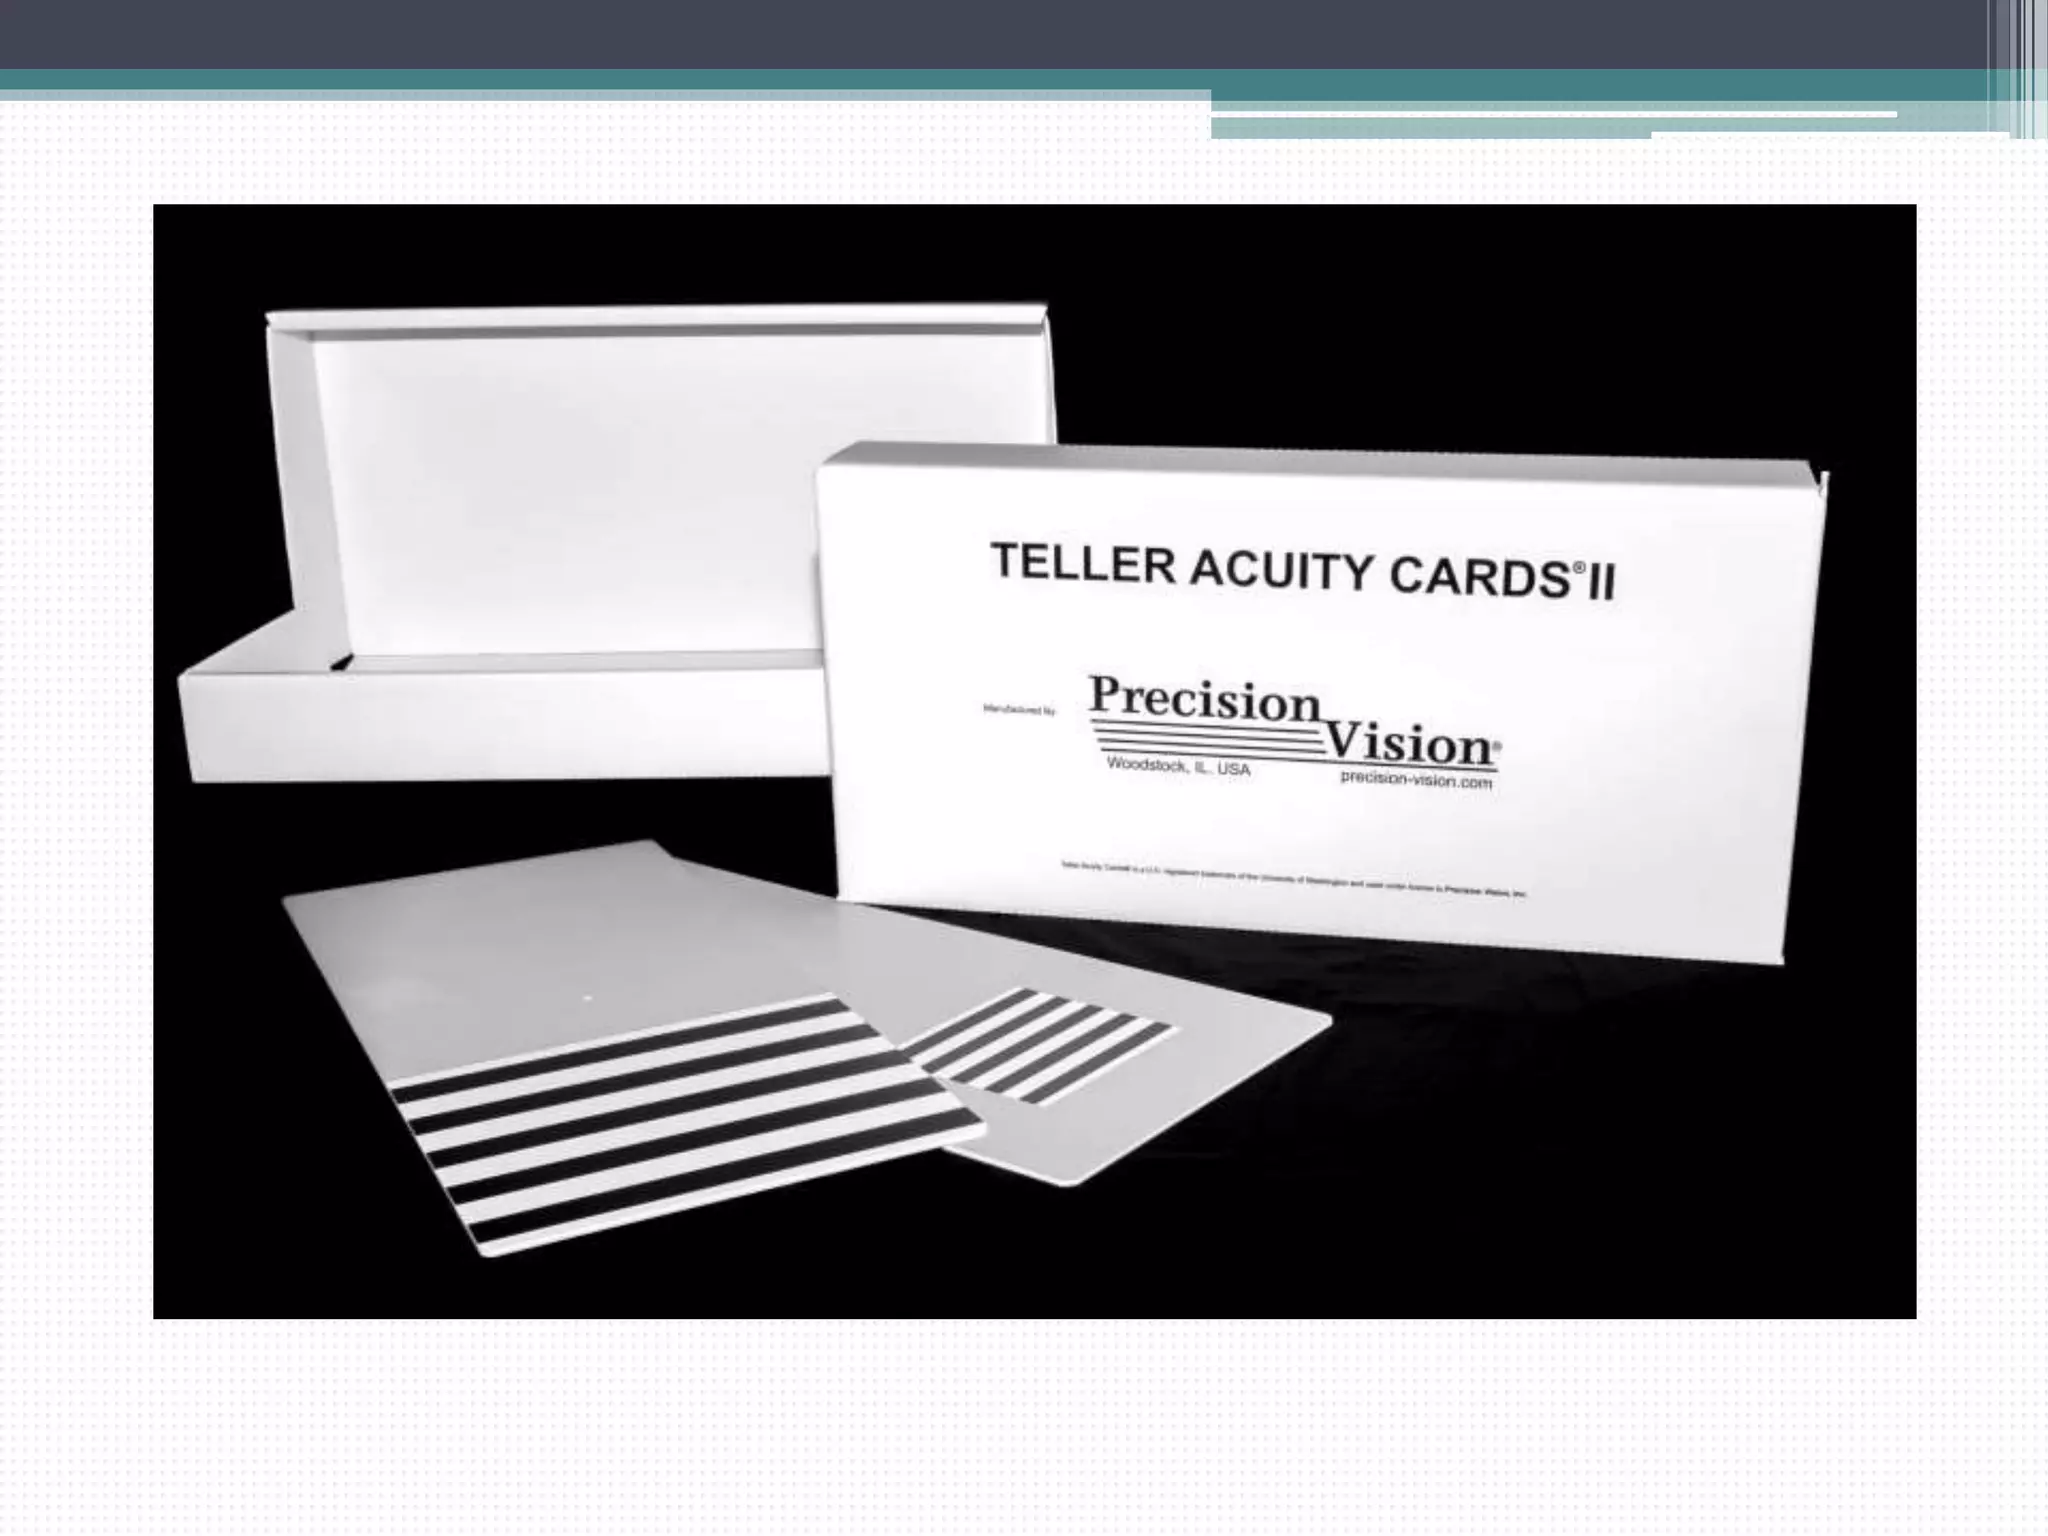
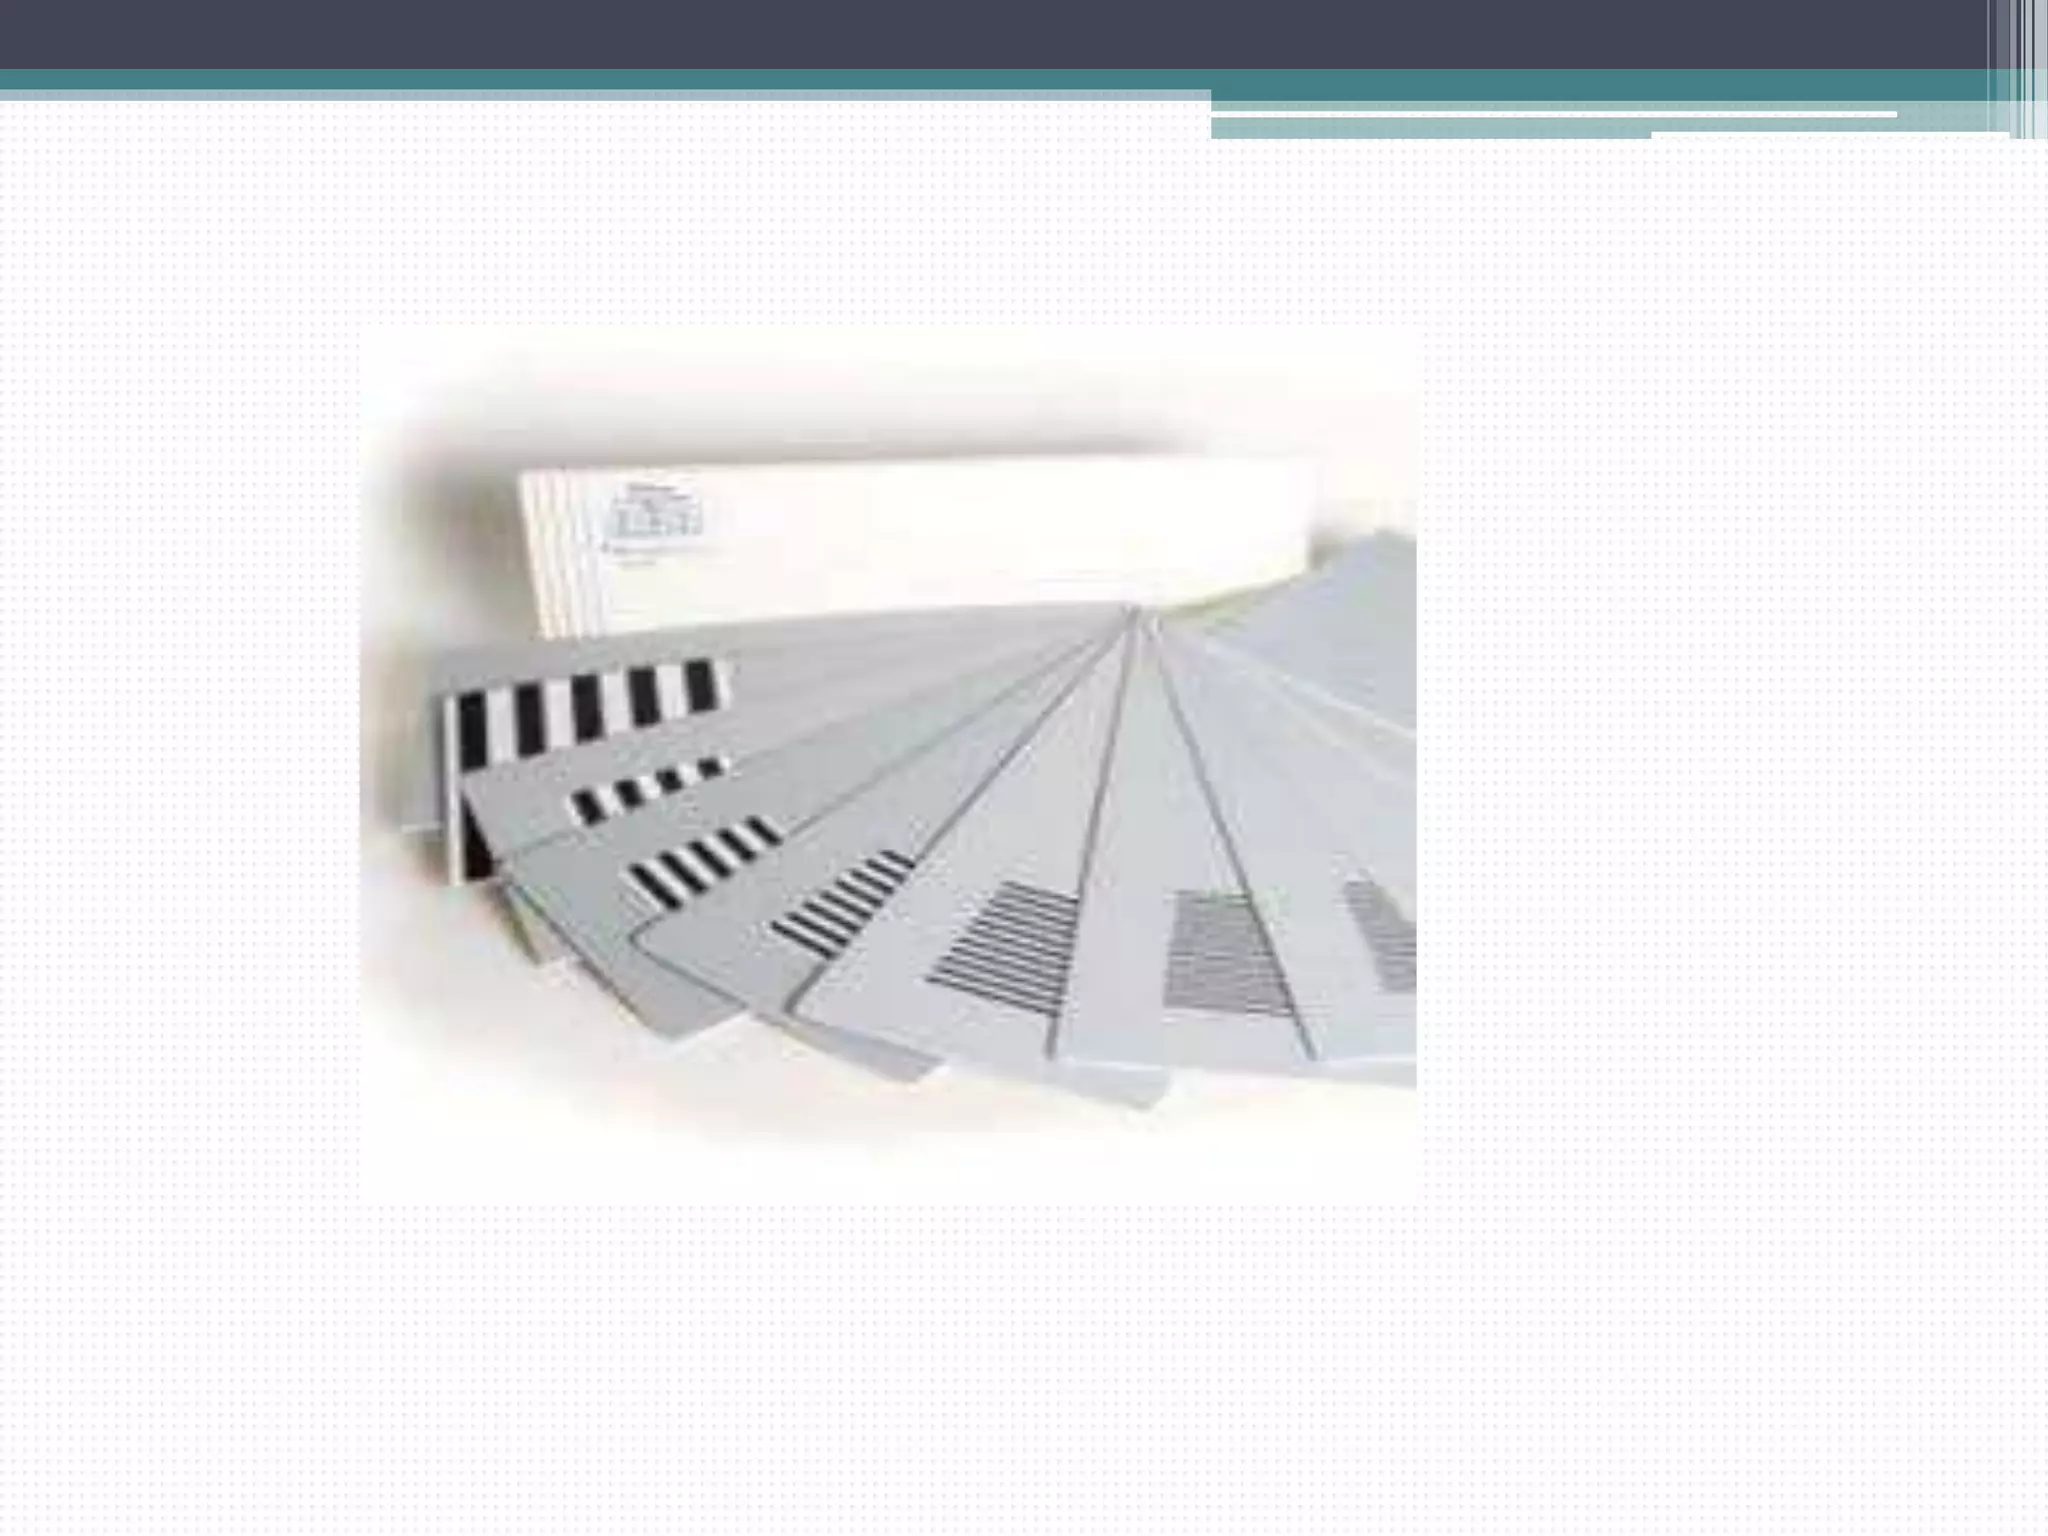
![2.Preferential Looking Test
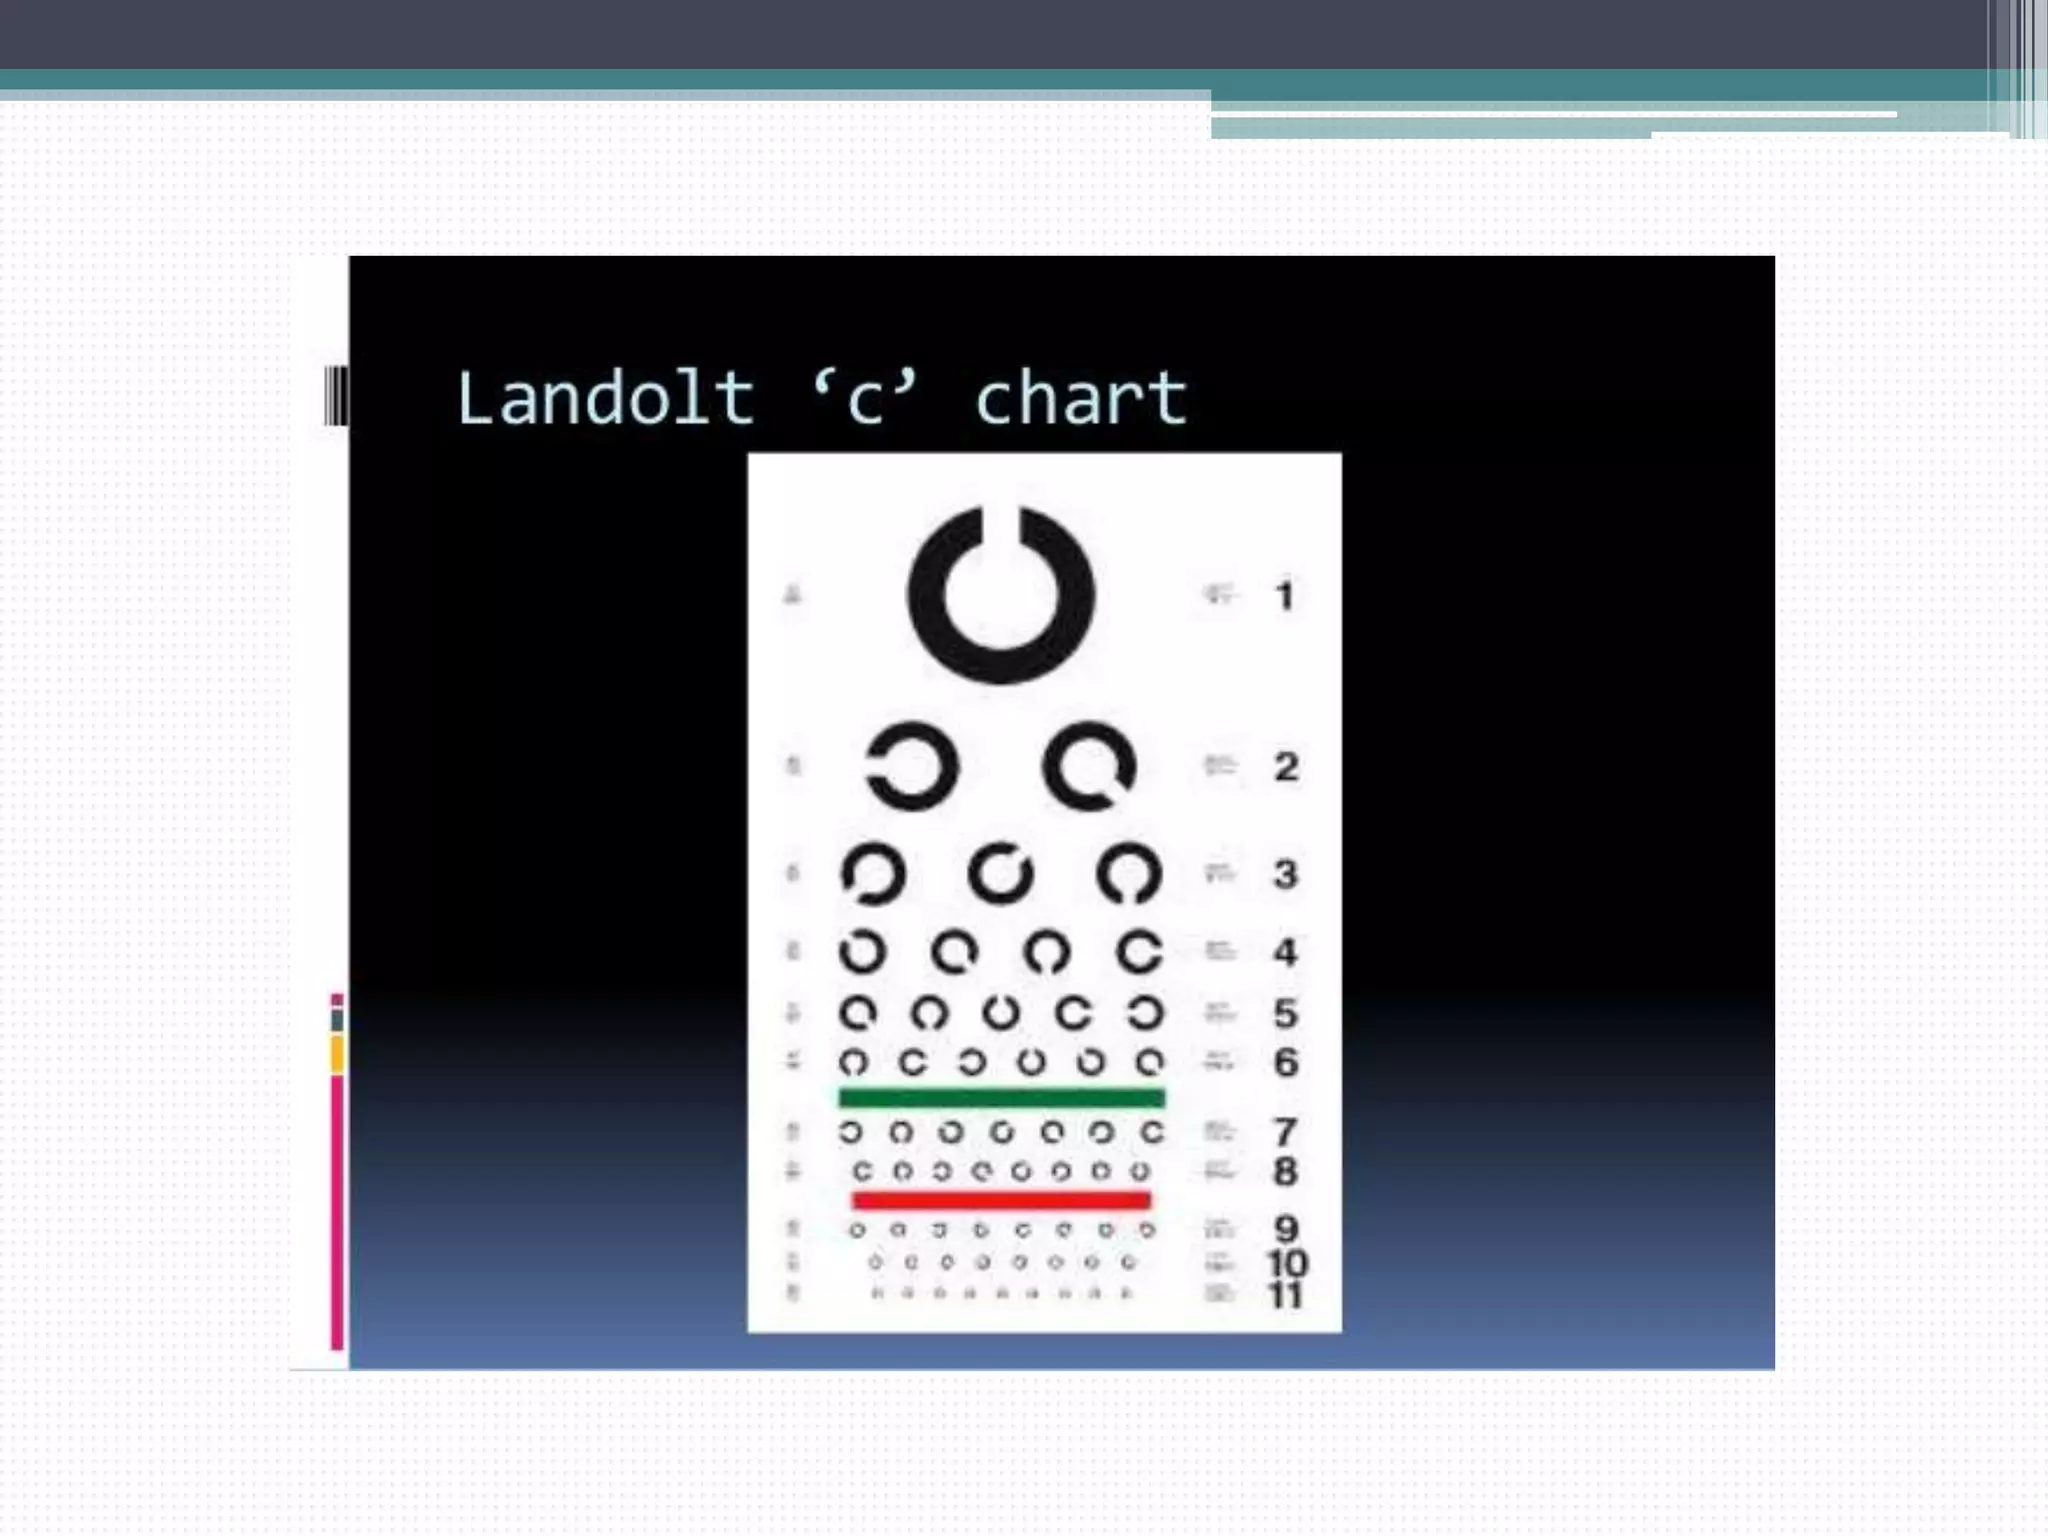
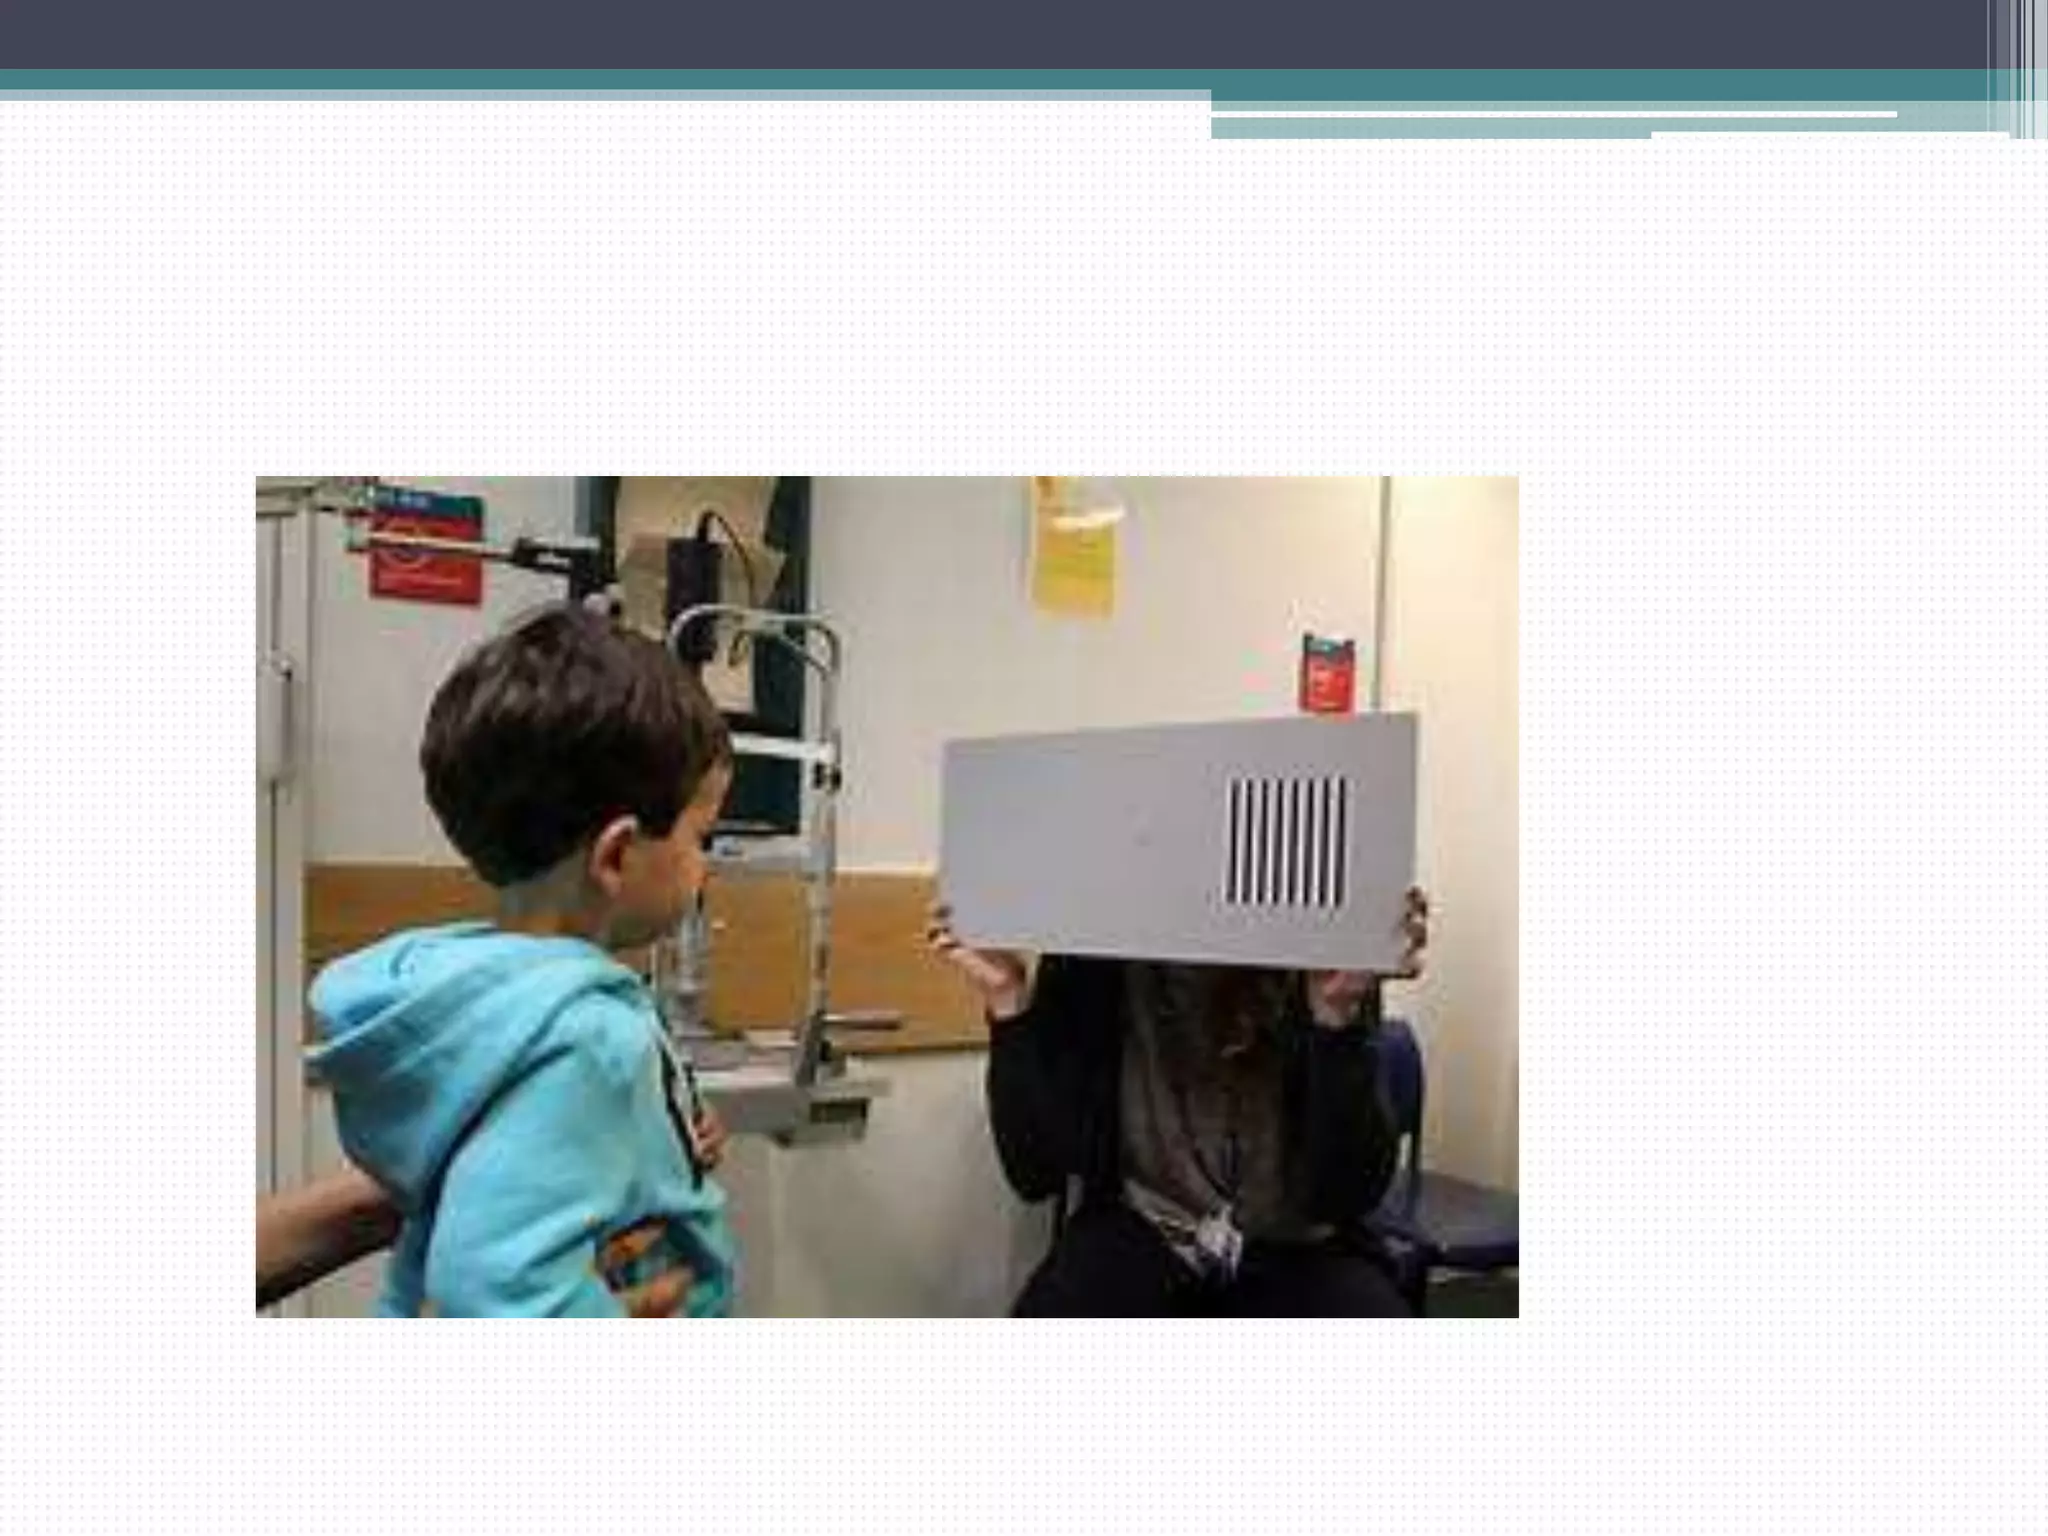
• Most Commonly used Test
• Based upon turning of the head or eyes towards the
pattern rather than a uniform[homogenous]field.
• Alternating Black and White Stripes are present
Stripe width progressively narrows which is then
Randomly shown next to plain test object
• Children with better vision are able to see finer
grating and turn towards it](https://image.slidesharecdn.com/visualacuitymeasurementinchildren-201006160346/75/Visual-acuity-measurement-in-children-25-2048.jpg)

![3.Screening Test for Young Children
and Retards [STYCAR]
1.DYNAMIC
• Based on Pursuit Eye movements
• Ten Balls rolled across a well illuminating
contrasting floor 3m away from child
• Pursuit Eye movements indicate that they are seen.
2.STATIC
The sphere is mounted on a wand and introduced into
the periphery of the visual field and the child
examiner determines whether the child fixates or
not.](https://image.slidesharecdn.com/visualacuitymeasurementinchildren-201006160346/75/Visual-acuity-measurement-in-children-46-2048.jpg)