Download to read offline


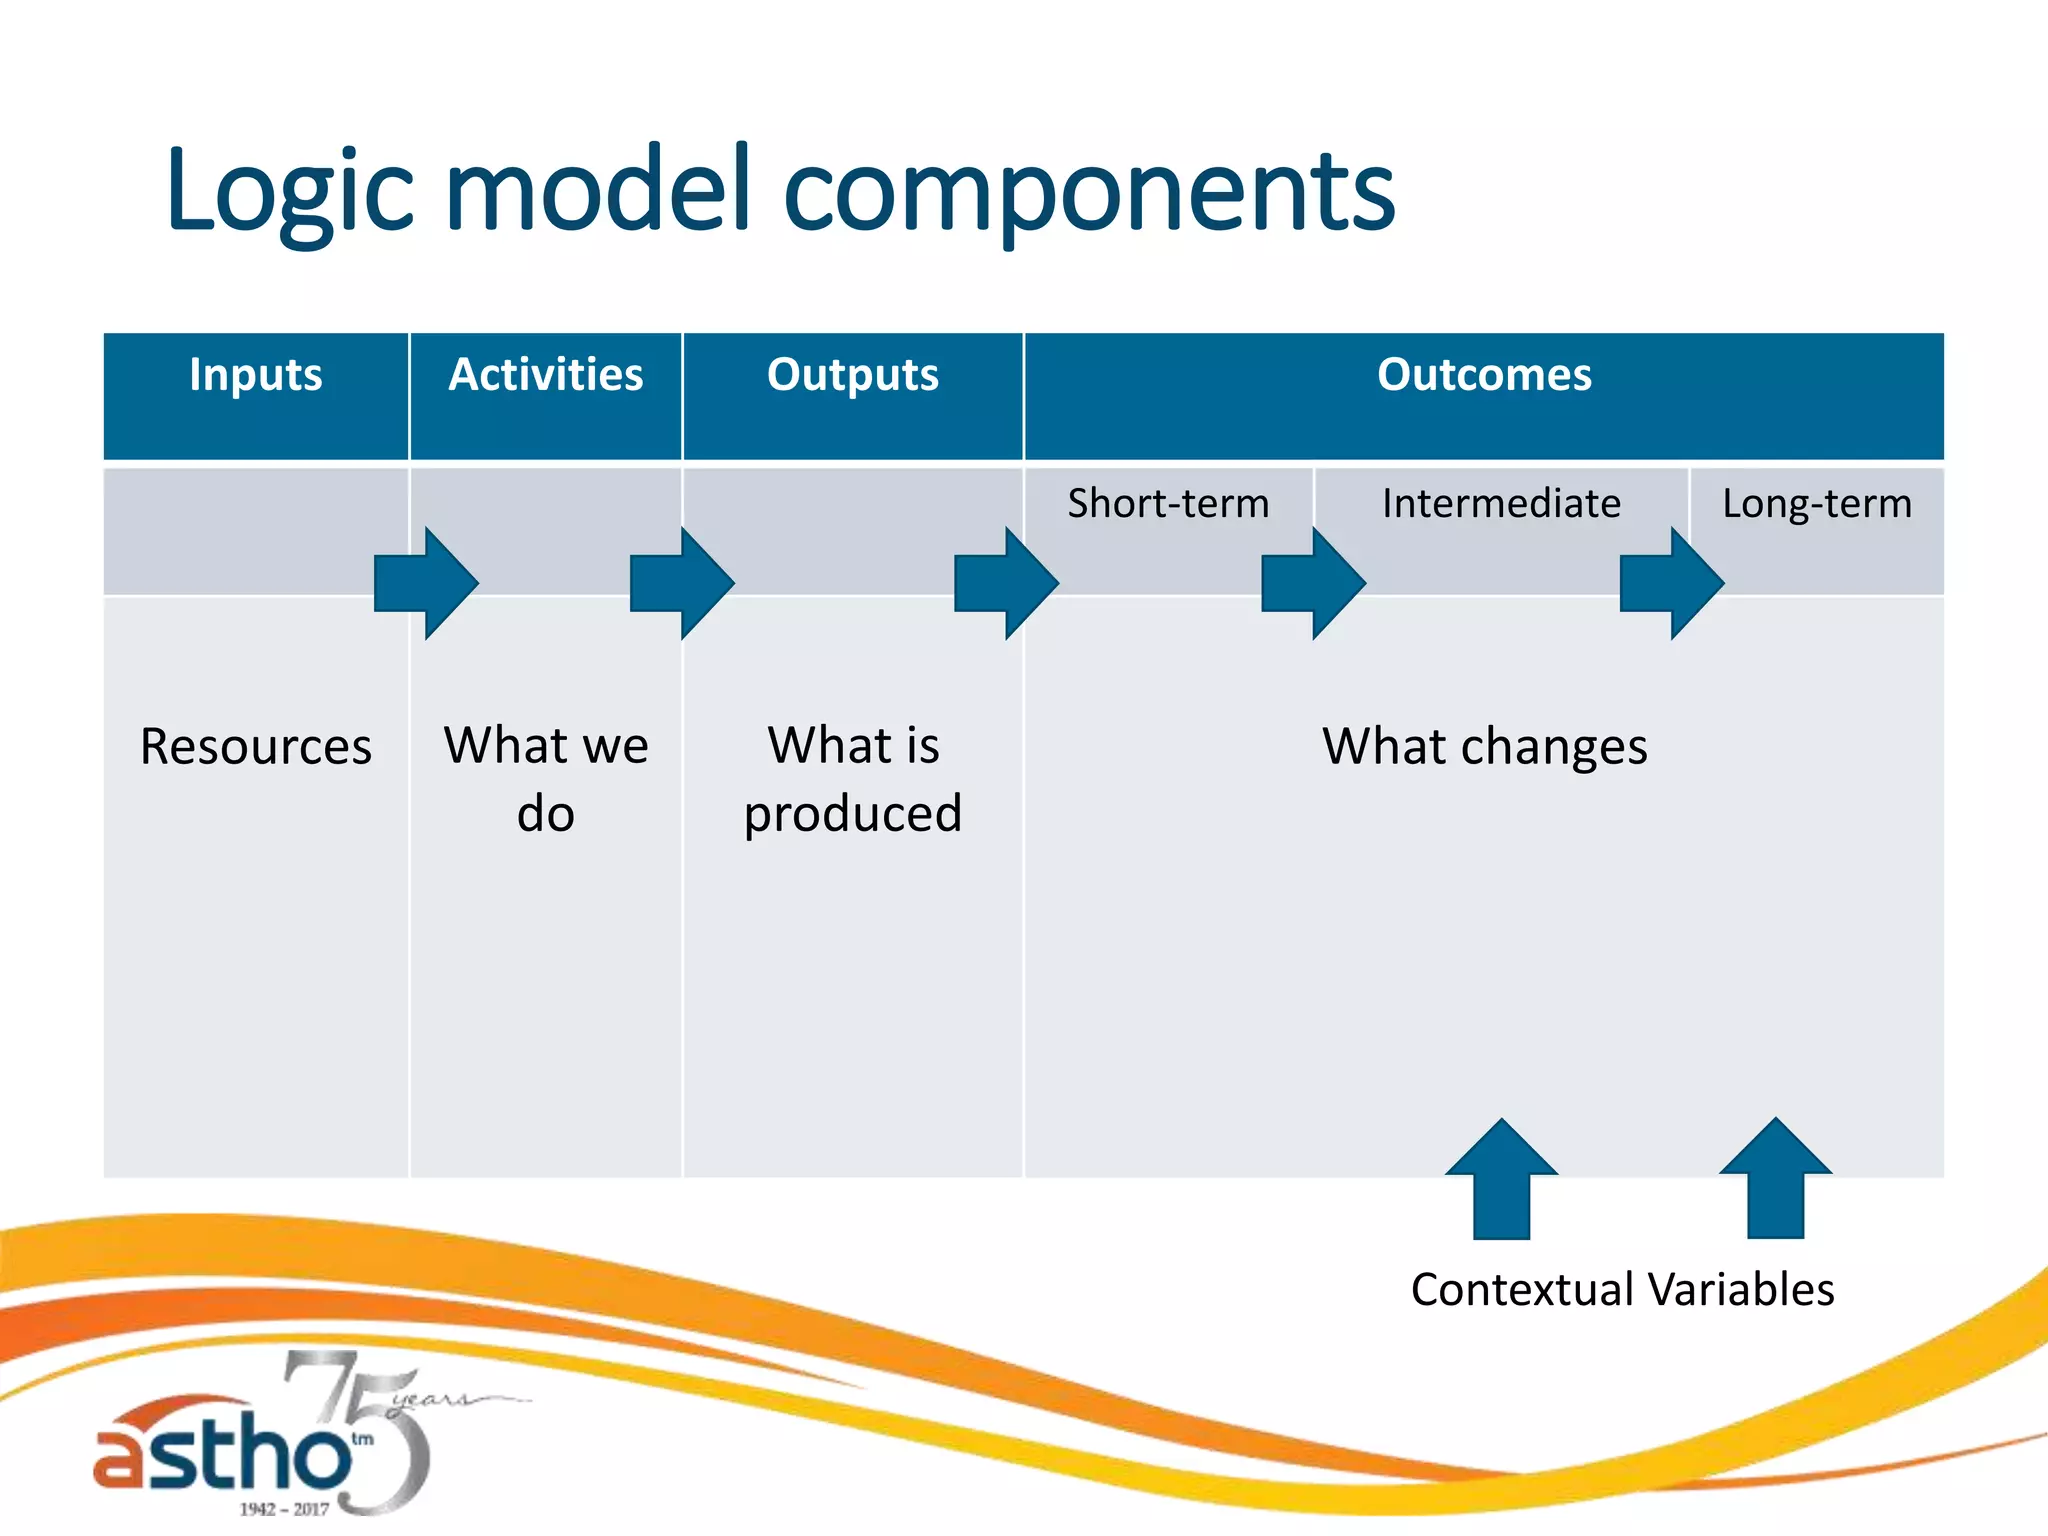
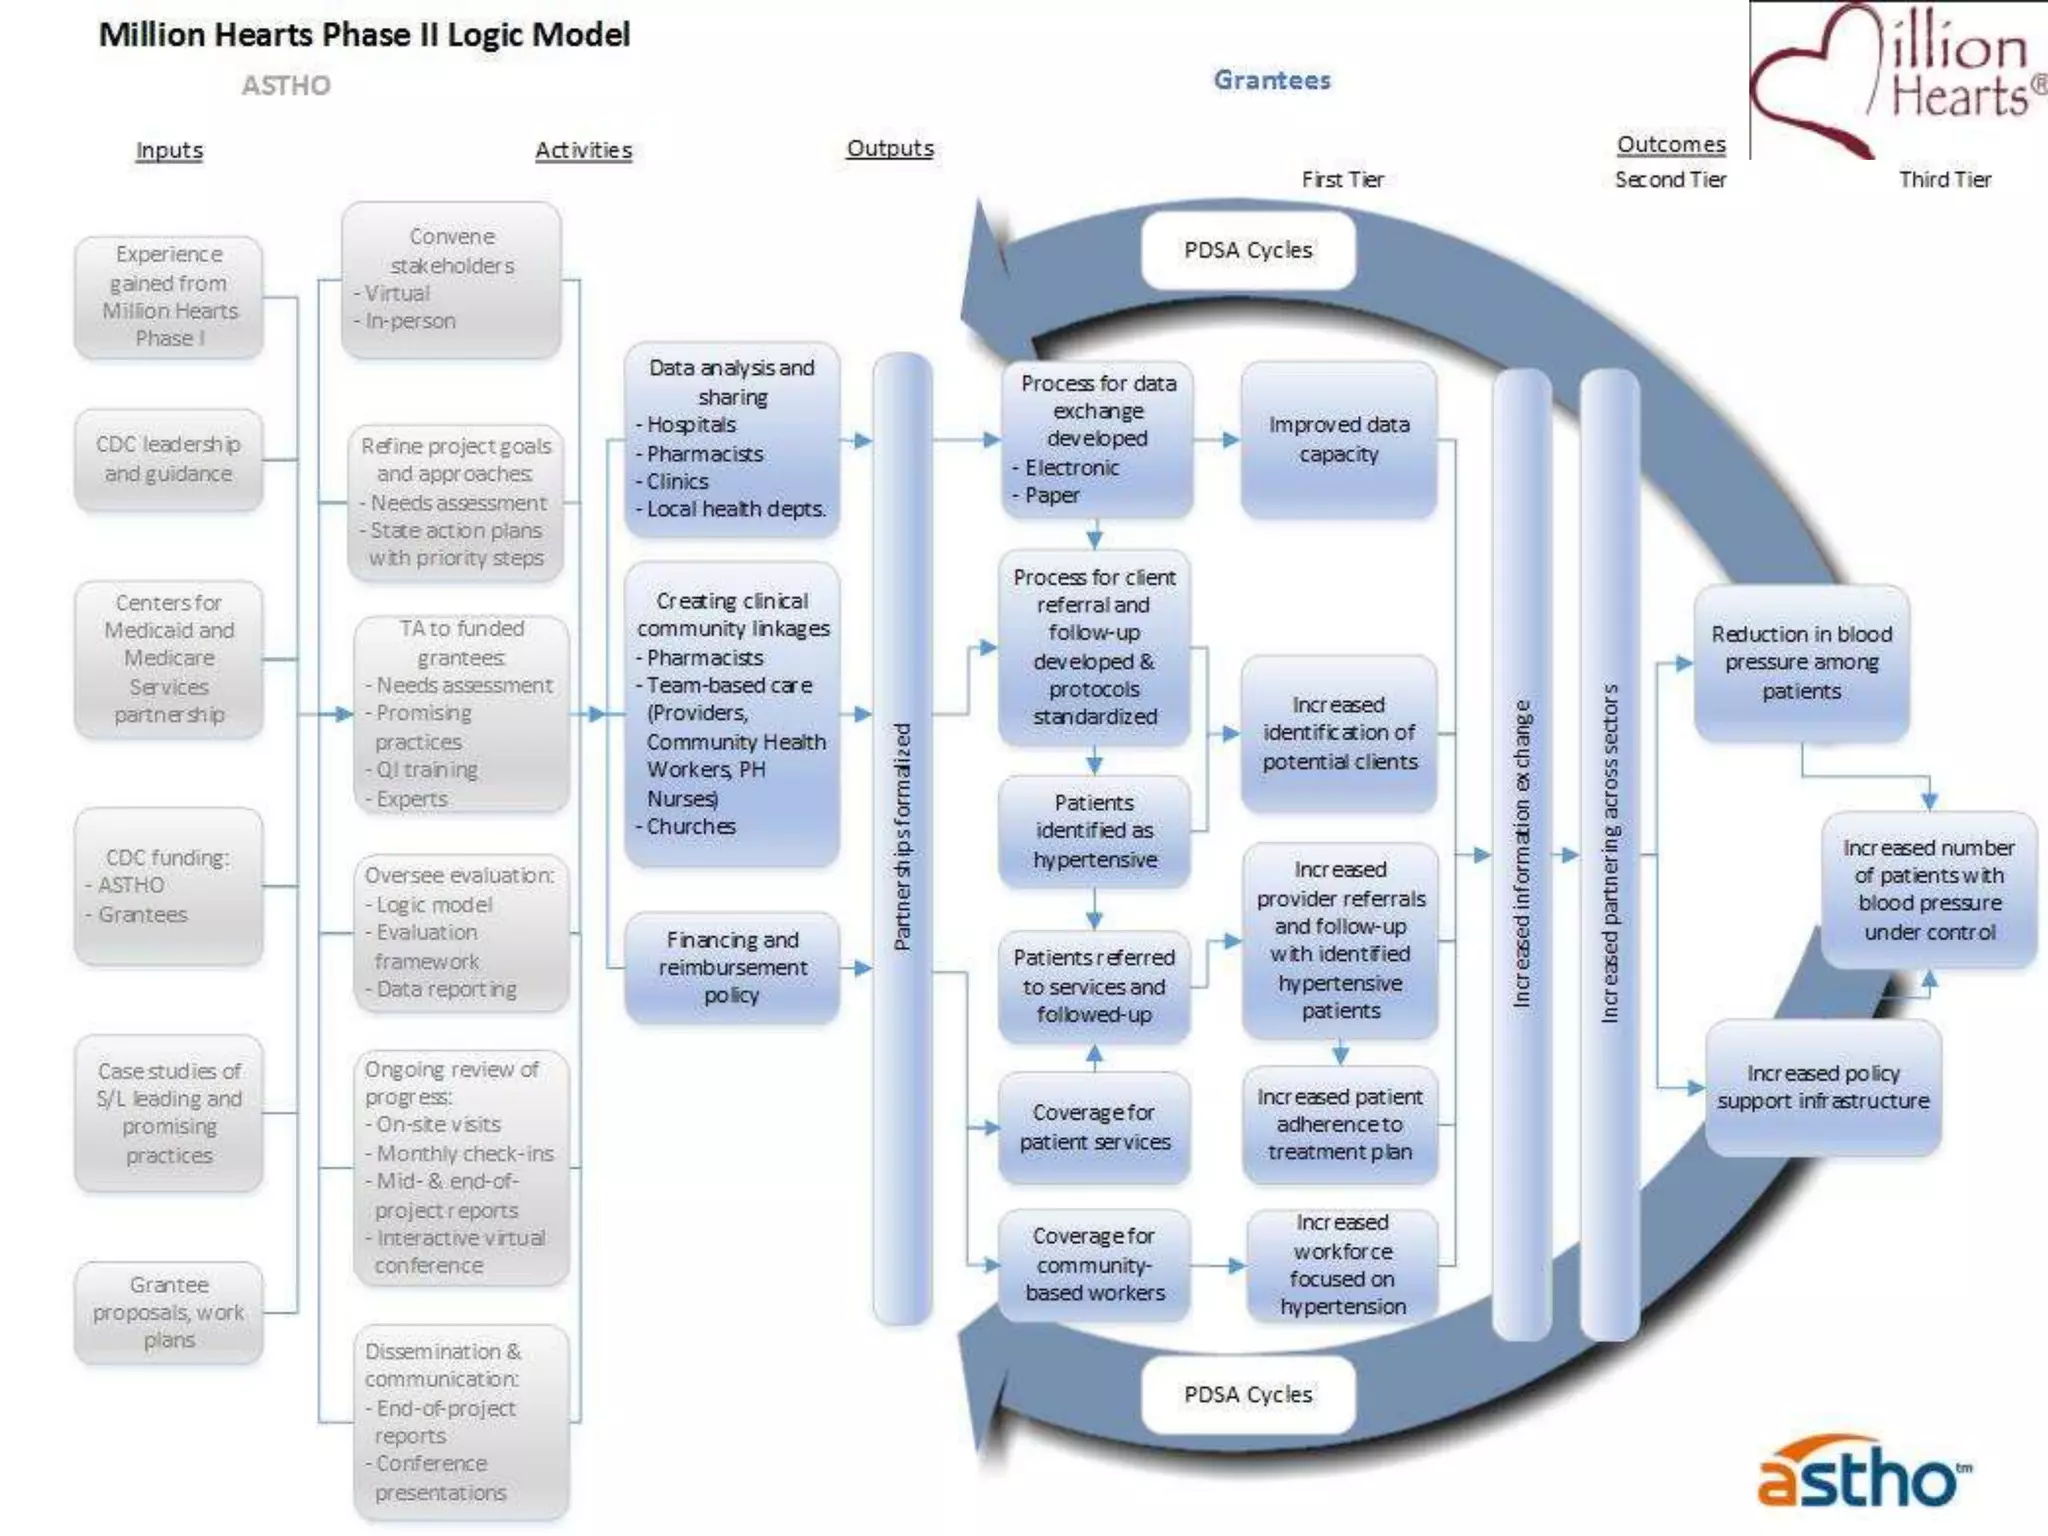
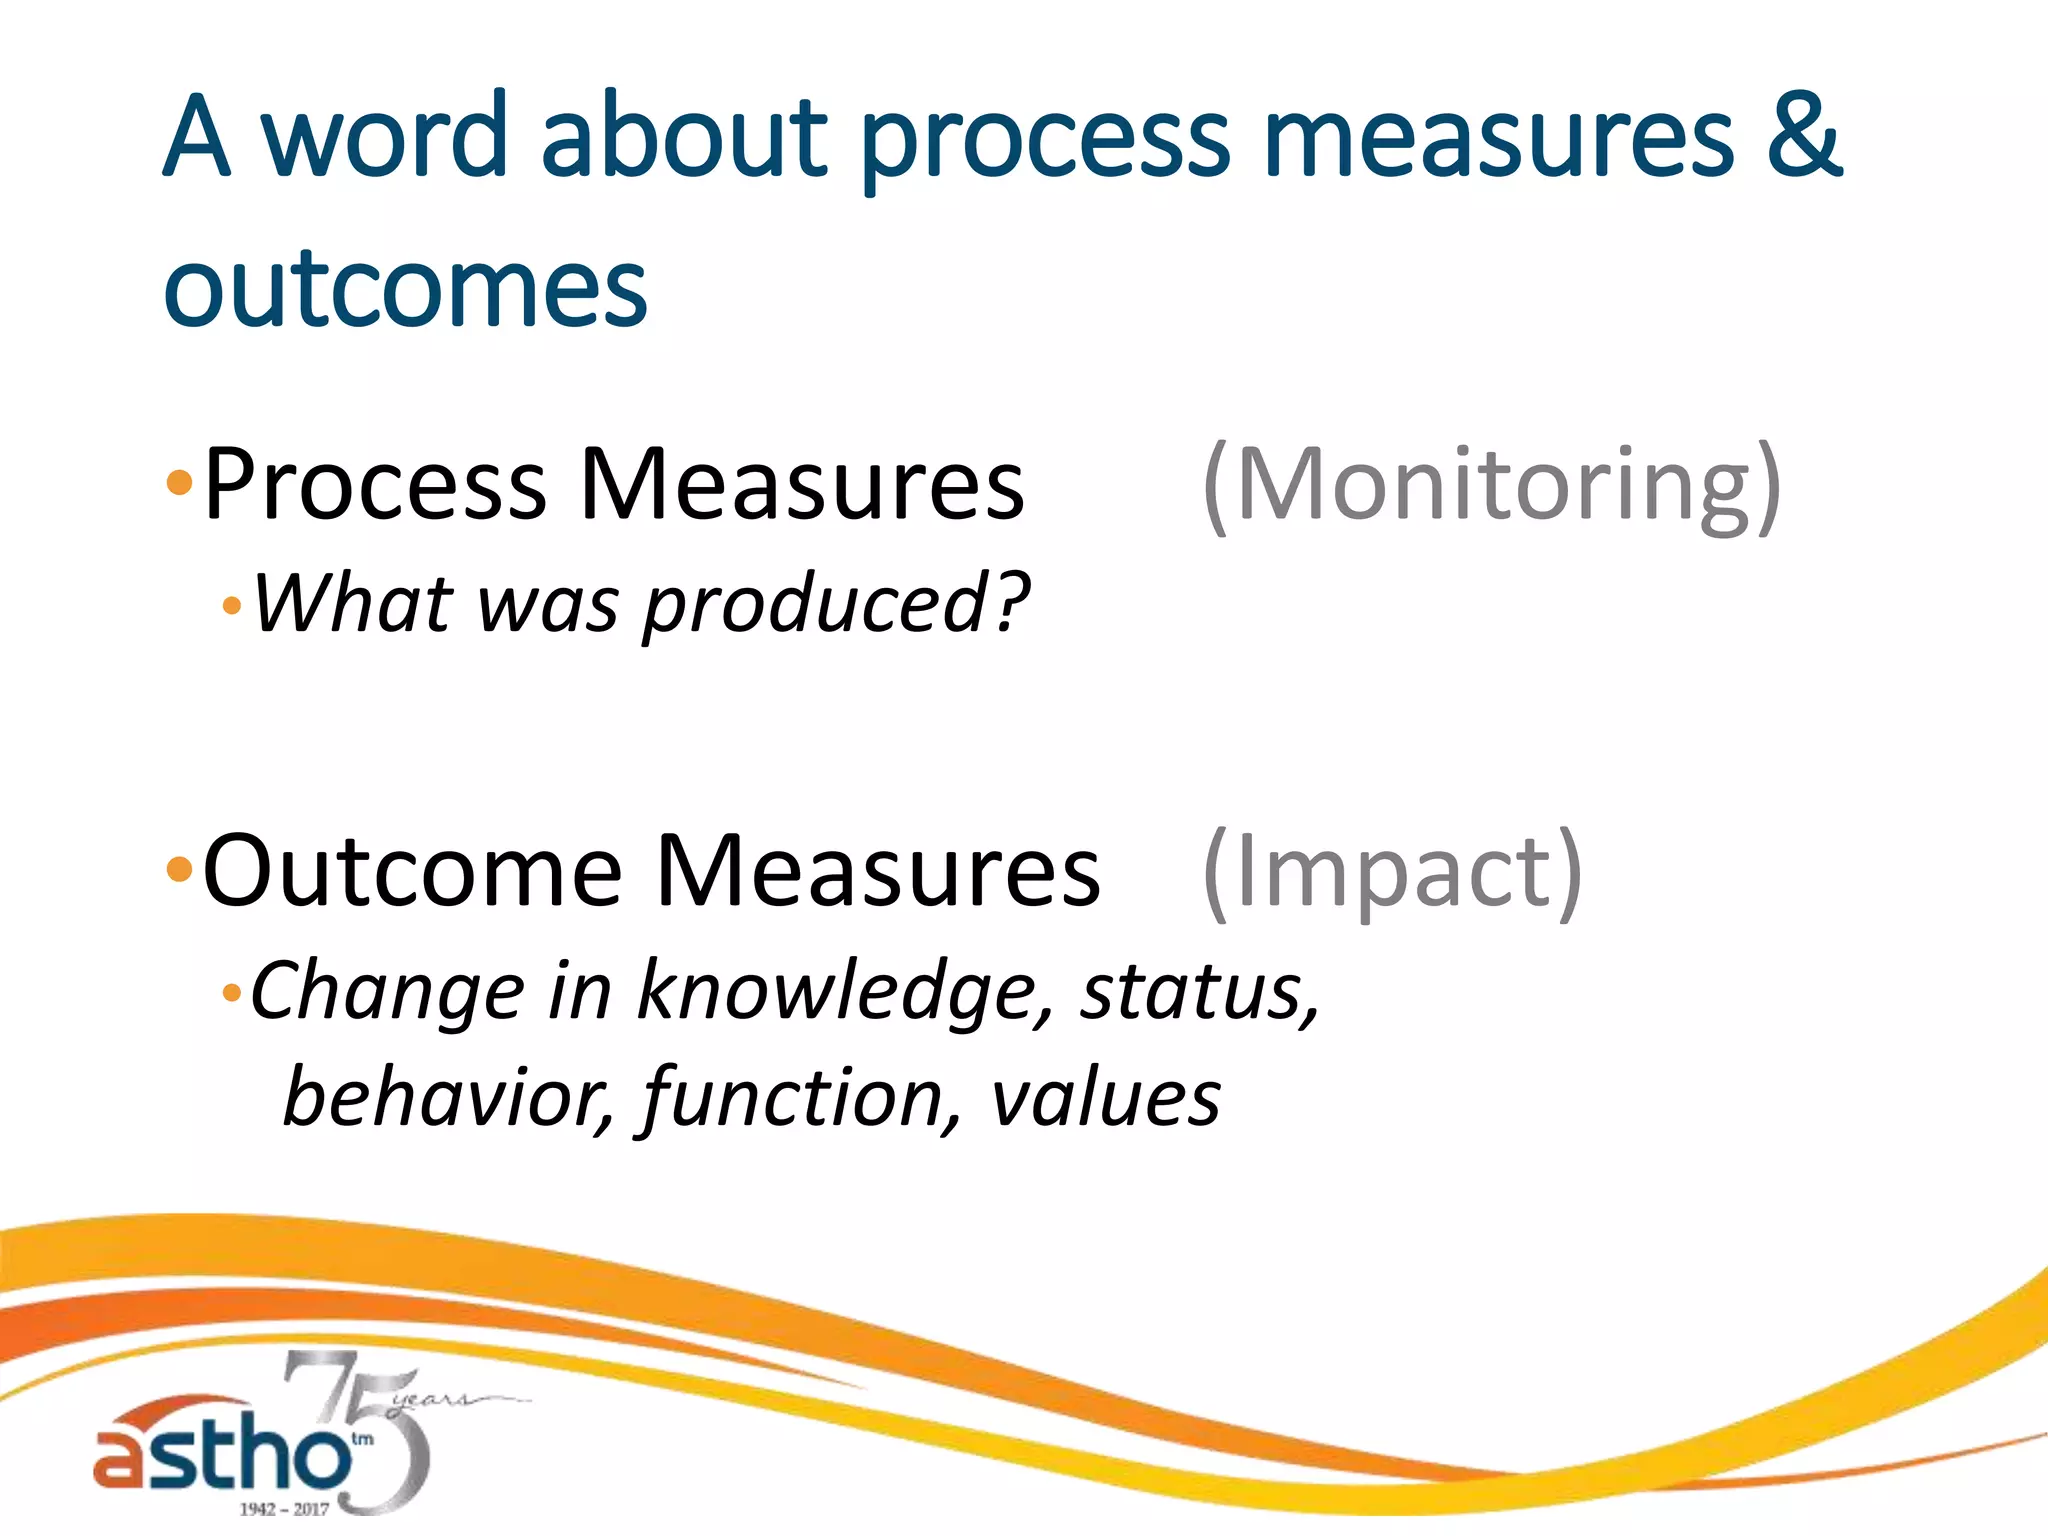
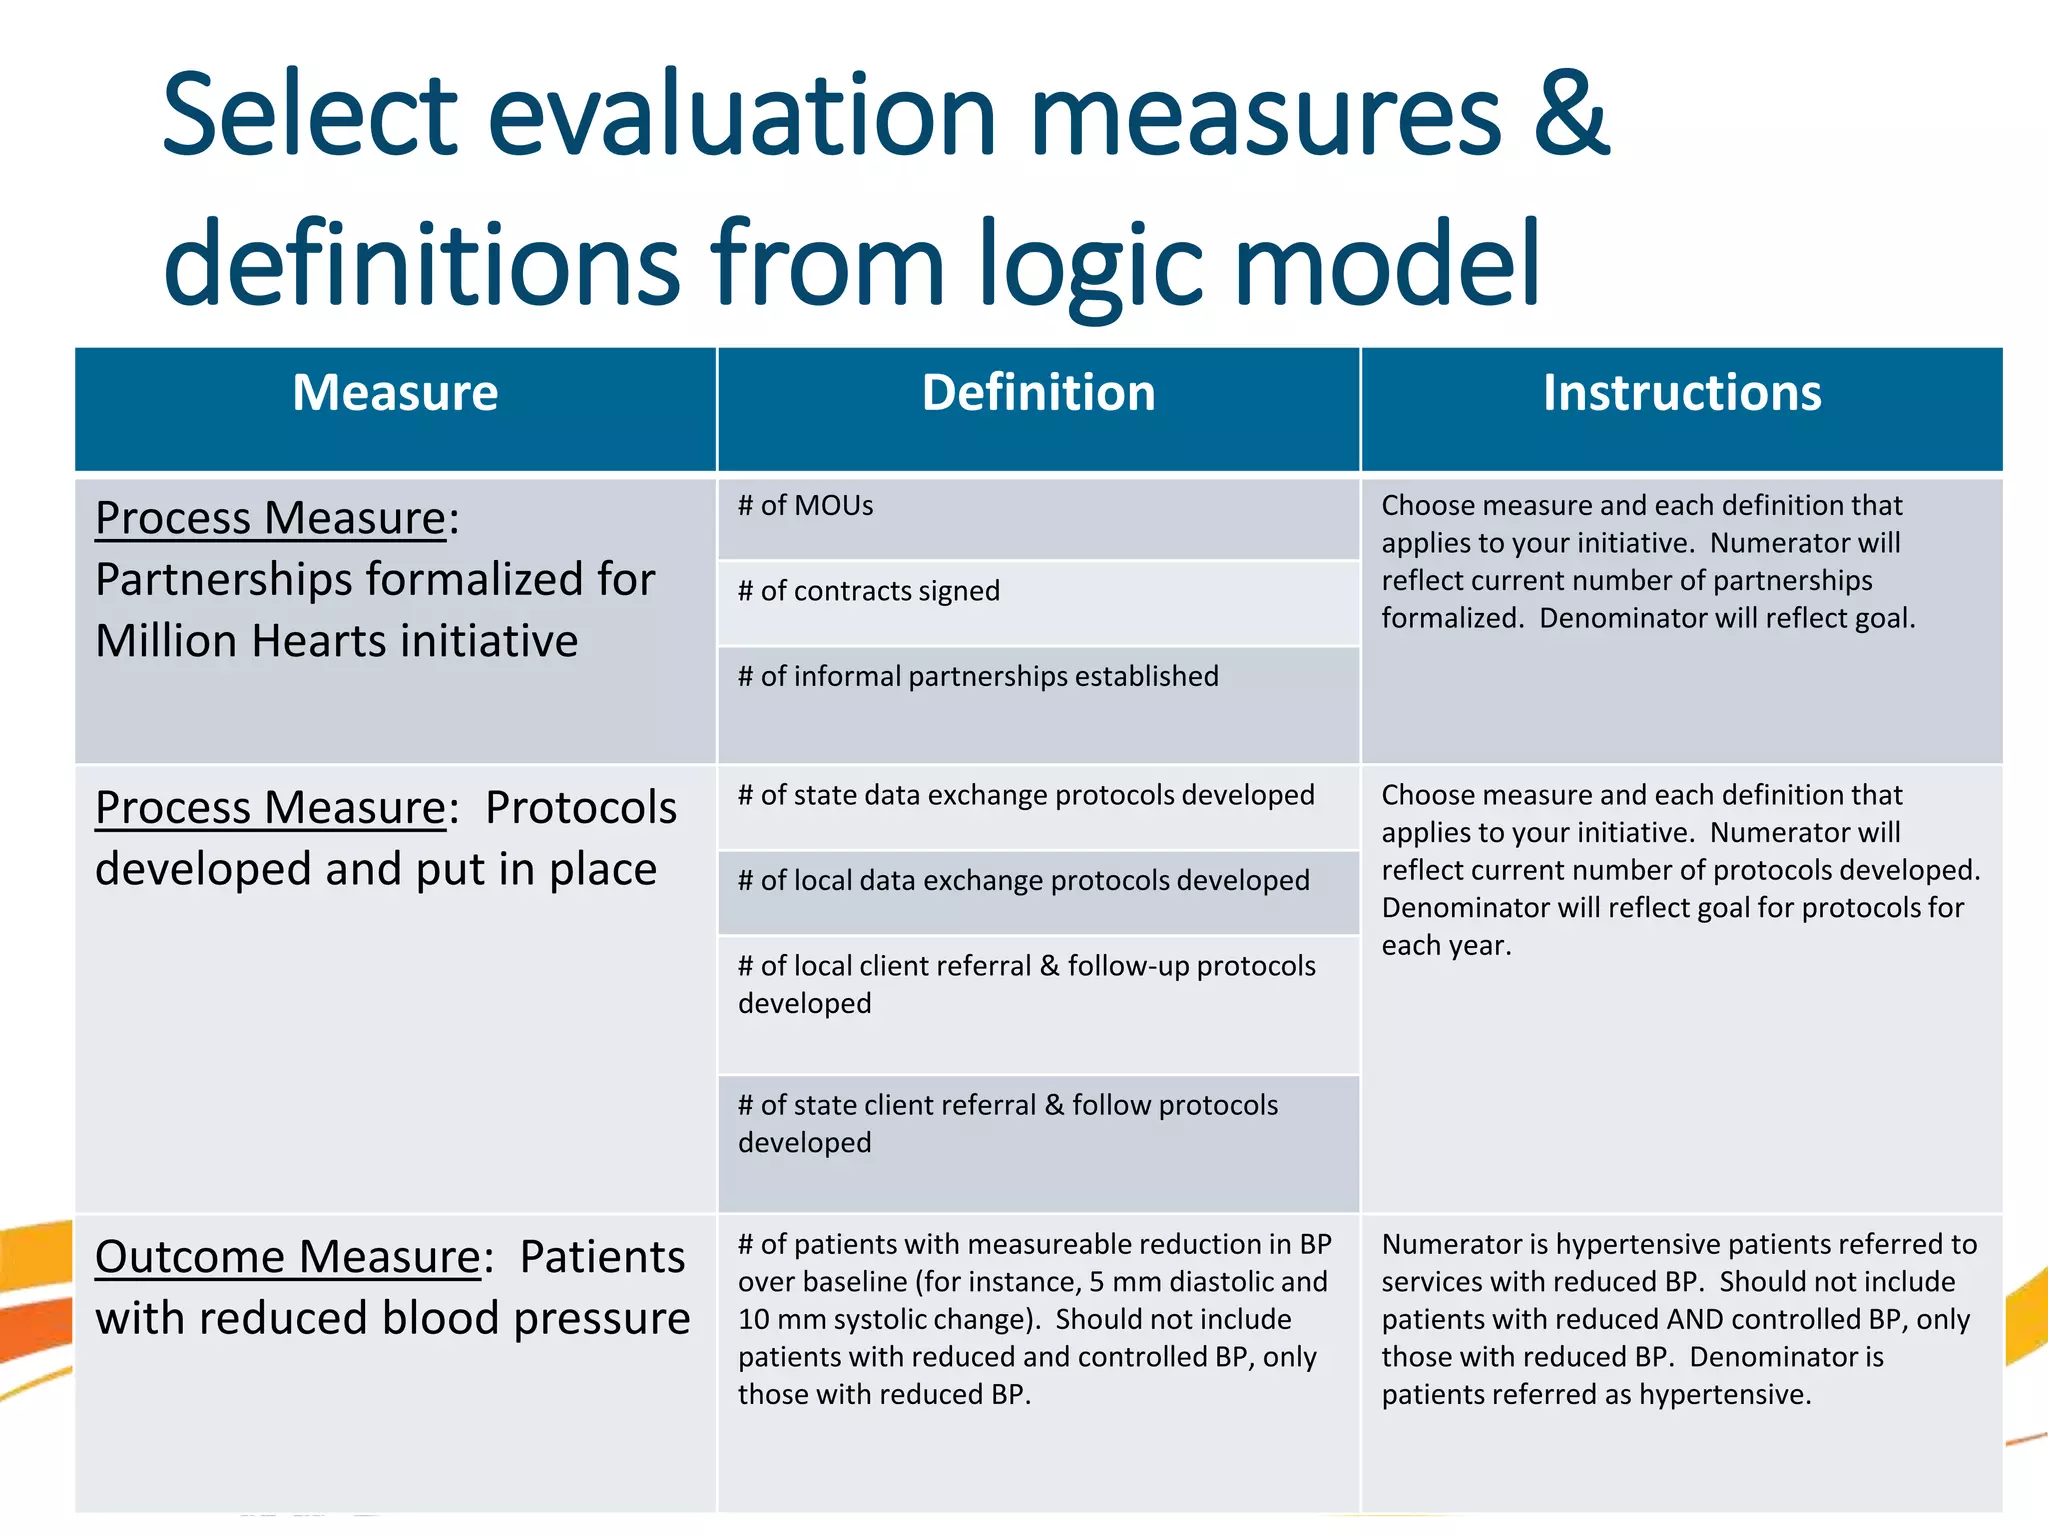
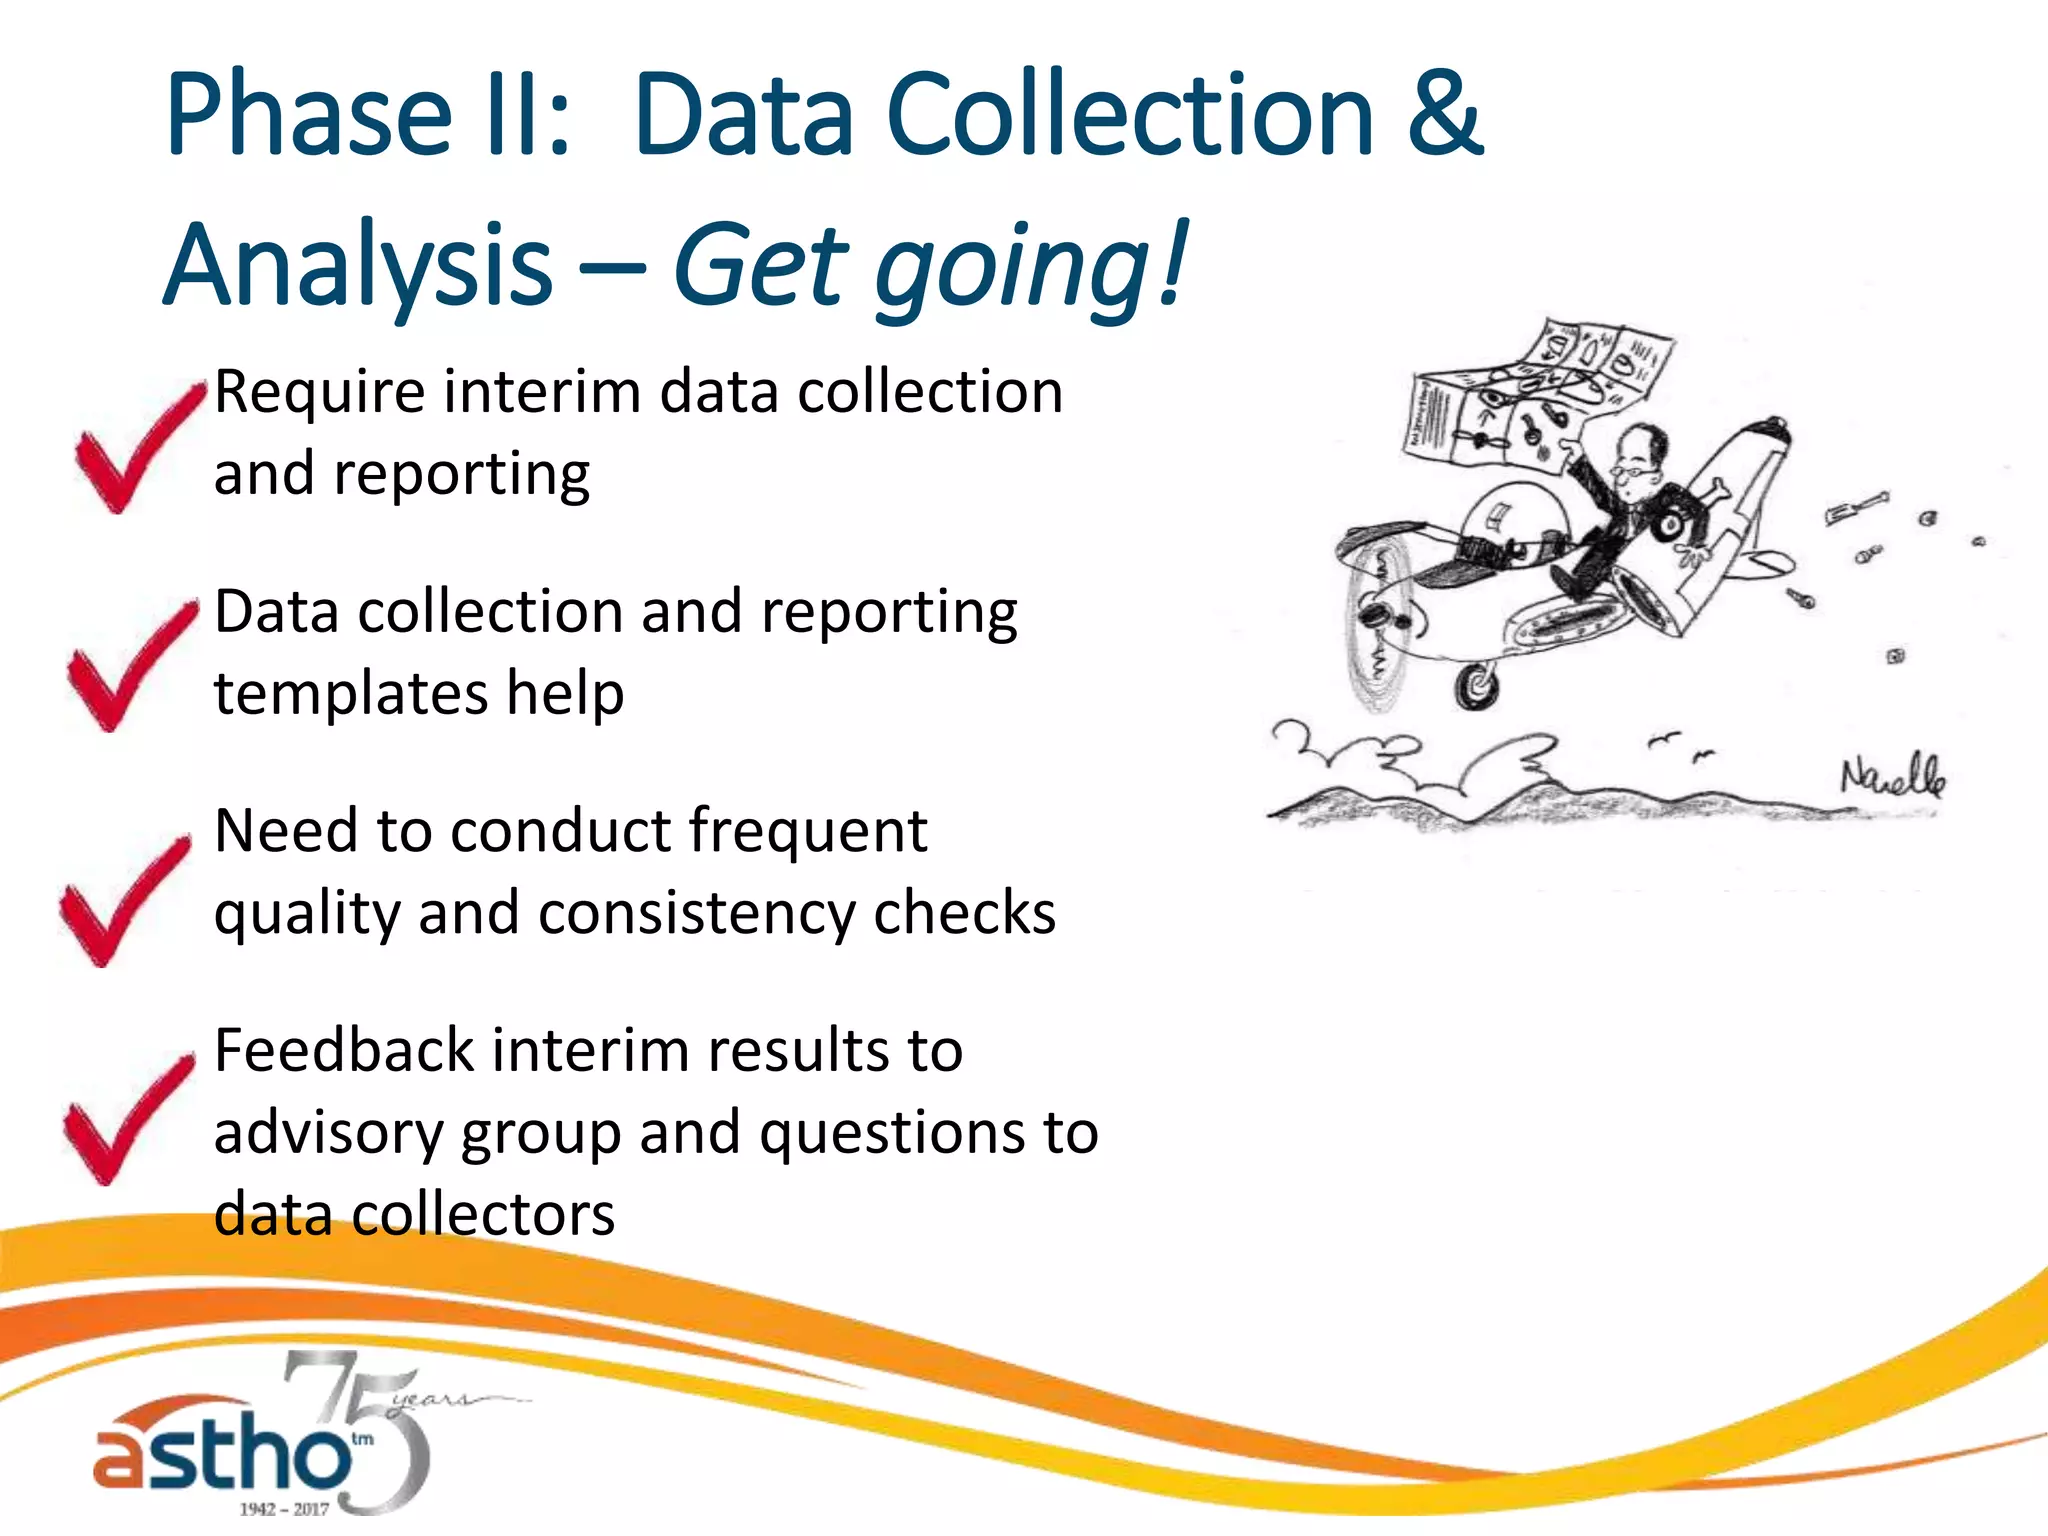
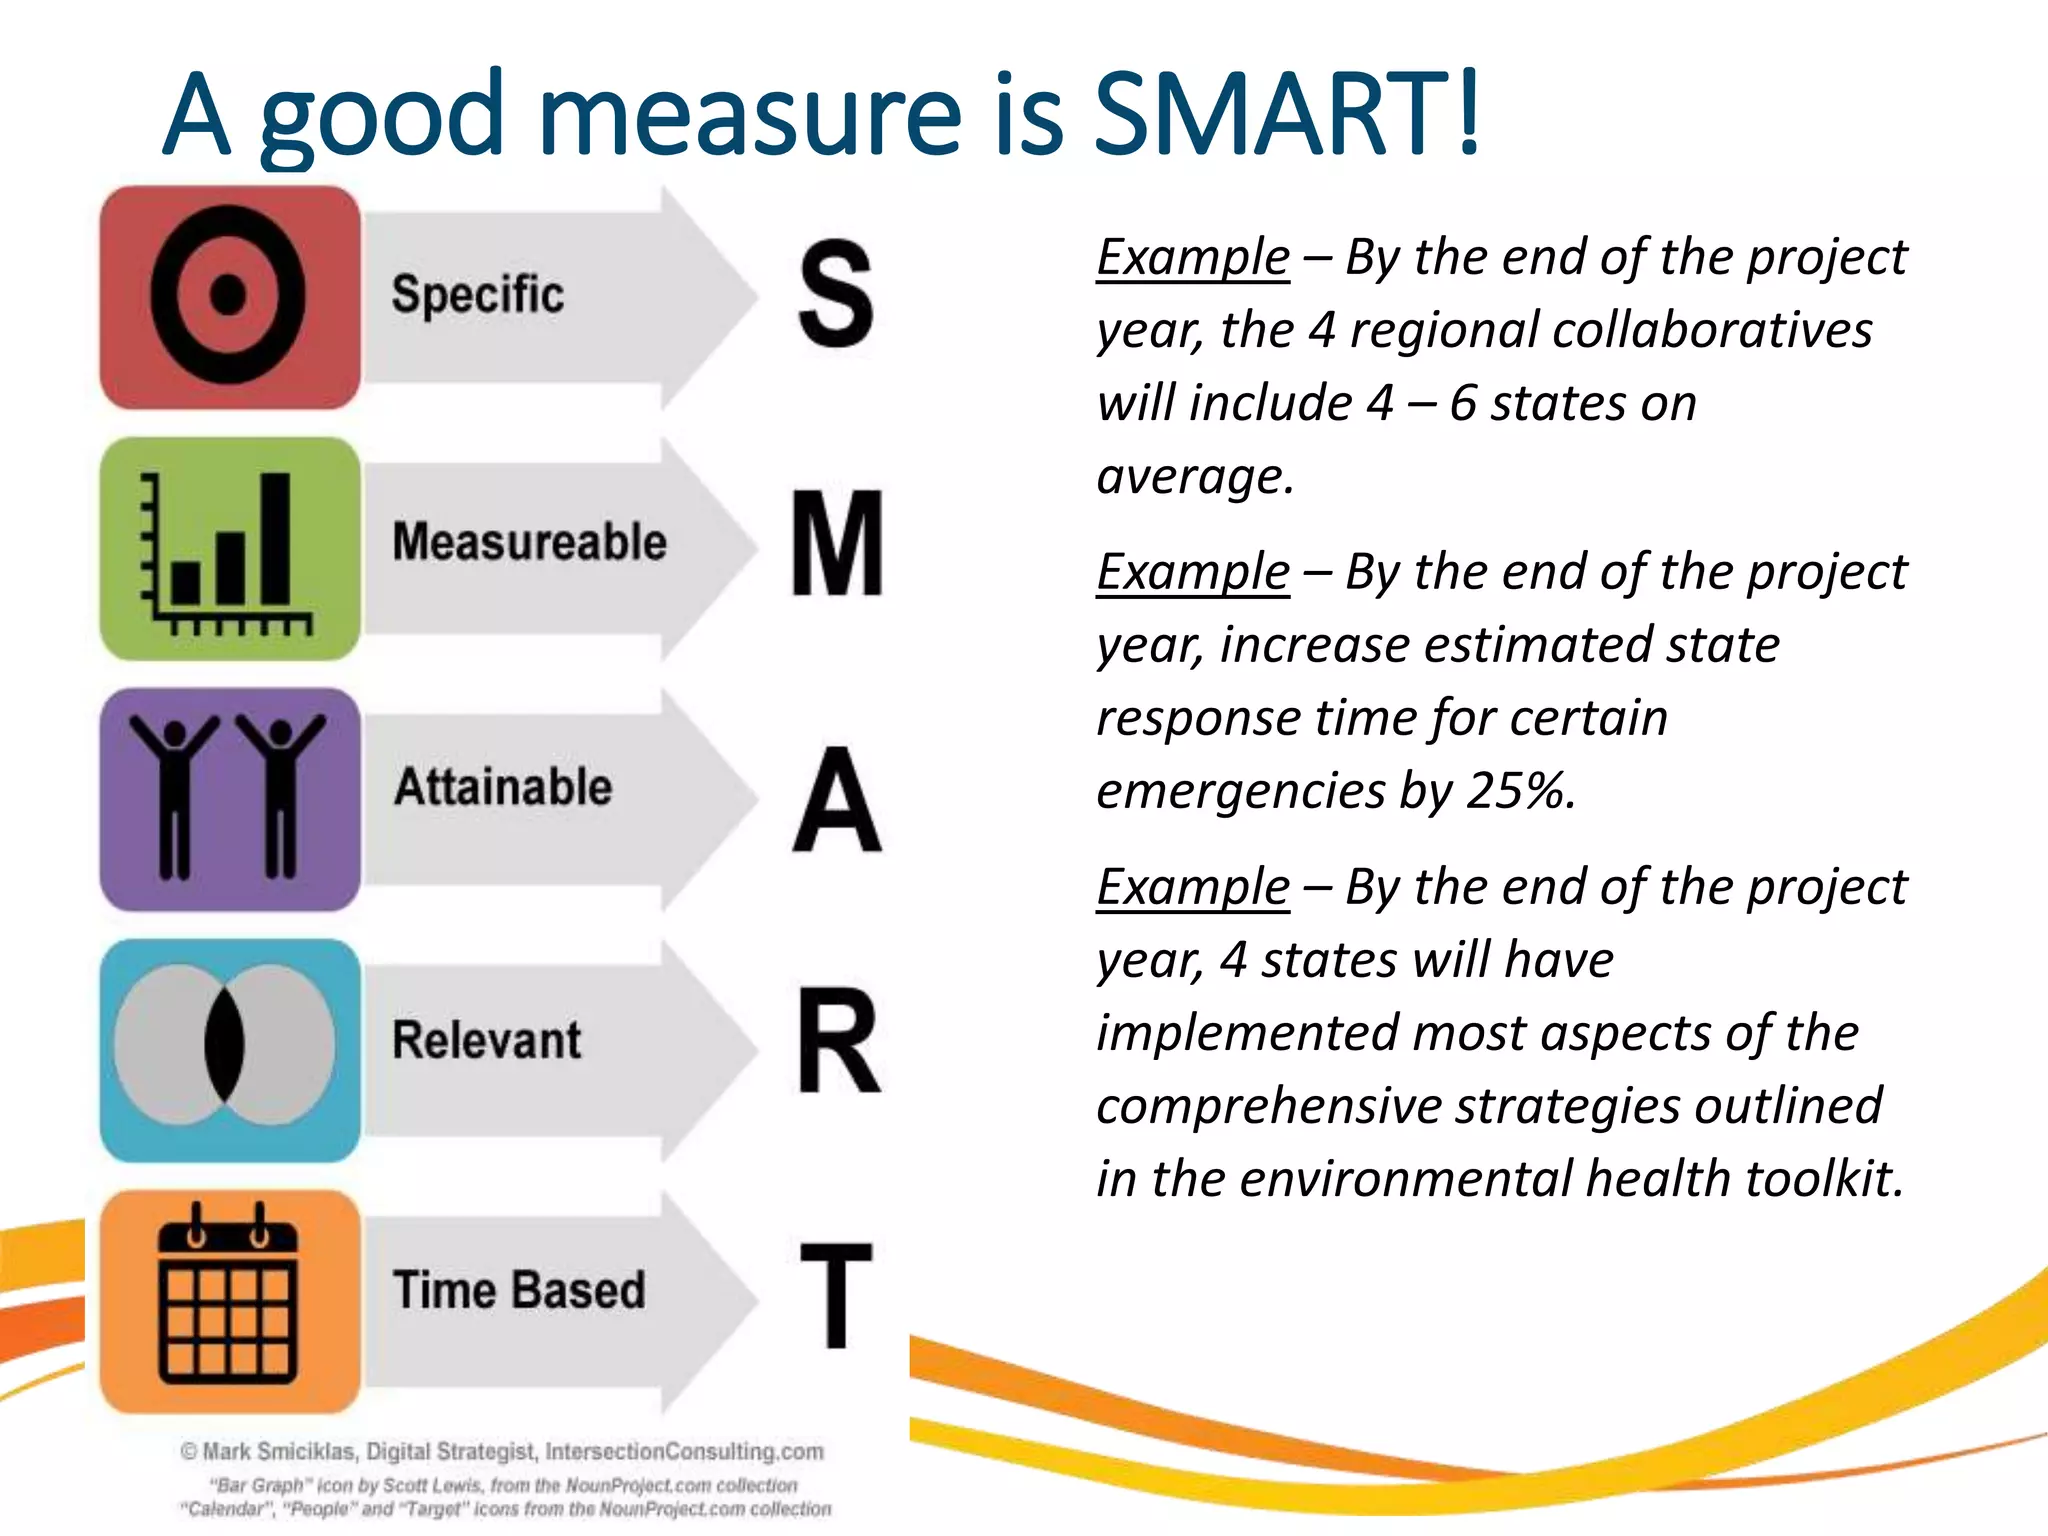
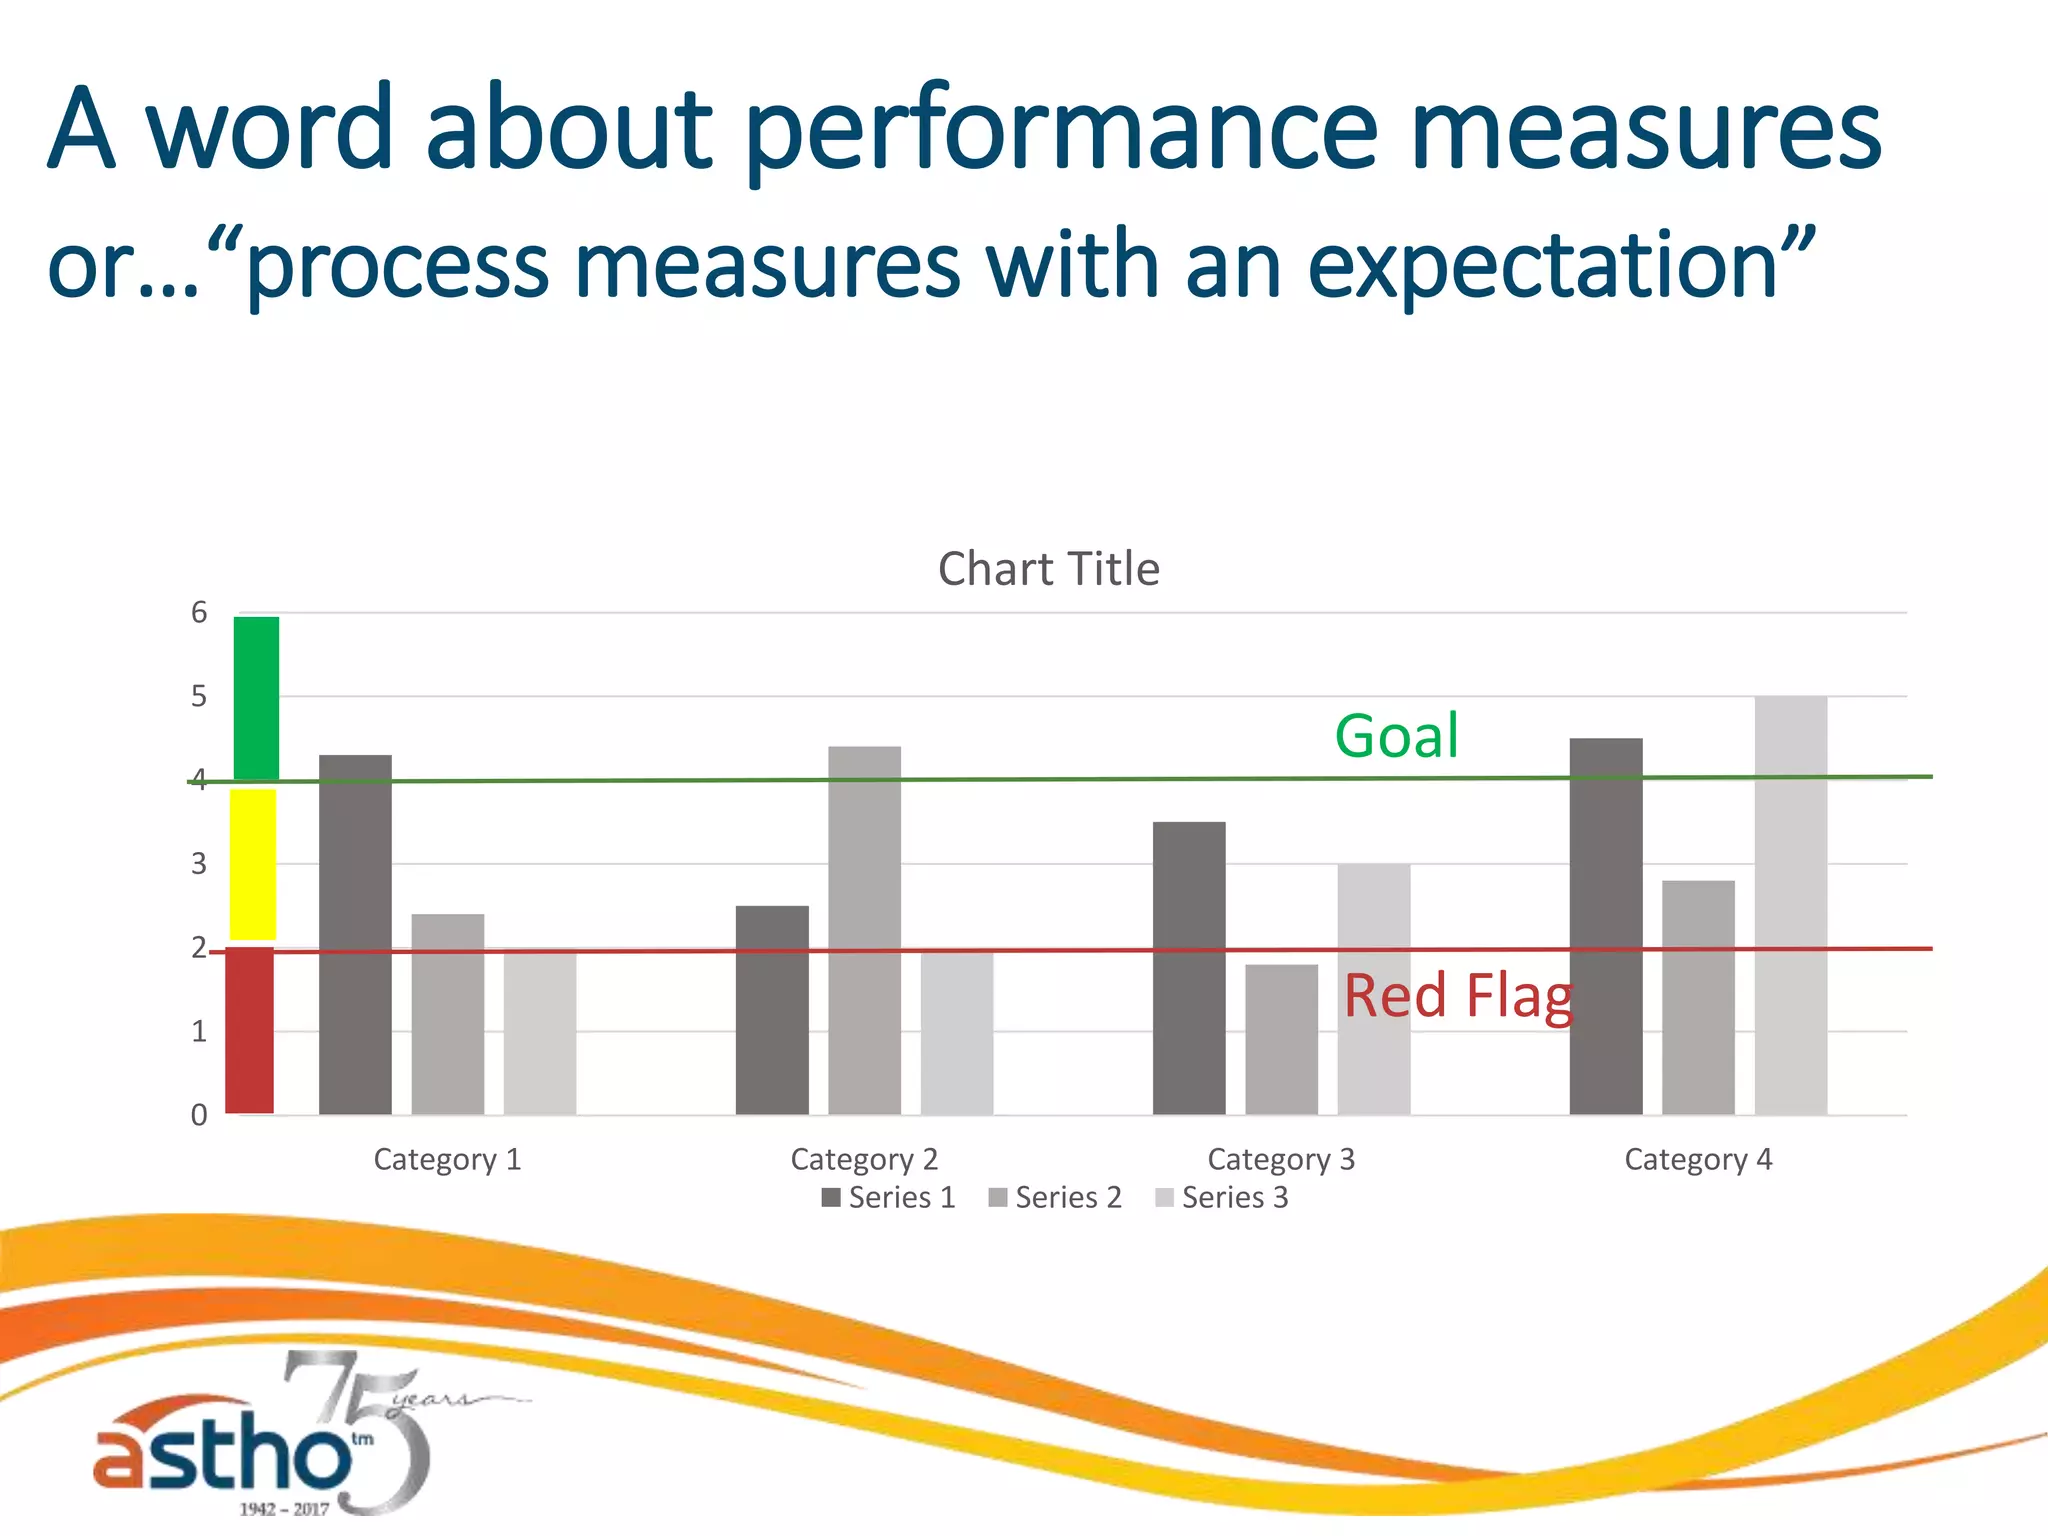
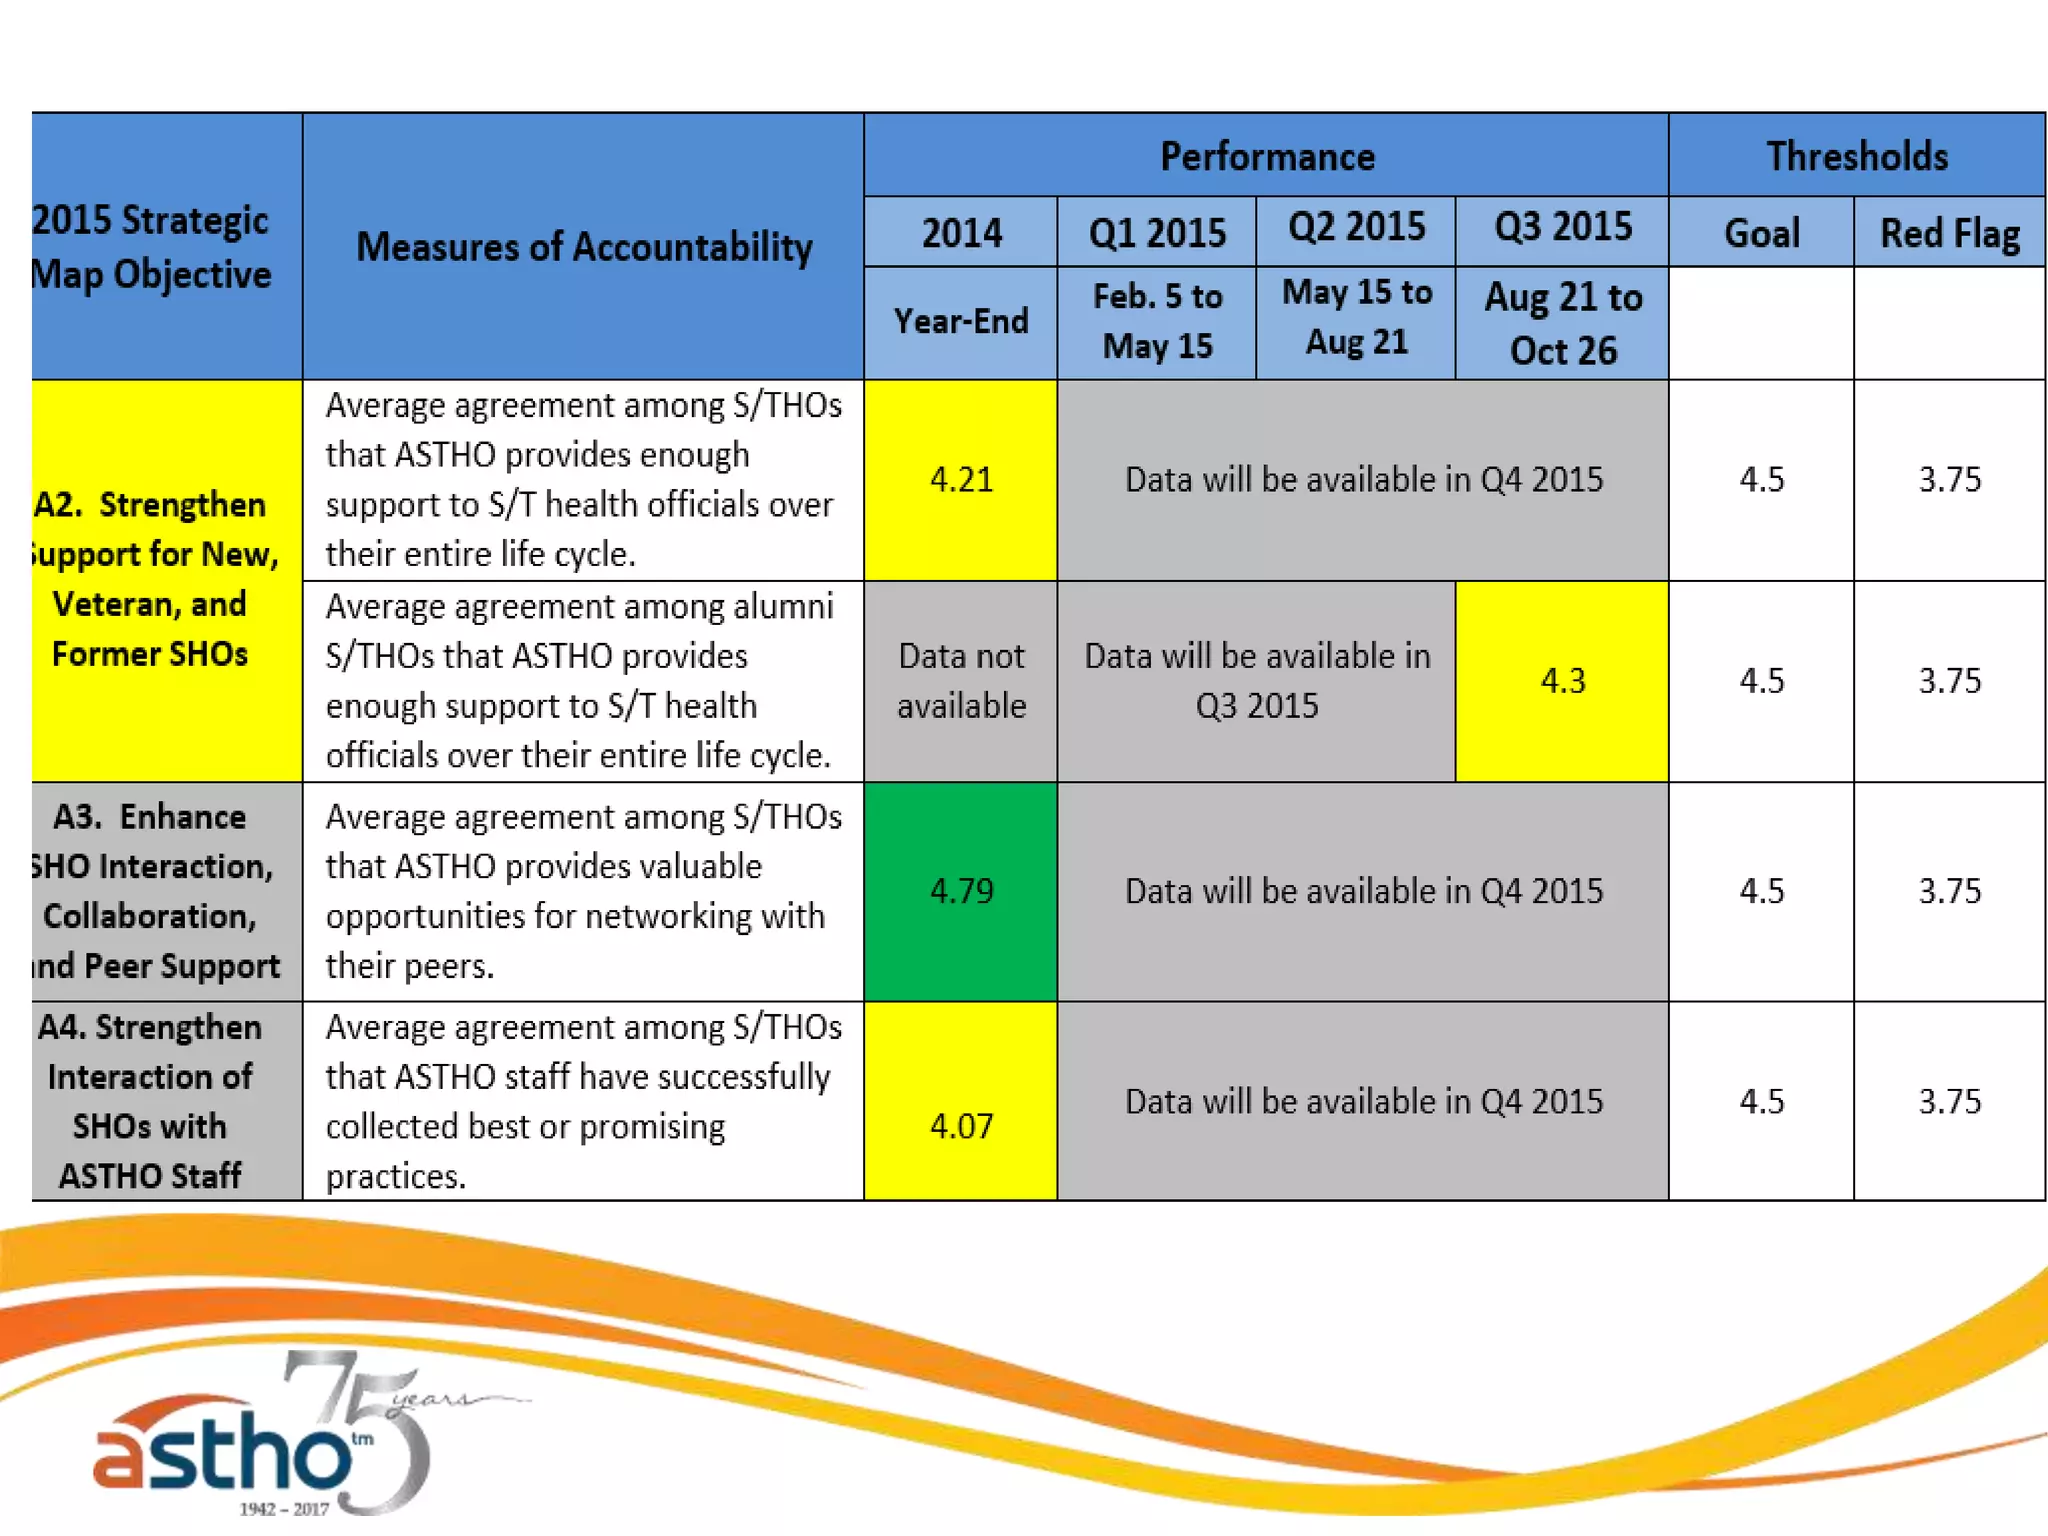
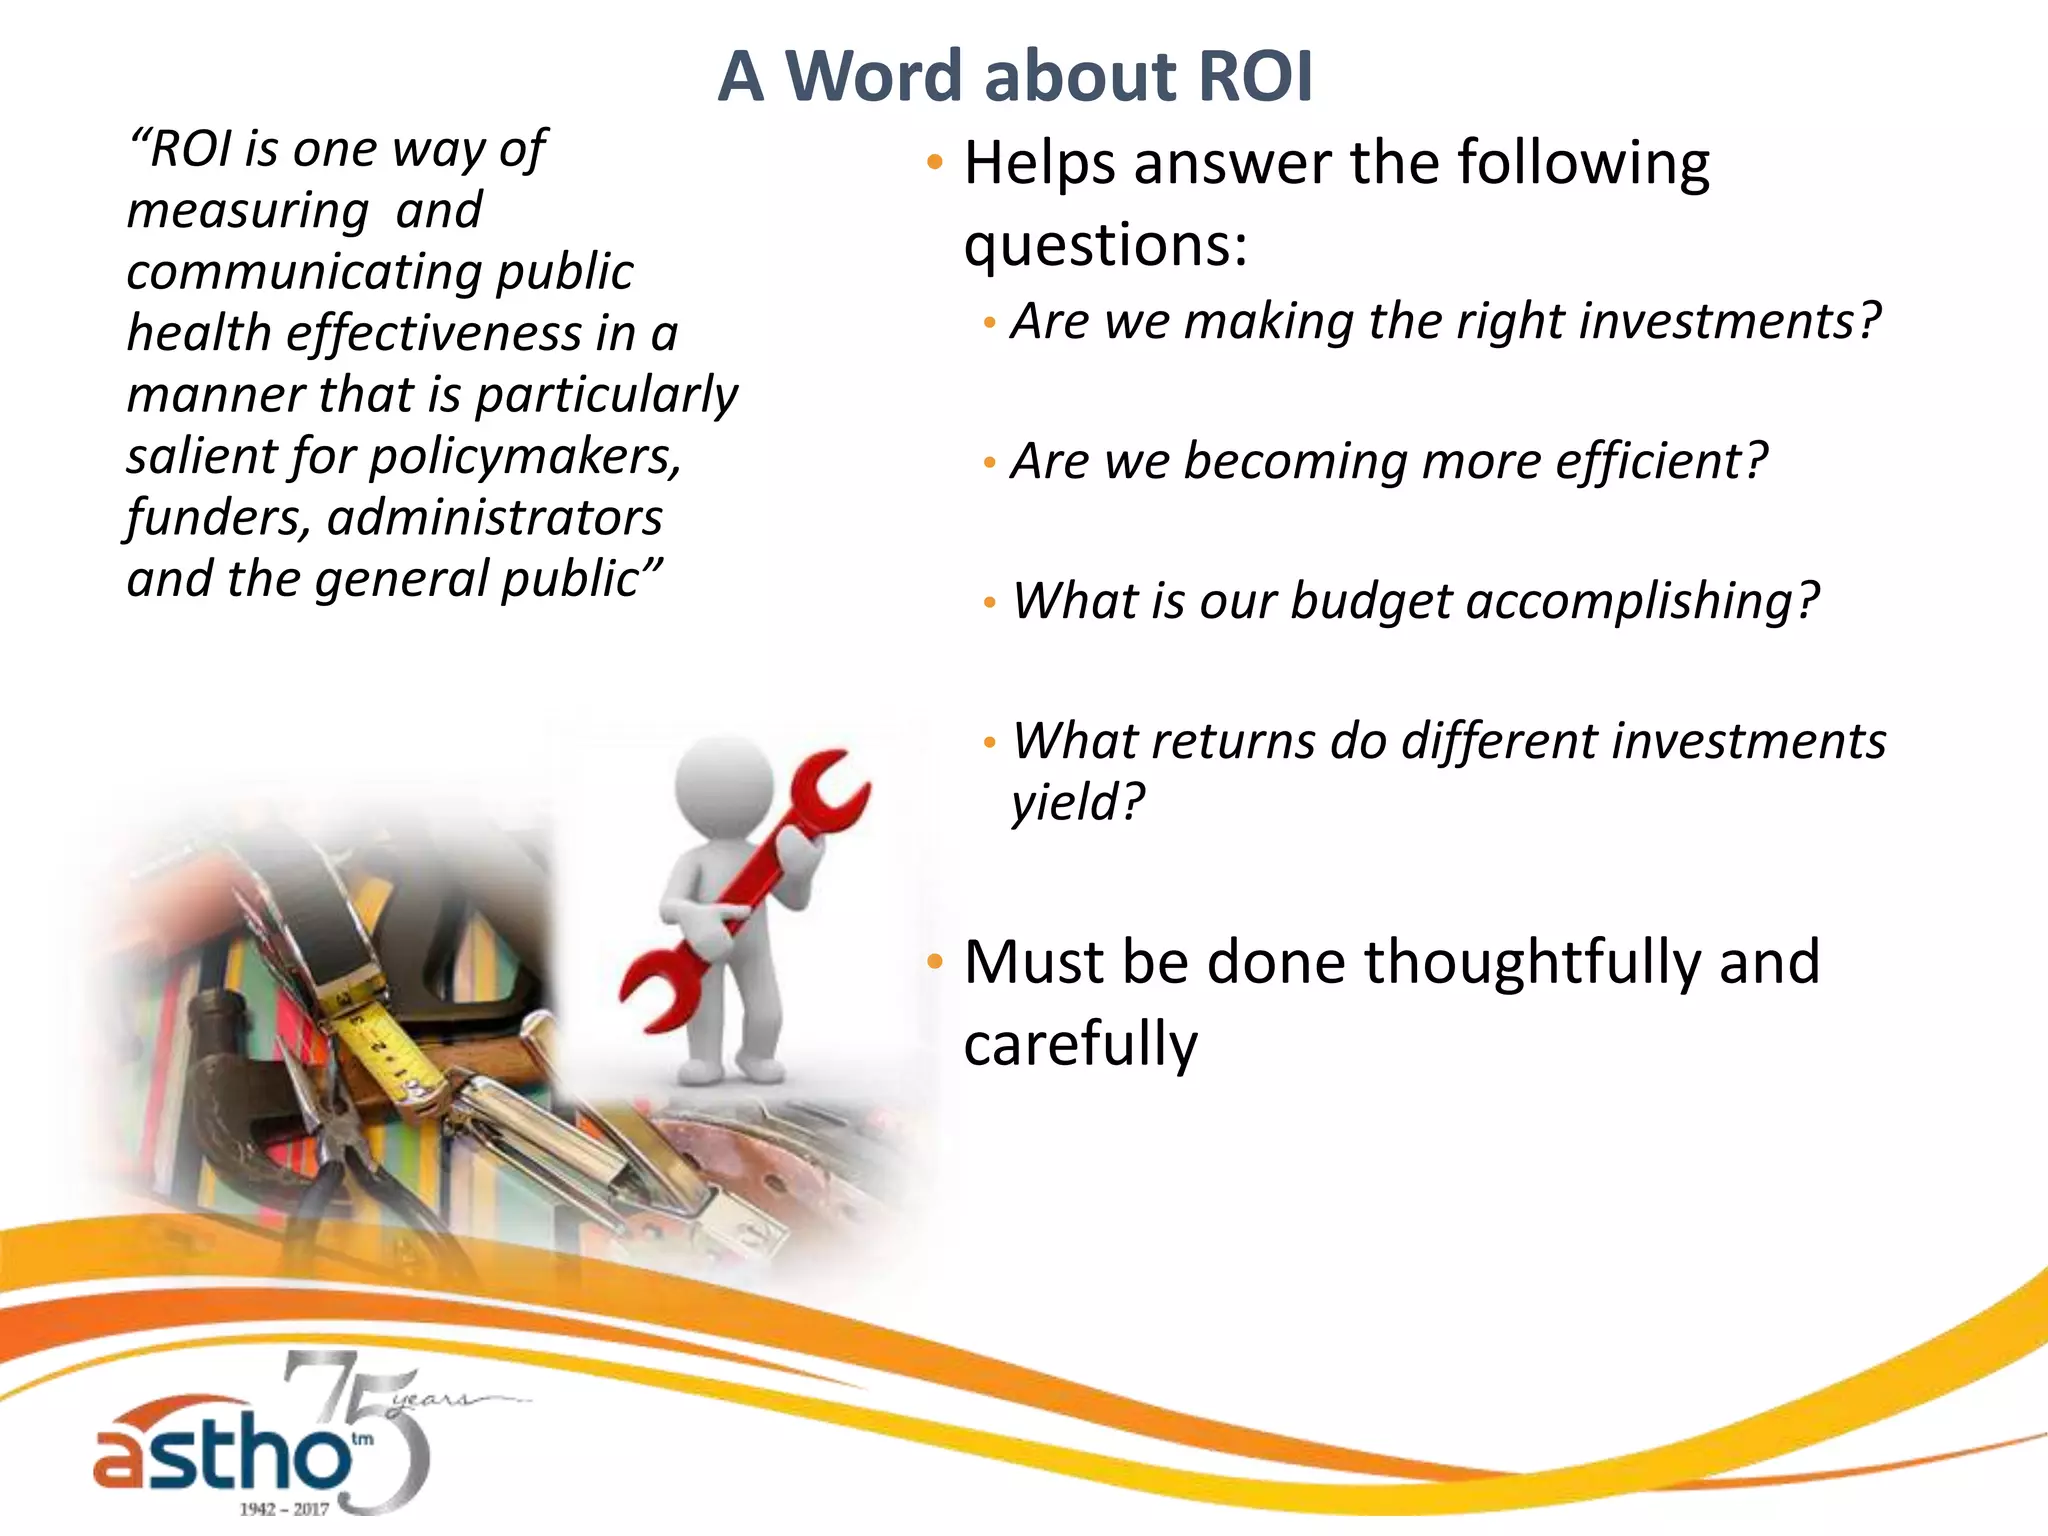
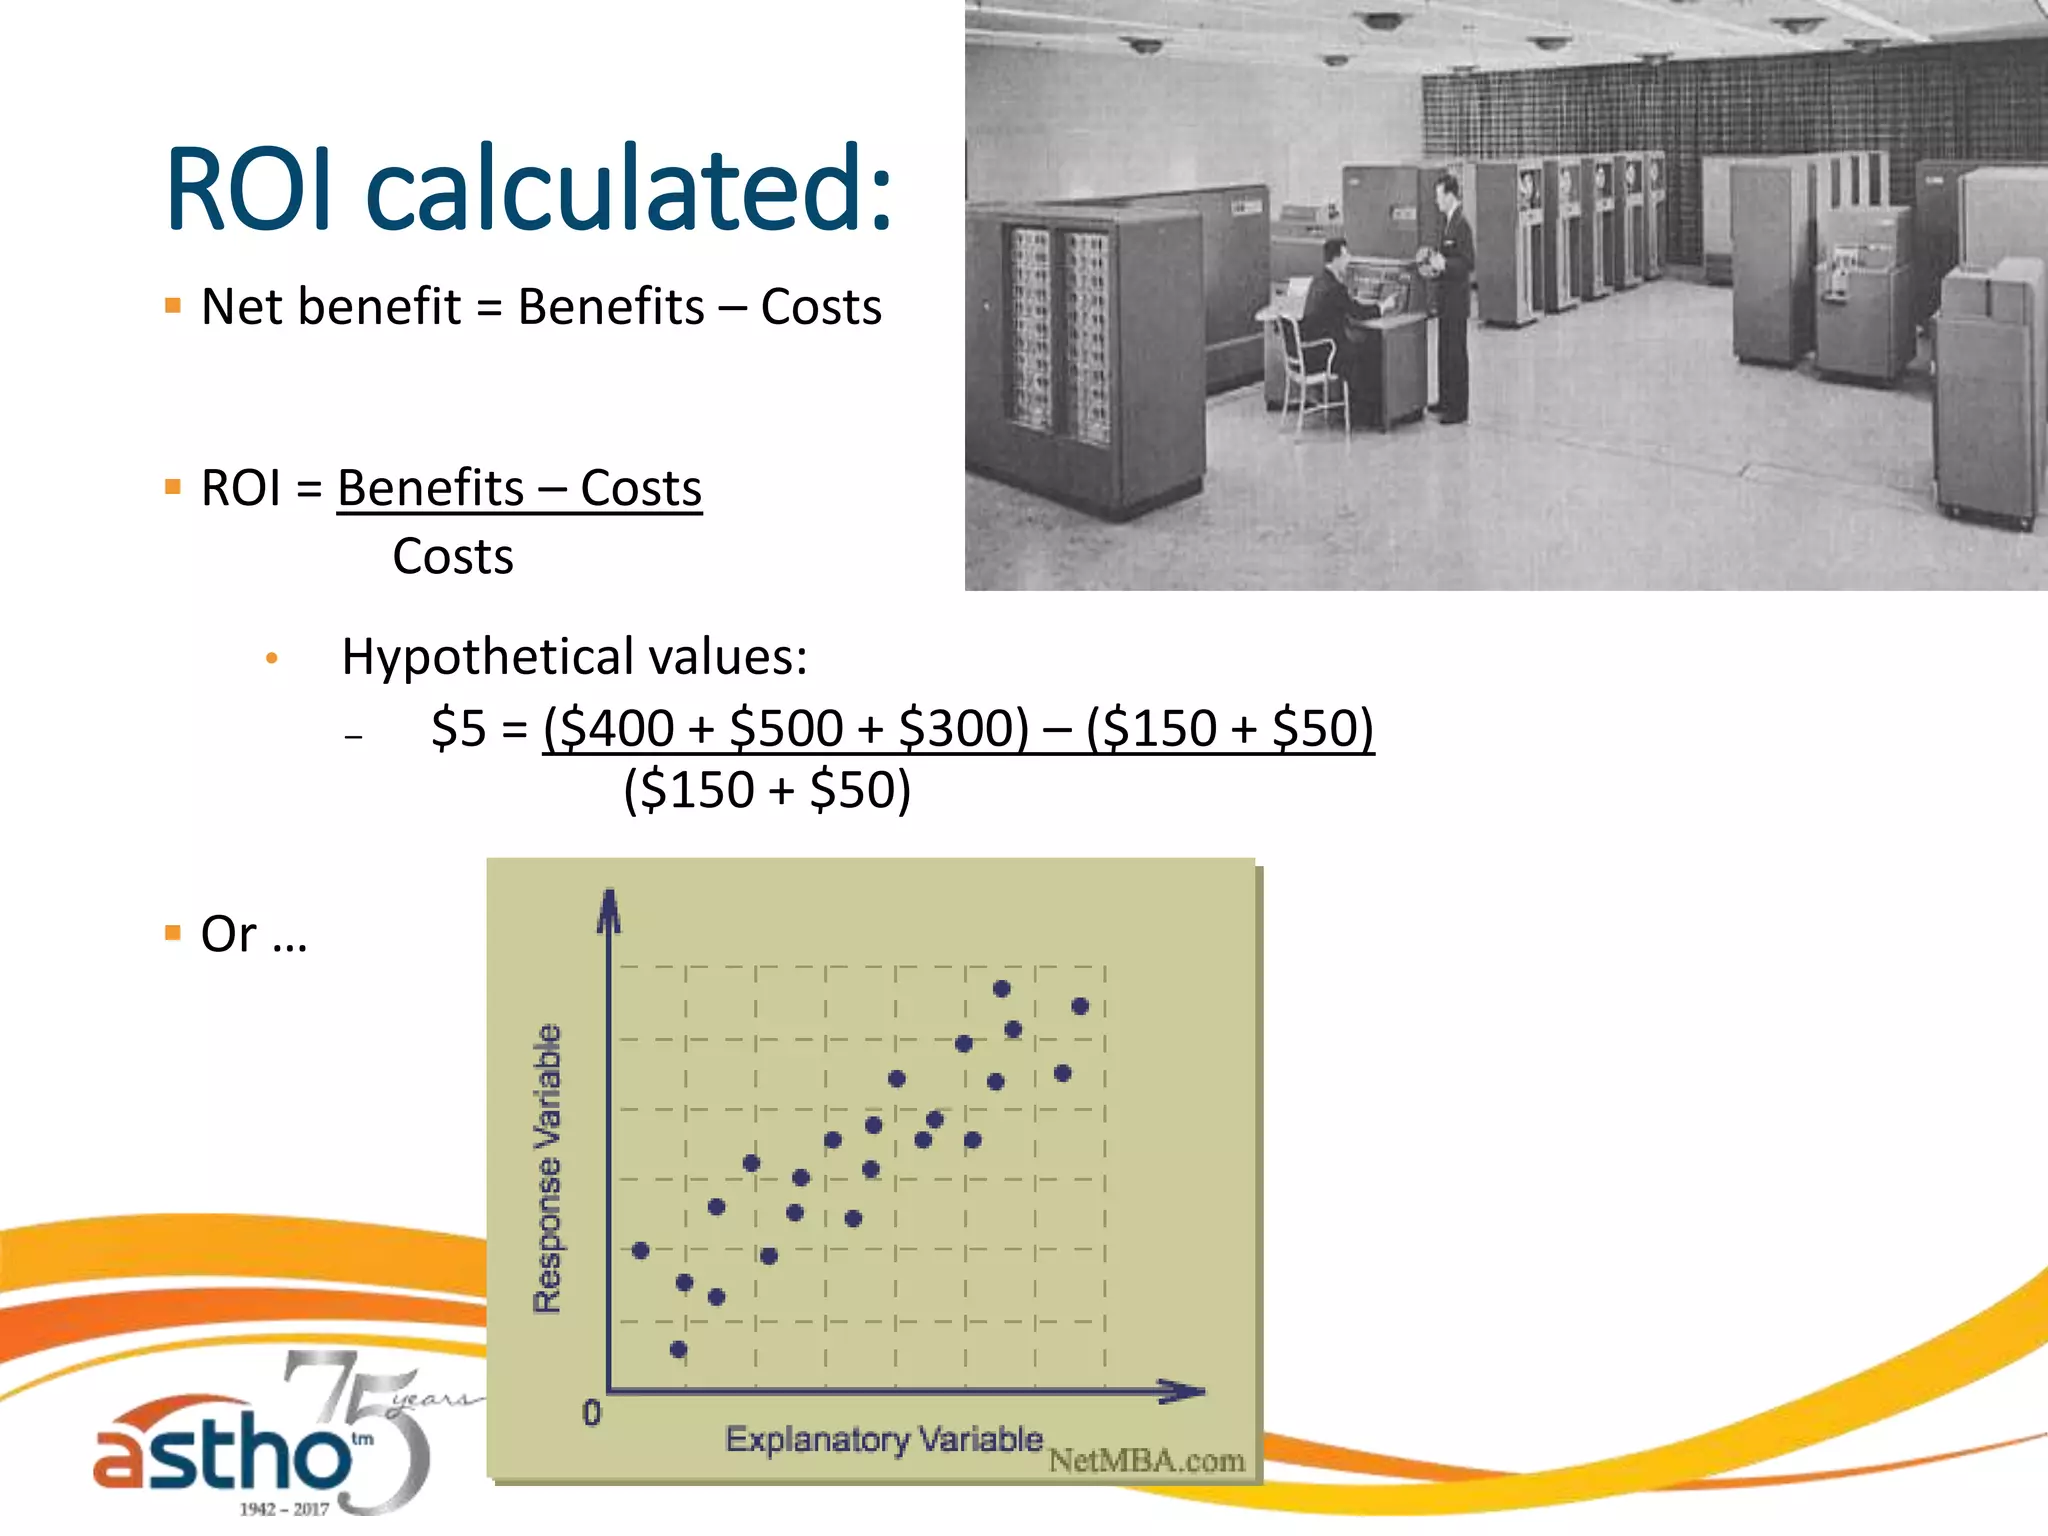


The document outlines steps for developing a performance measurement and evaluation plan for public health programs. It discusses developing logic models and selecting process and outcome measures, collecting interim data, and calculating return on investment. The goal is to show stakeholders like funders and policymakers how programs are performing and achieving impacts in a manner that promotes continuous program improvement.


