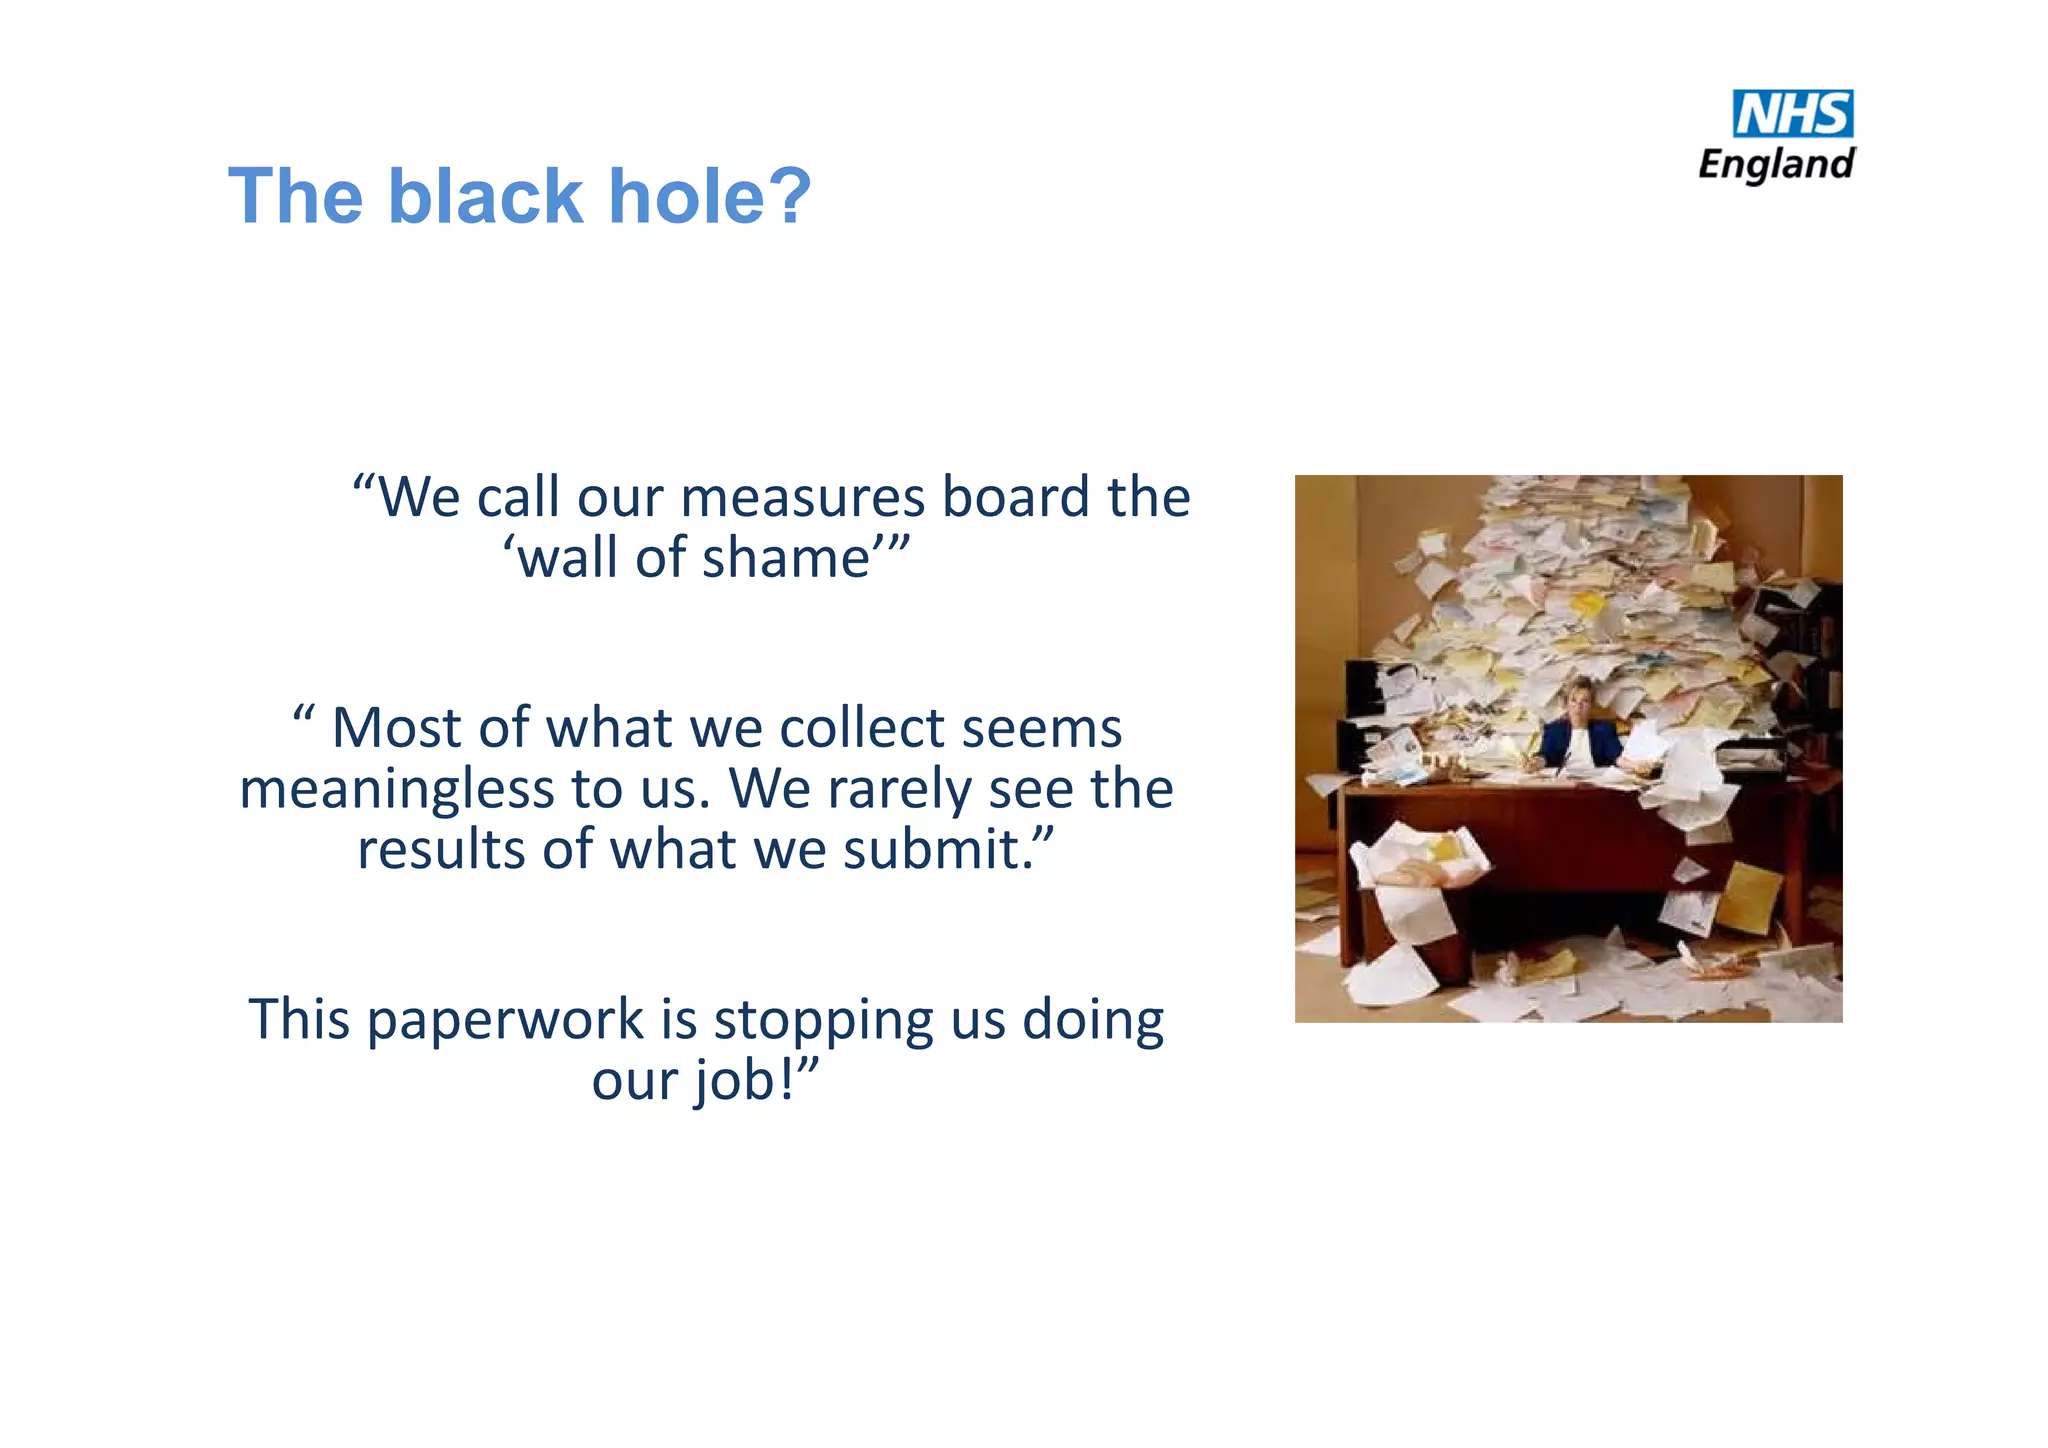
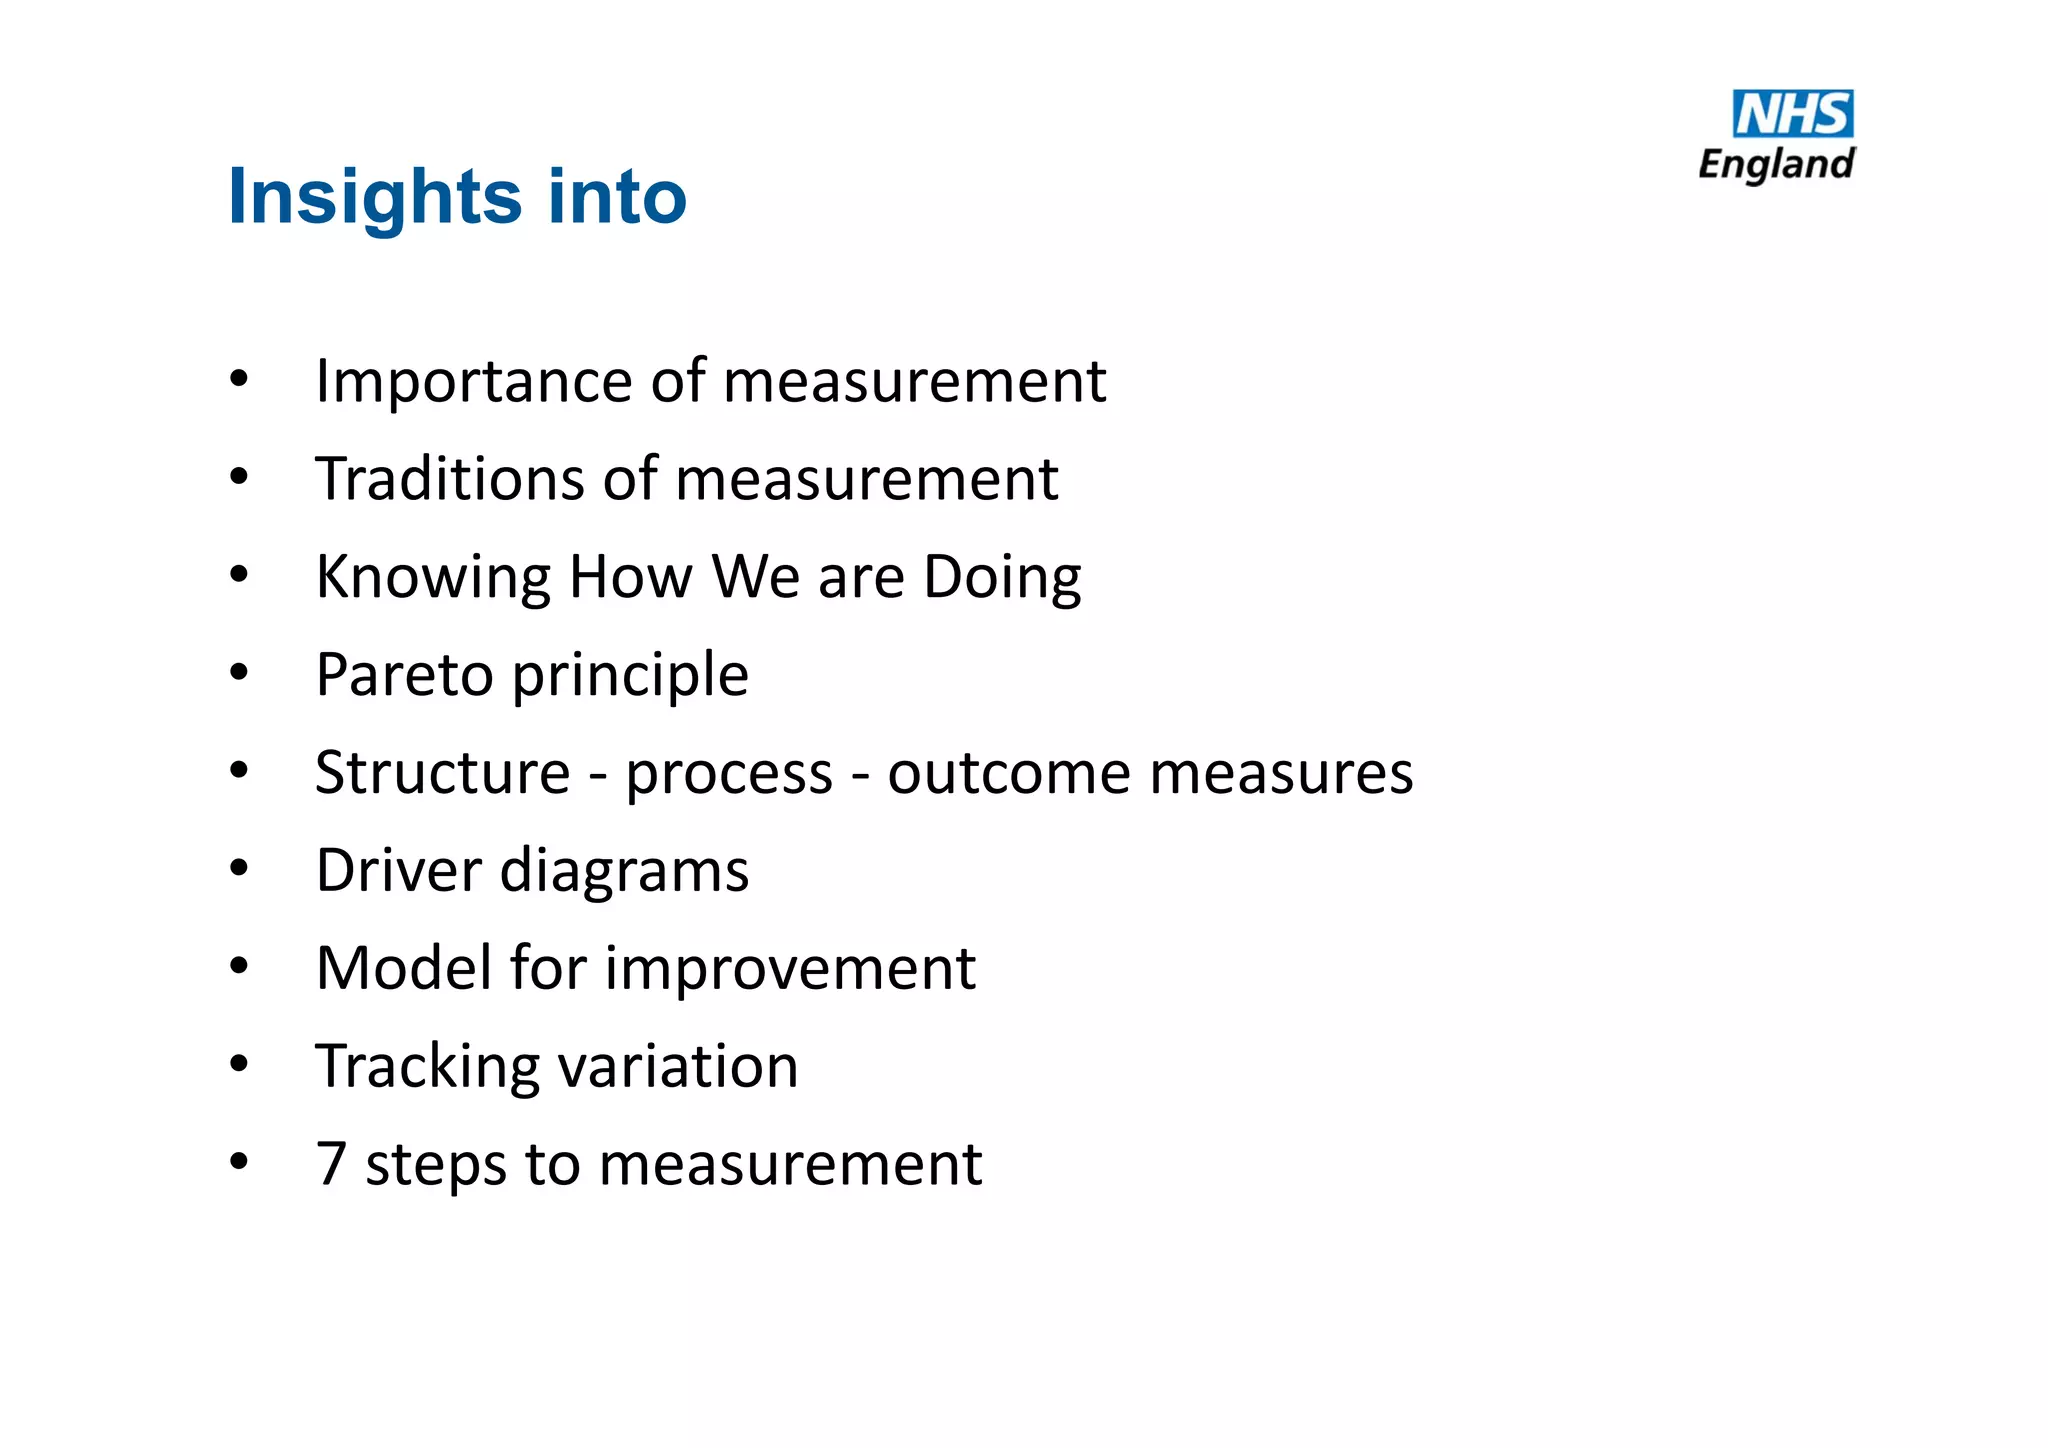
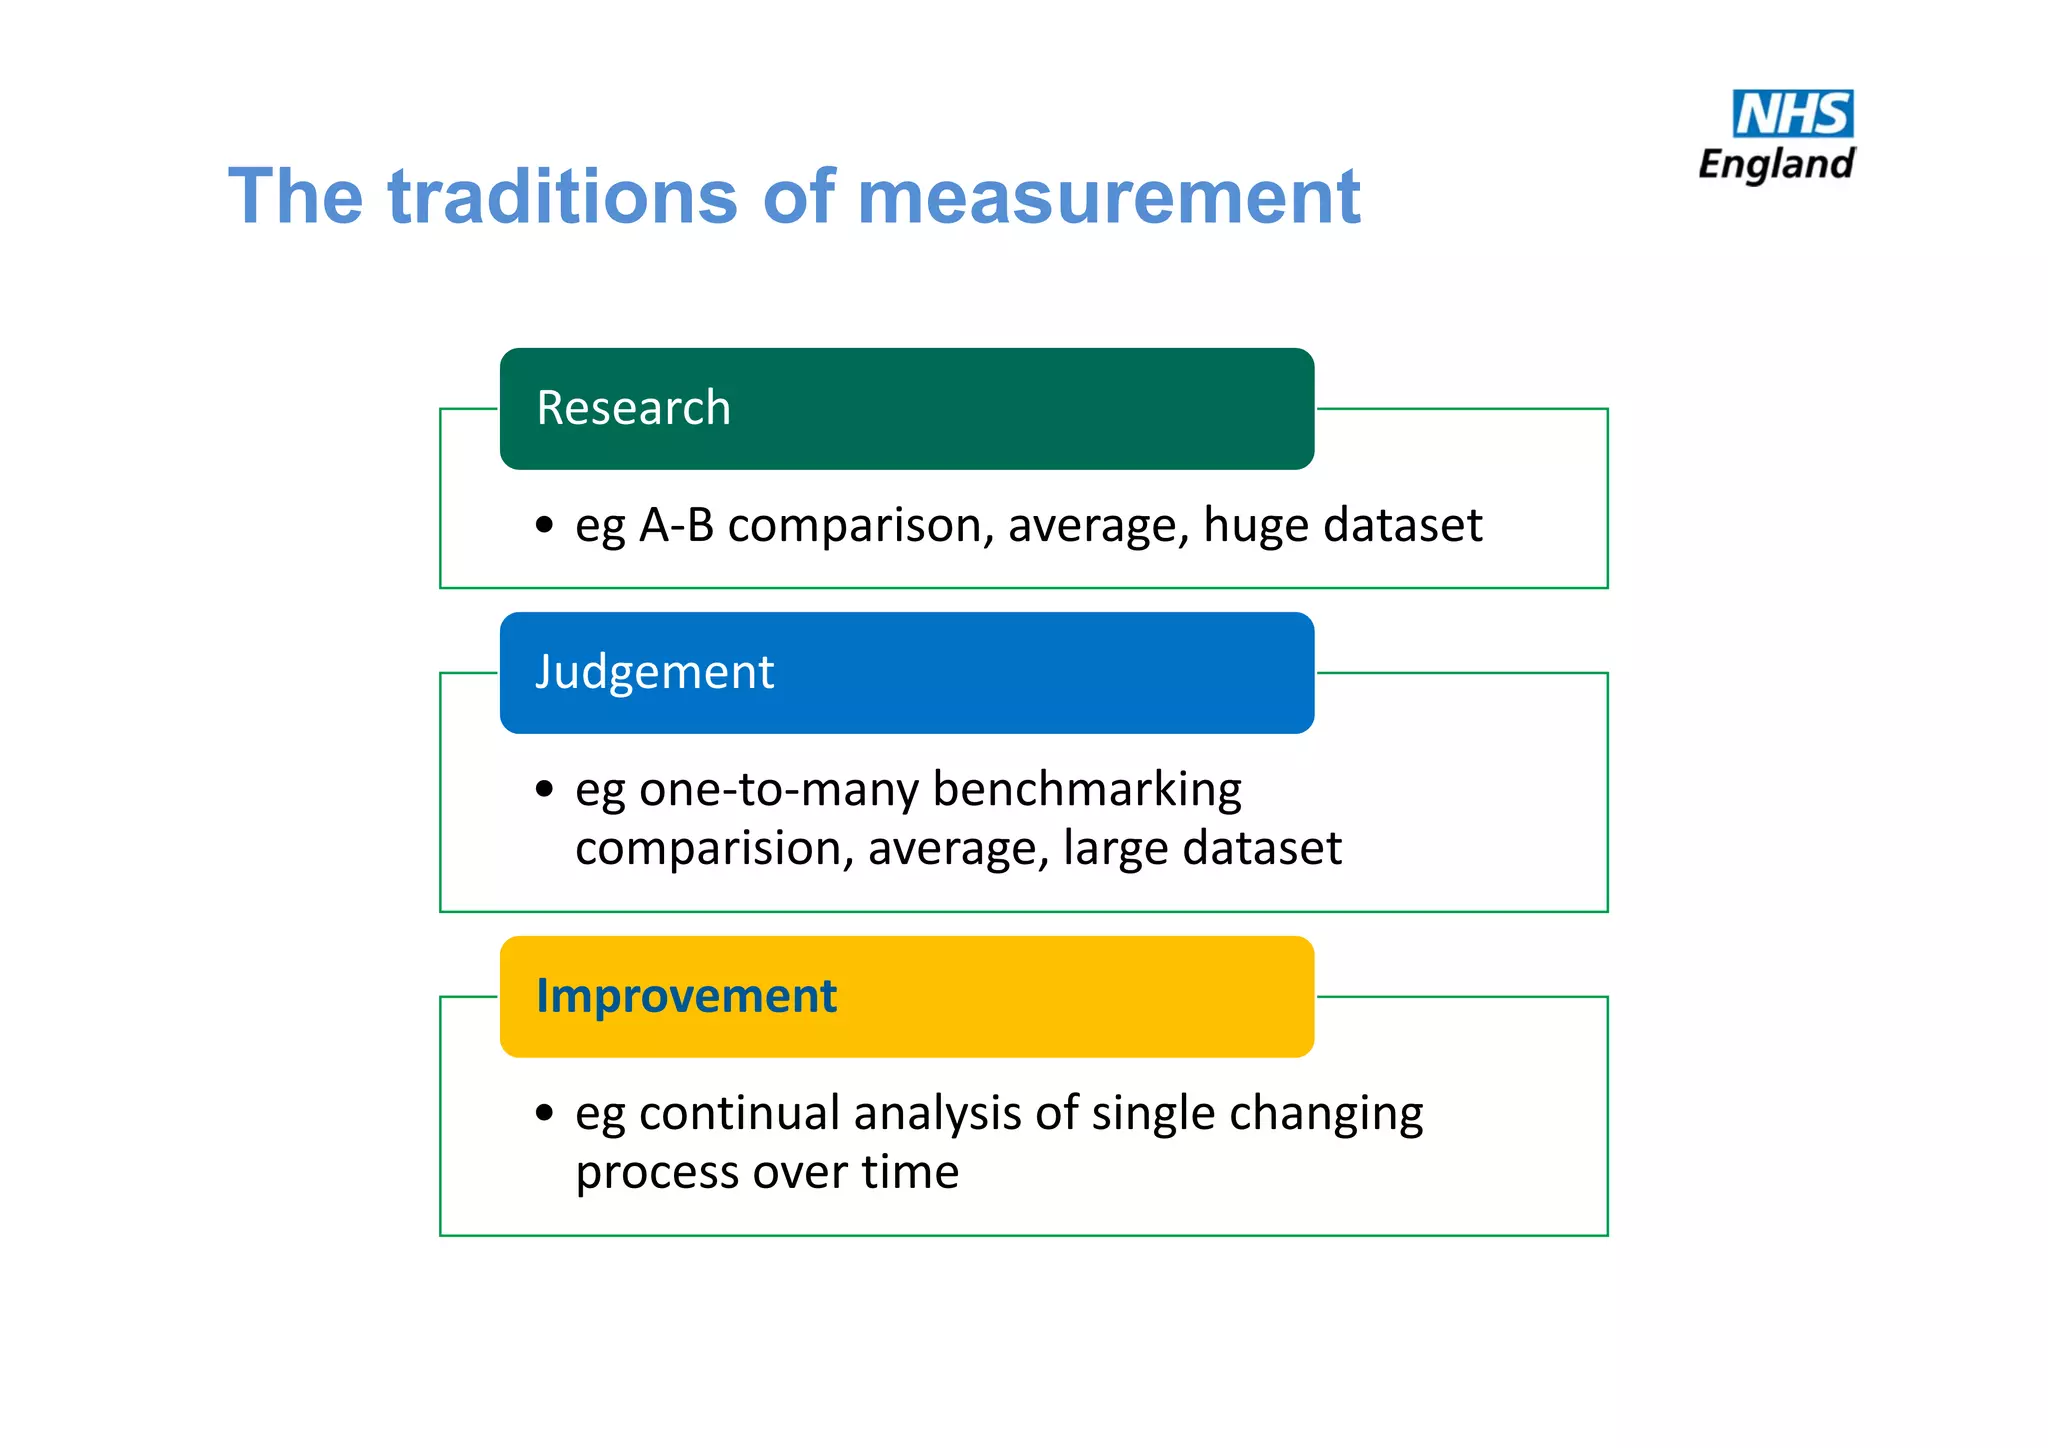
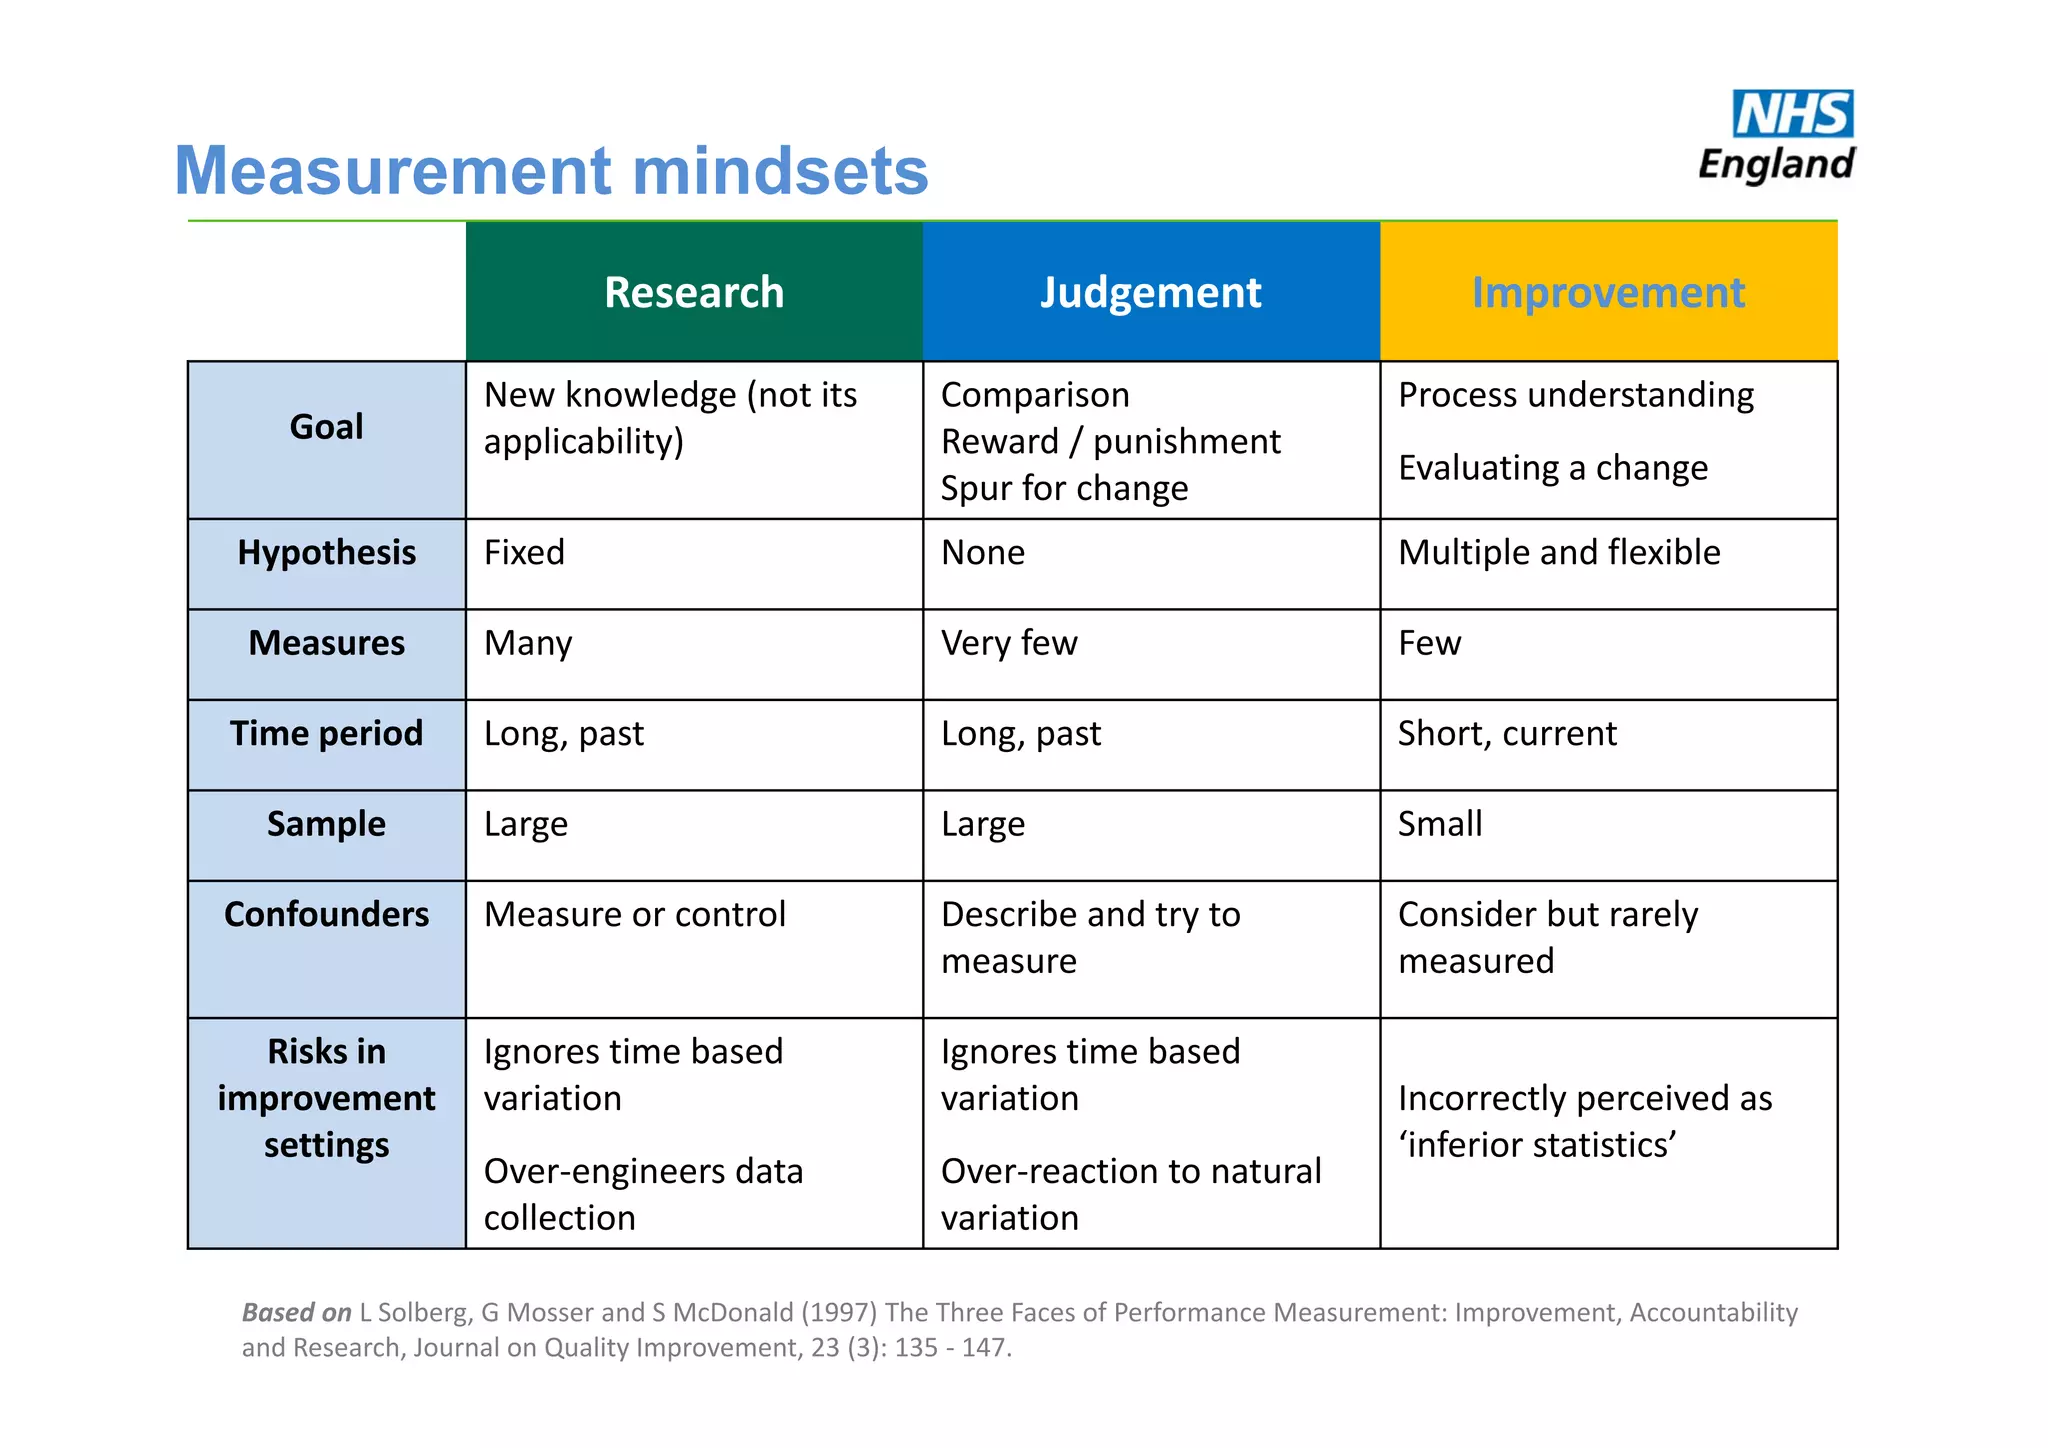
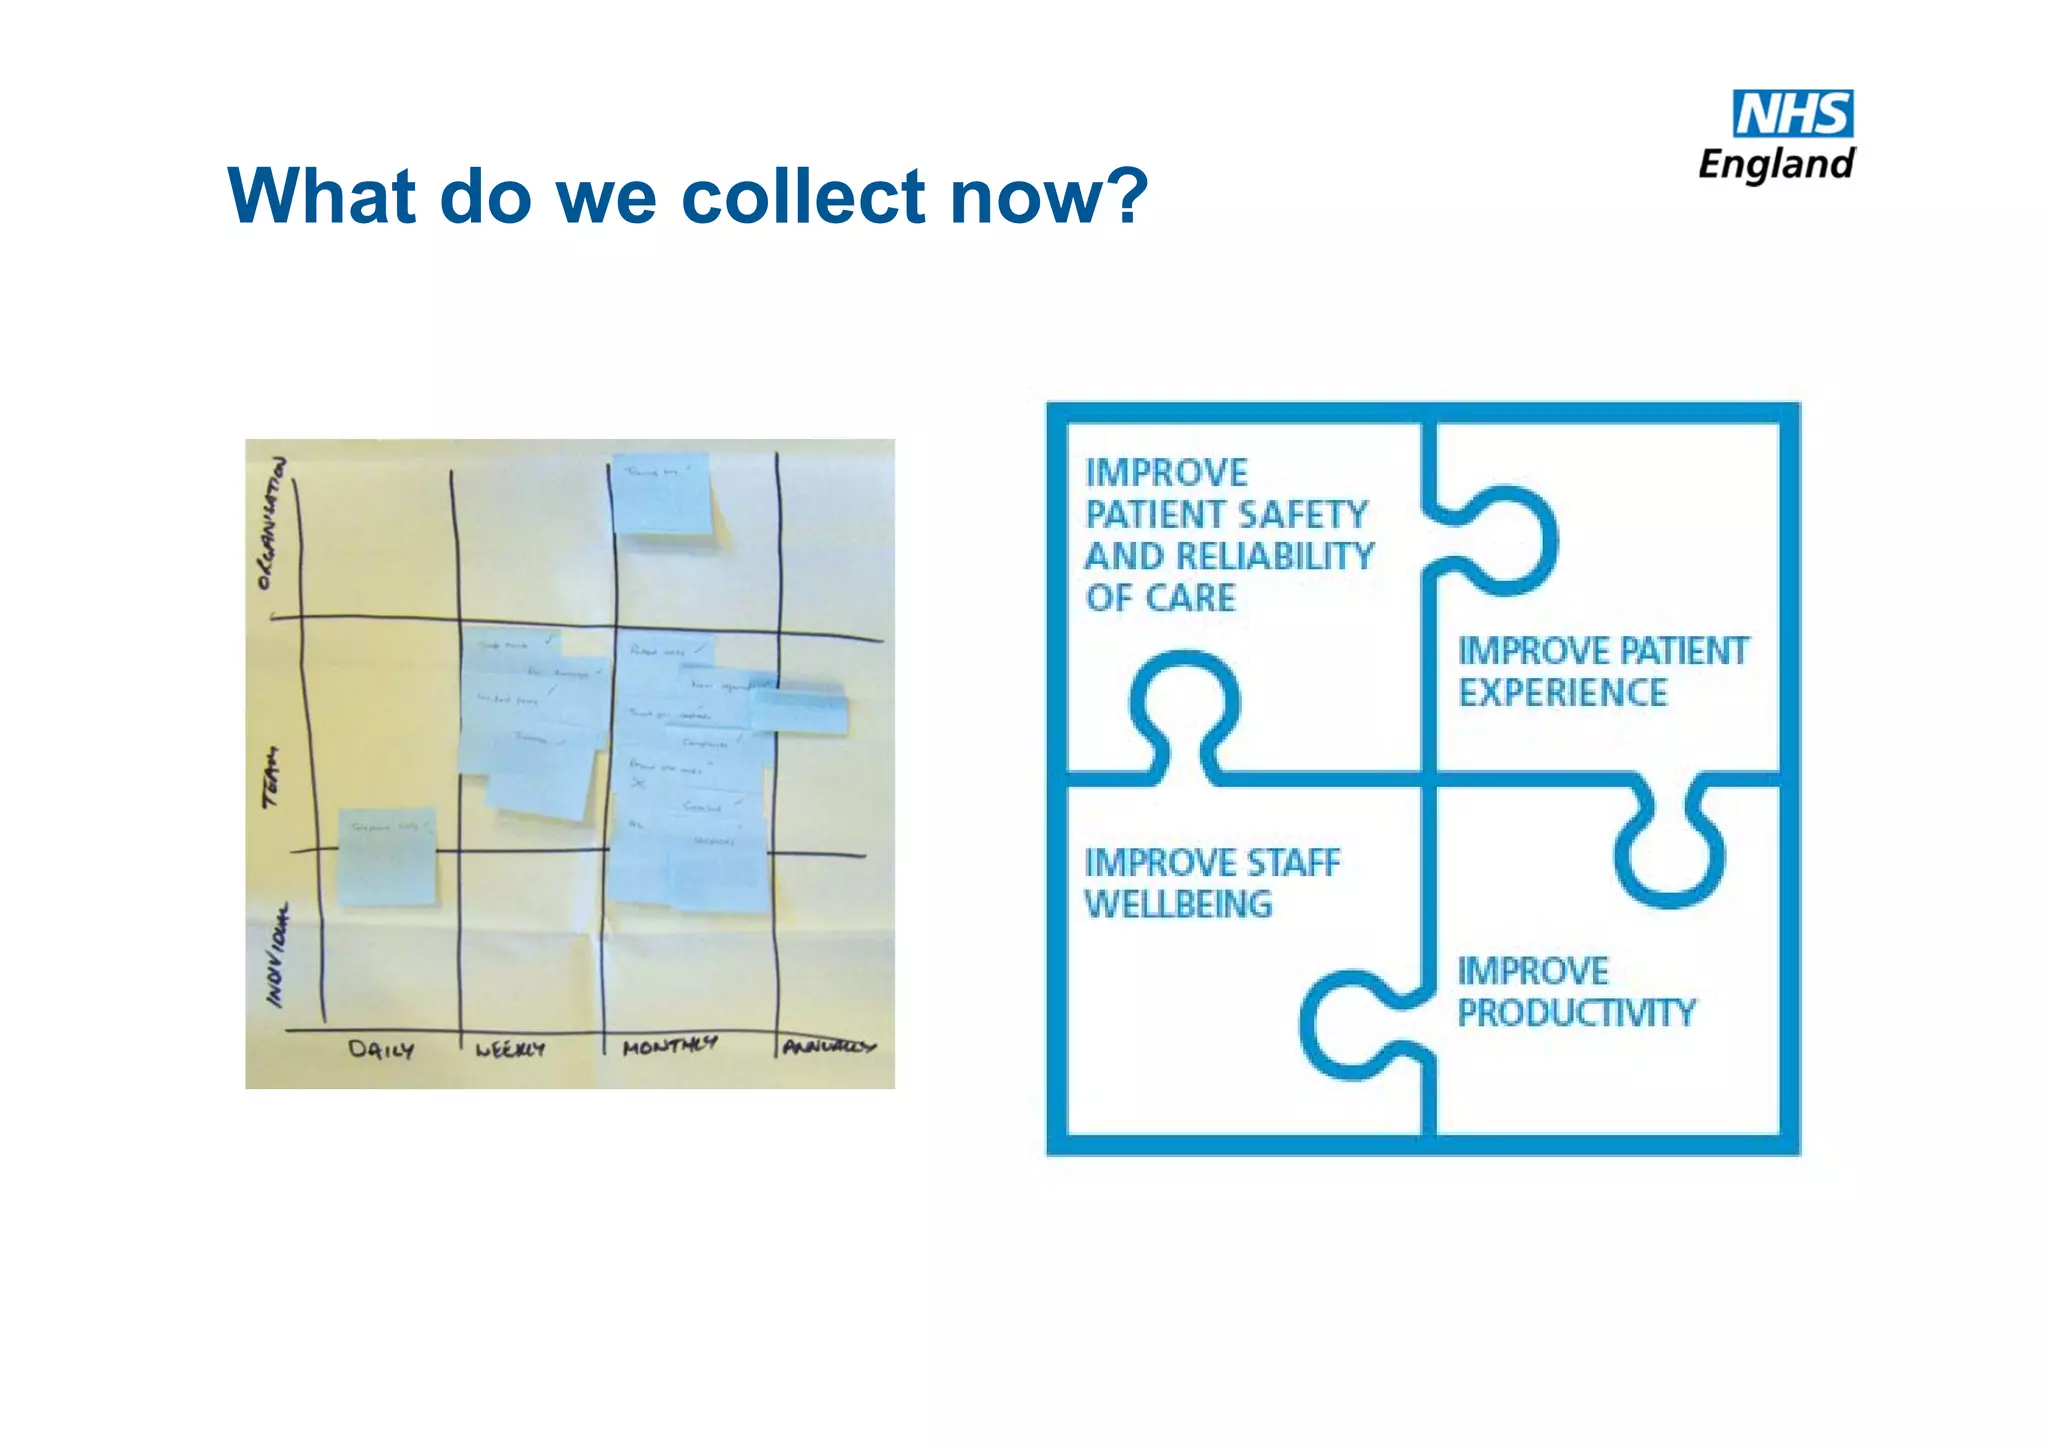
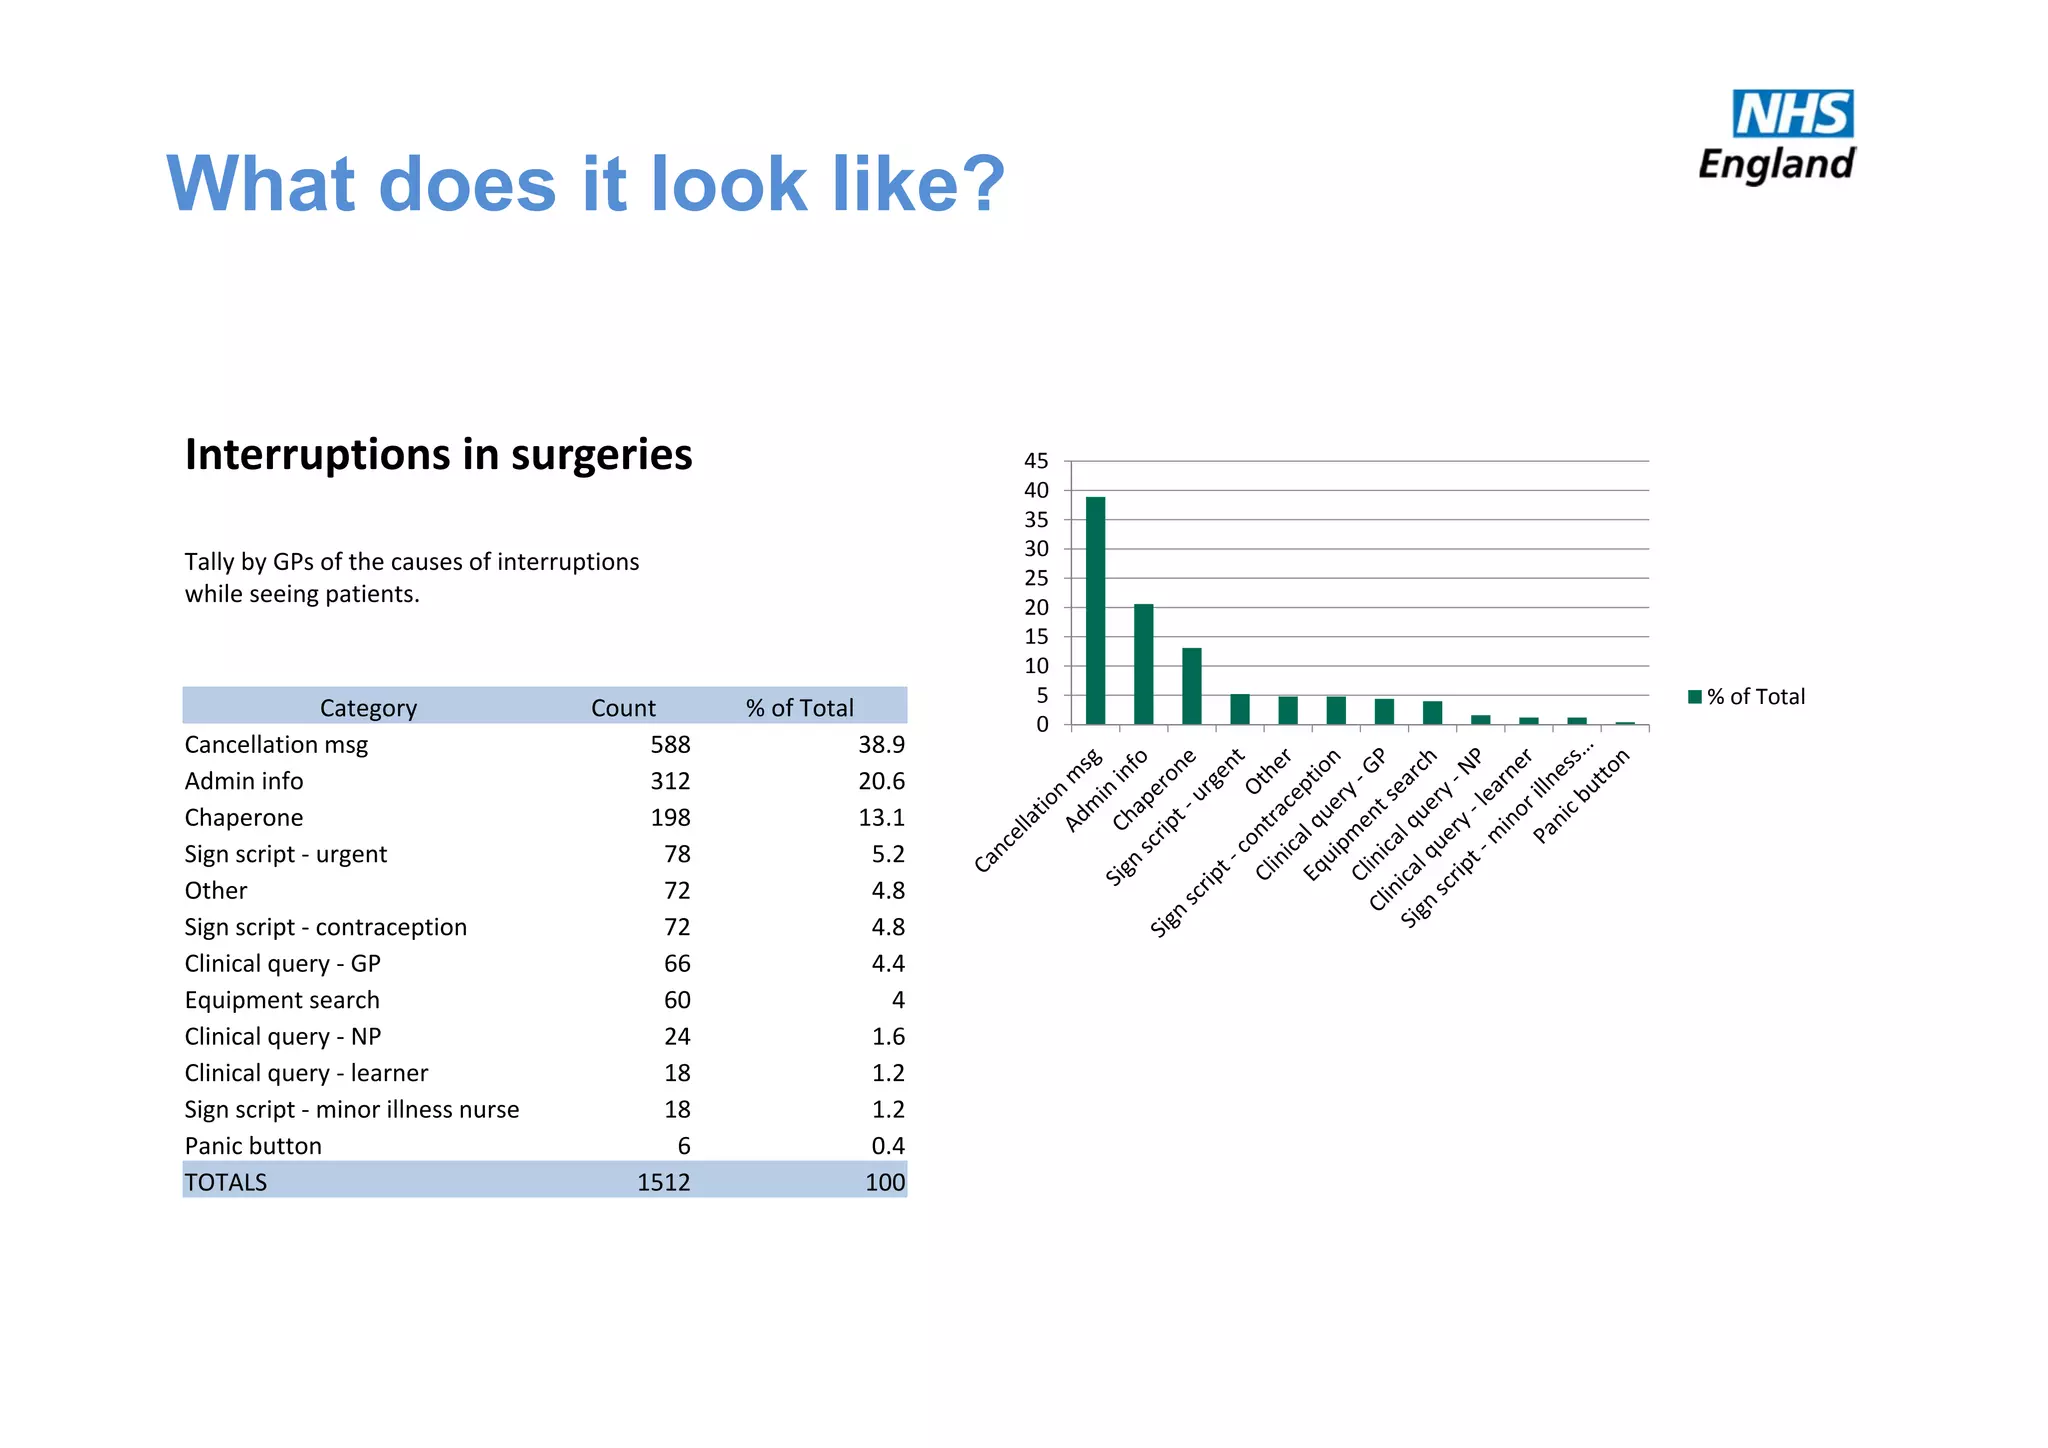
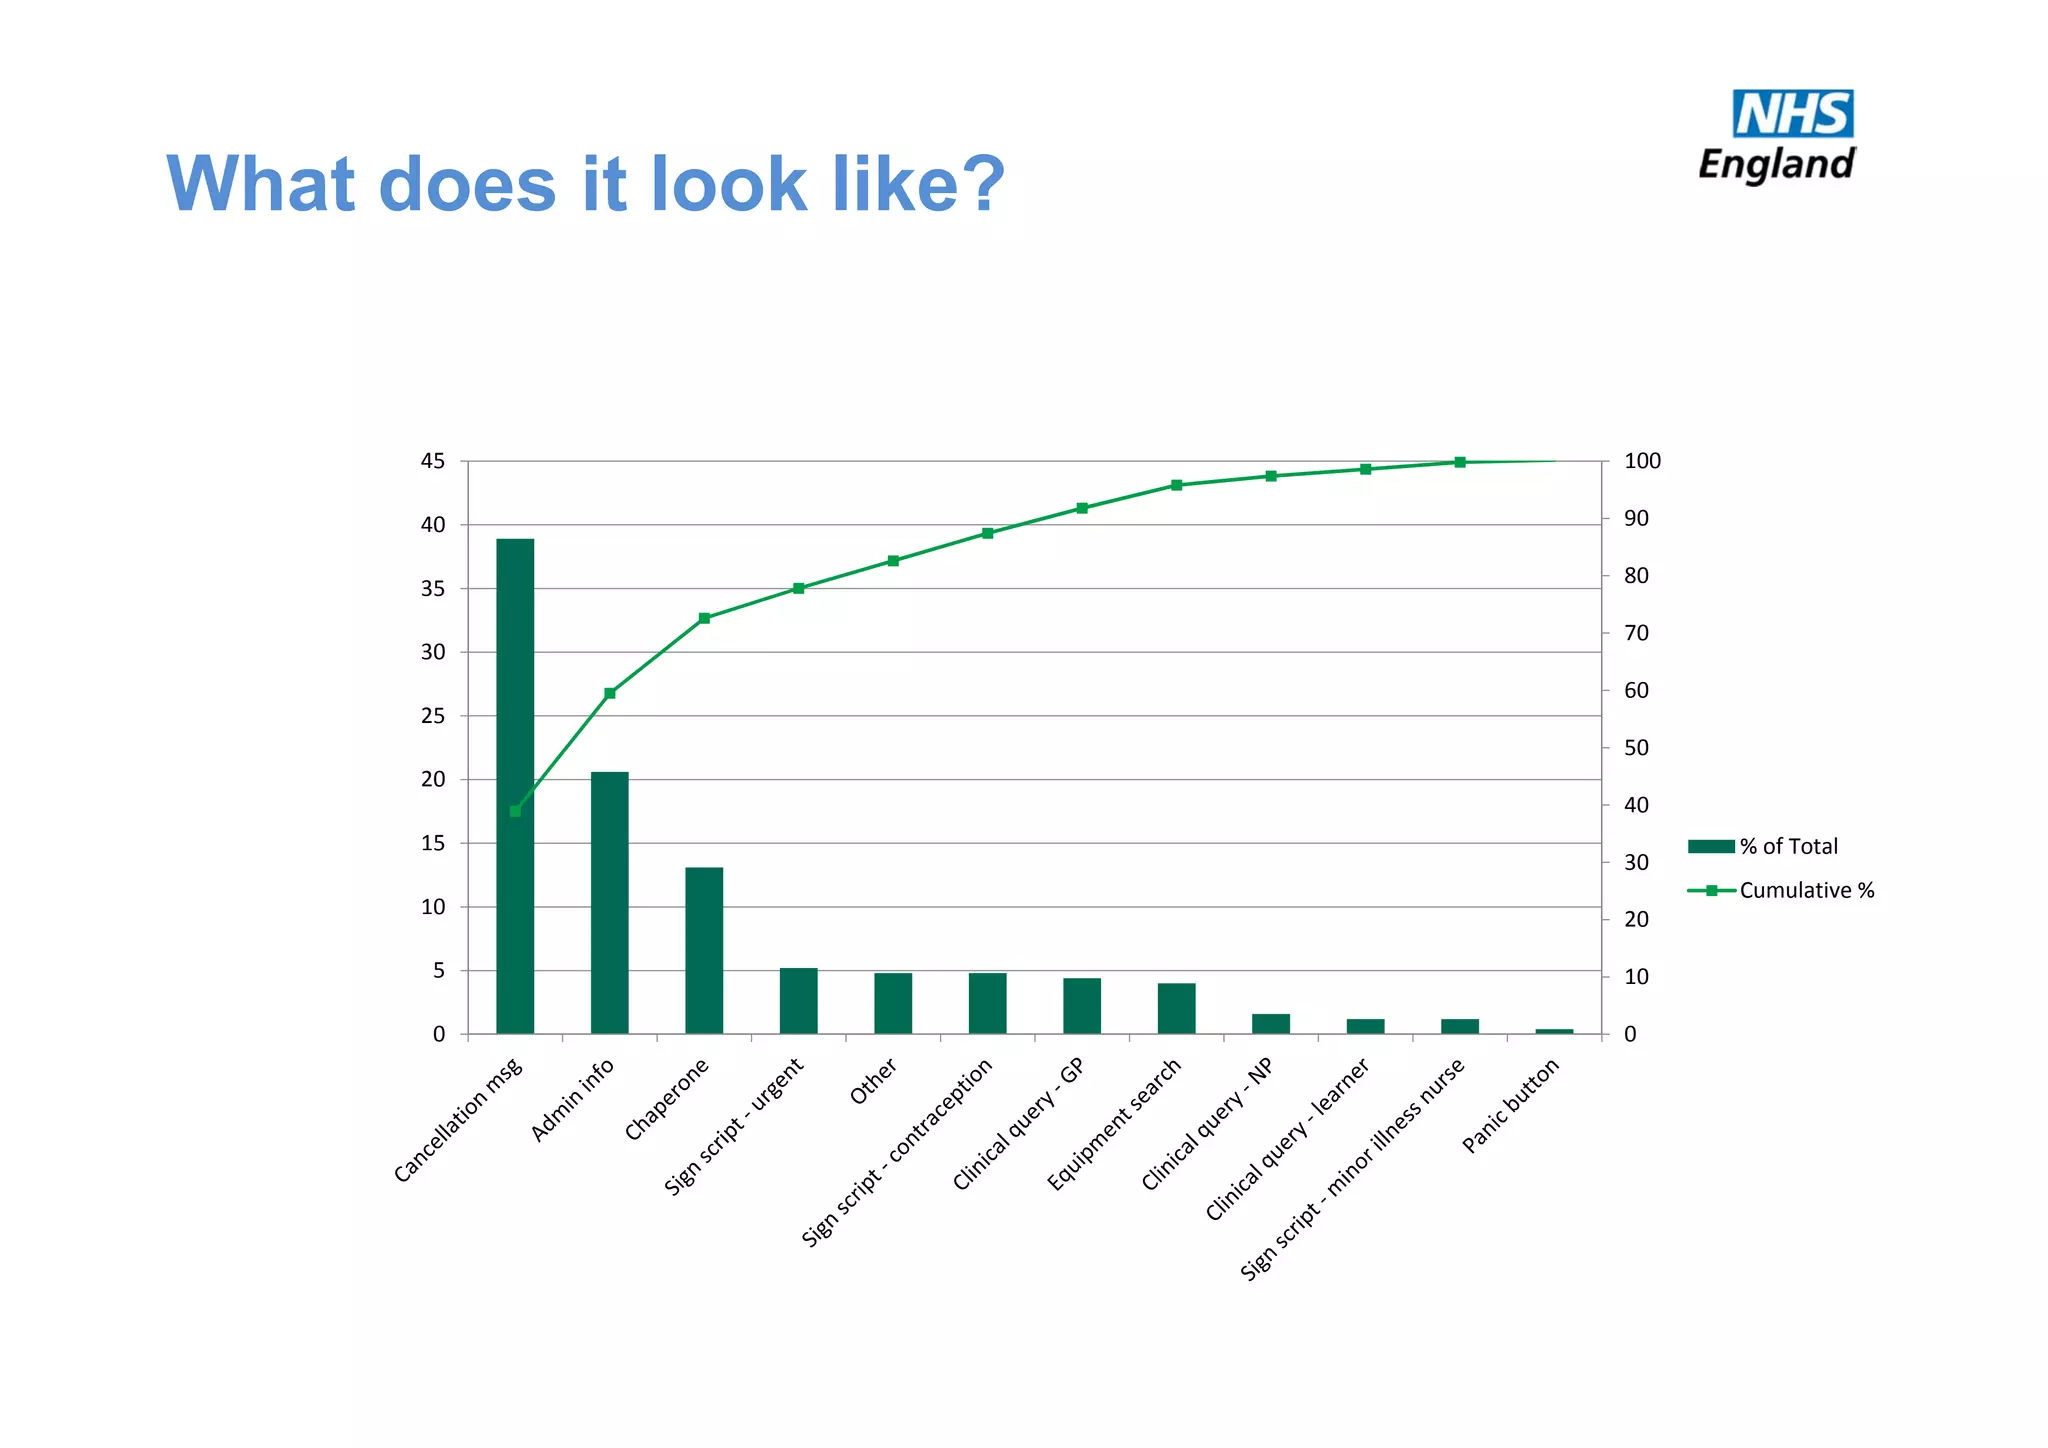
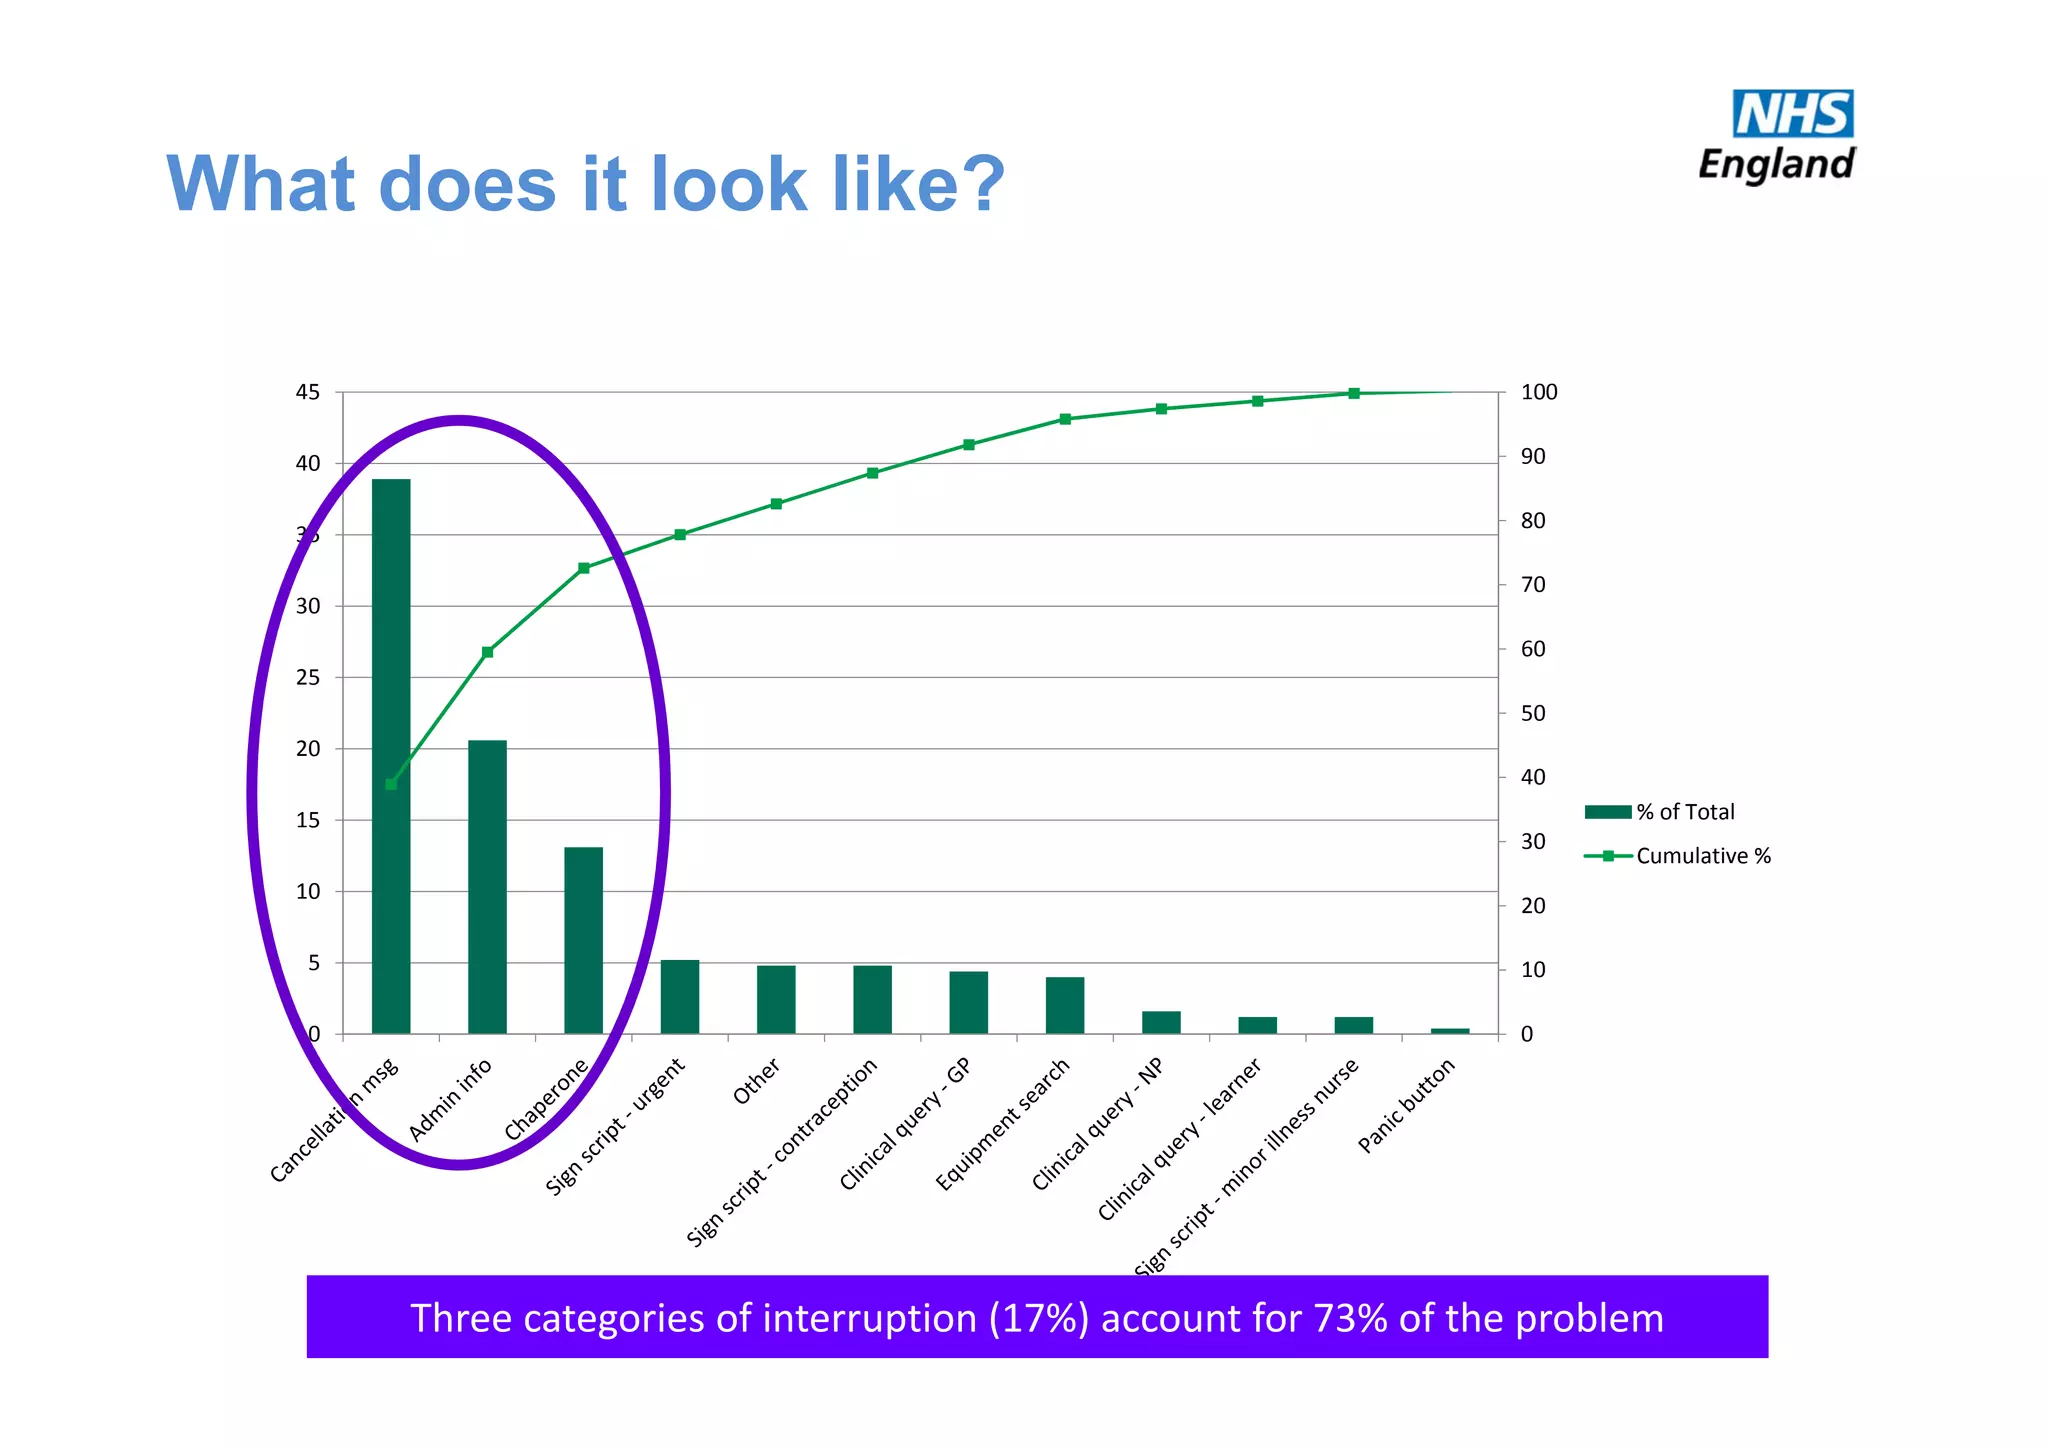
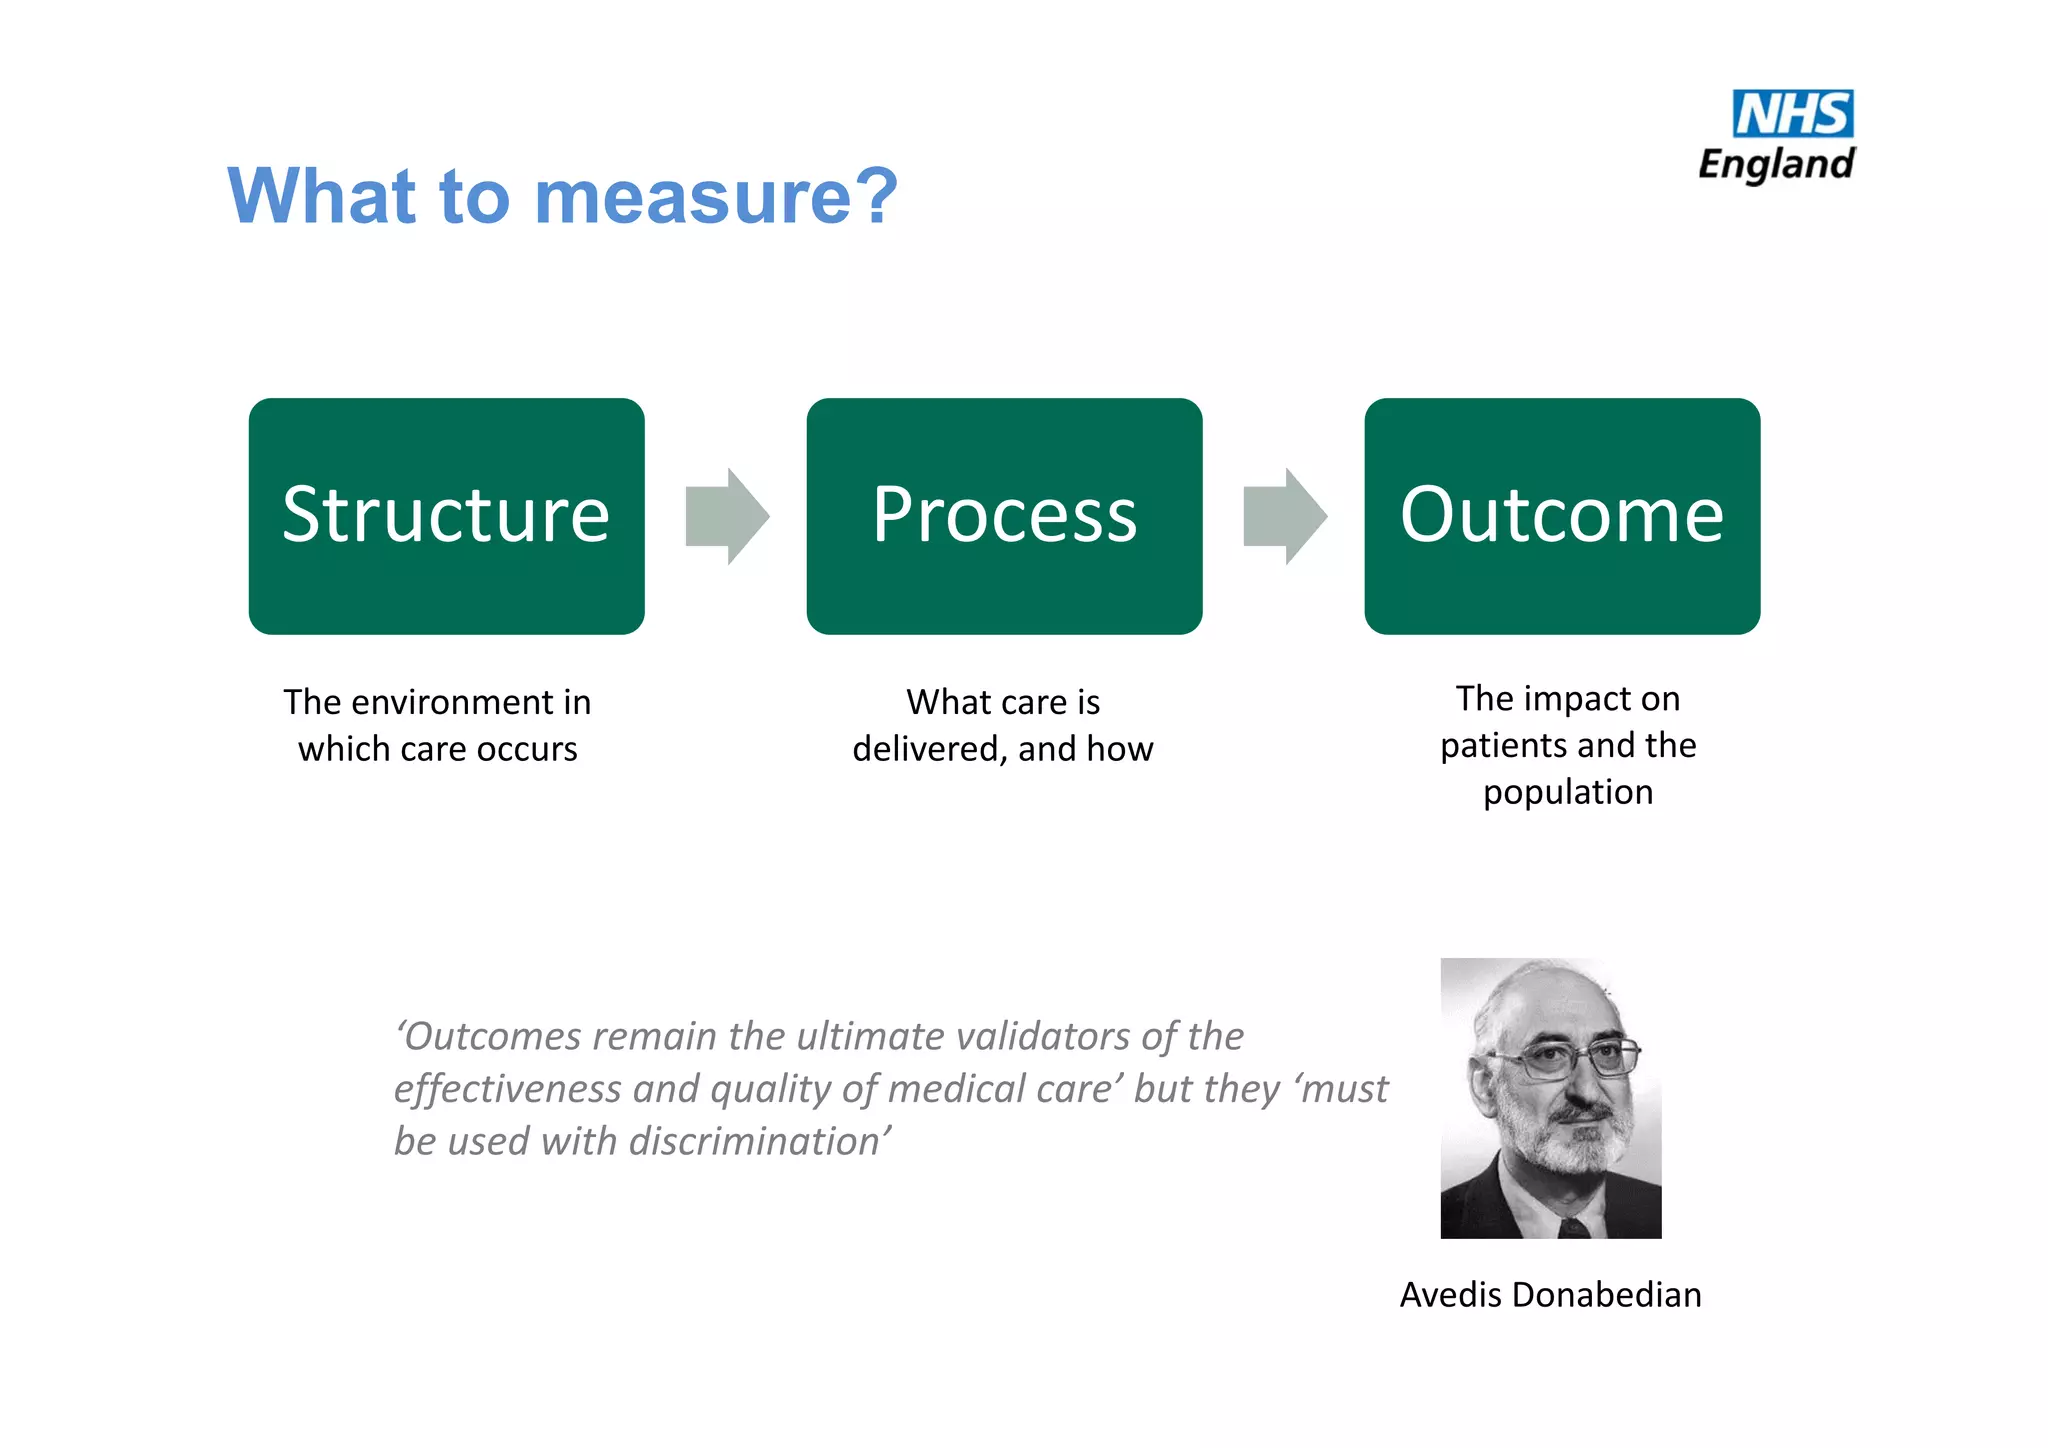
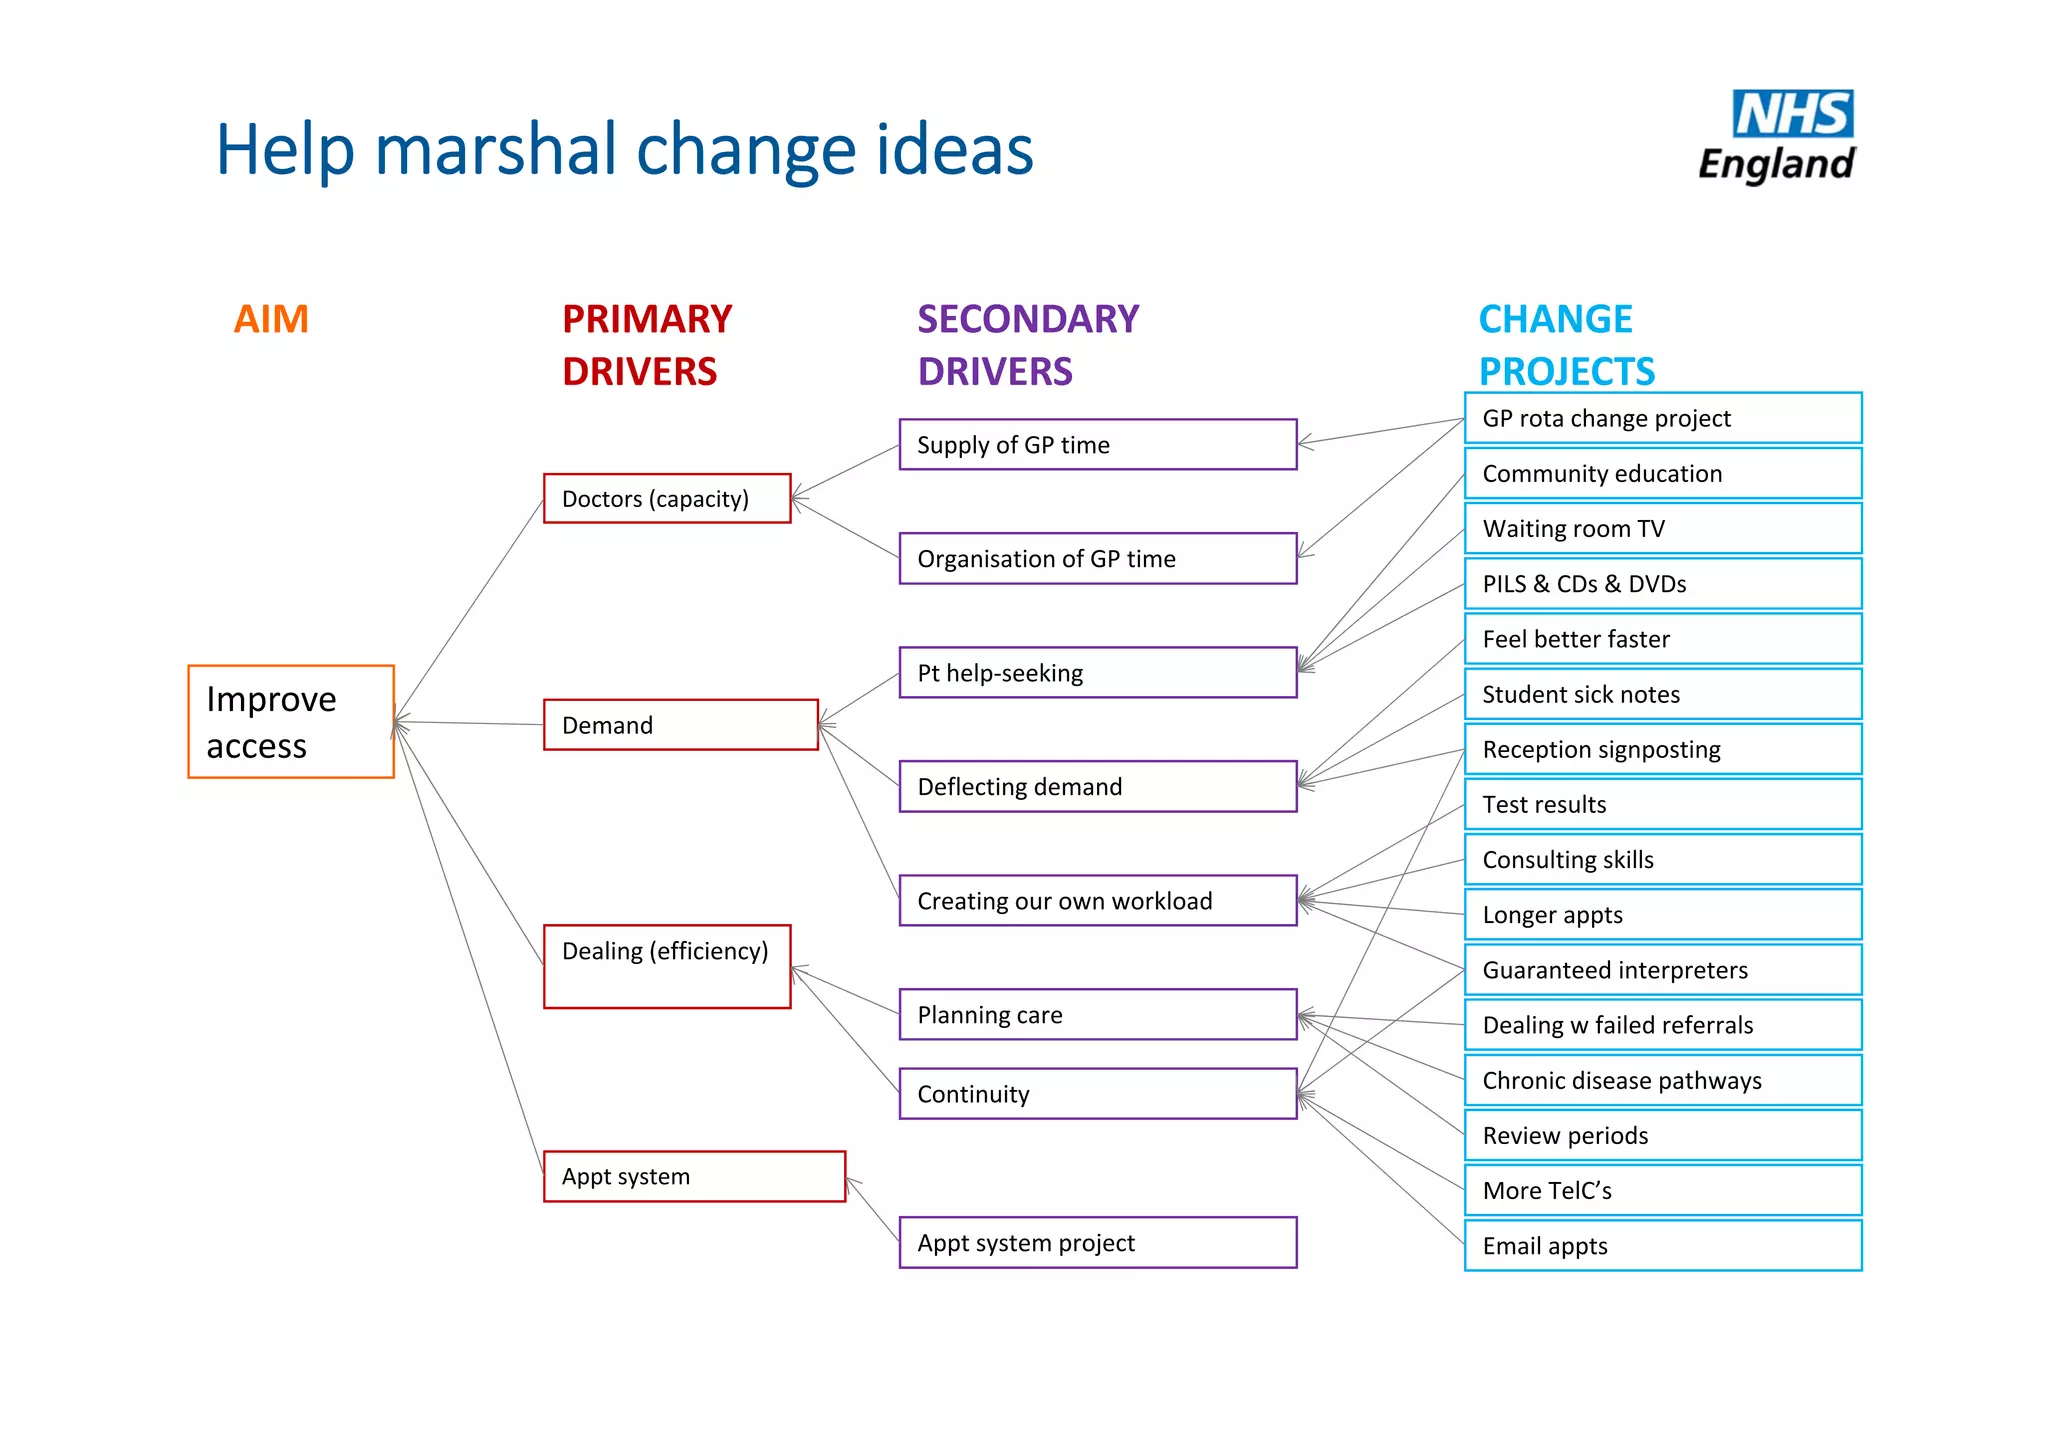
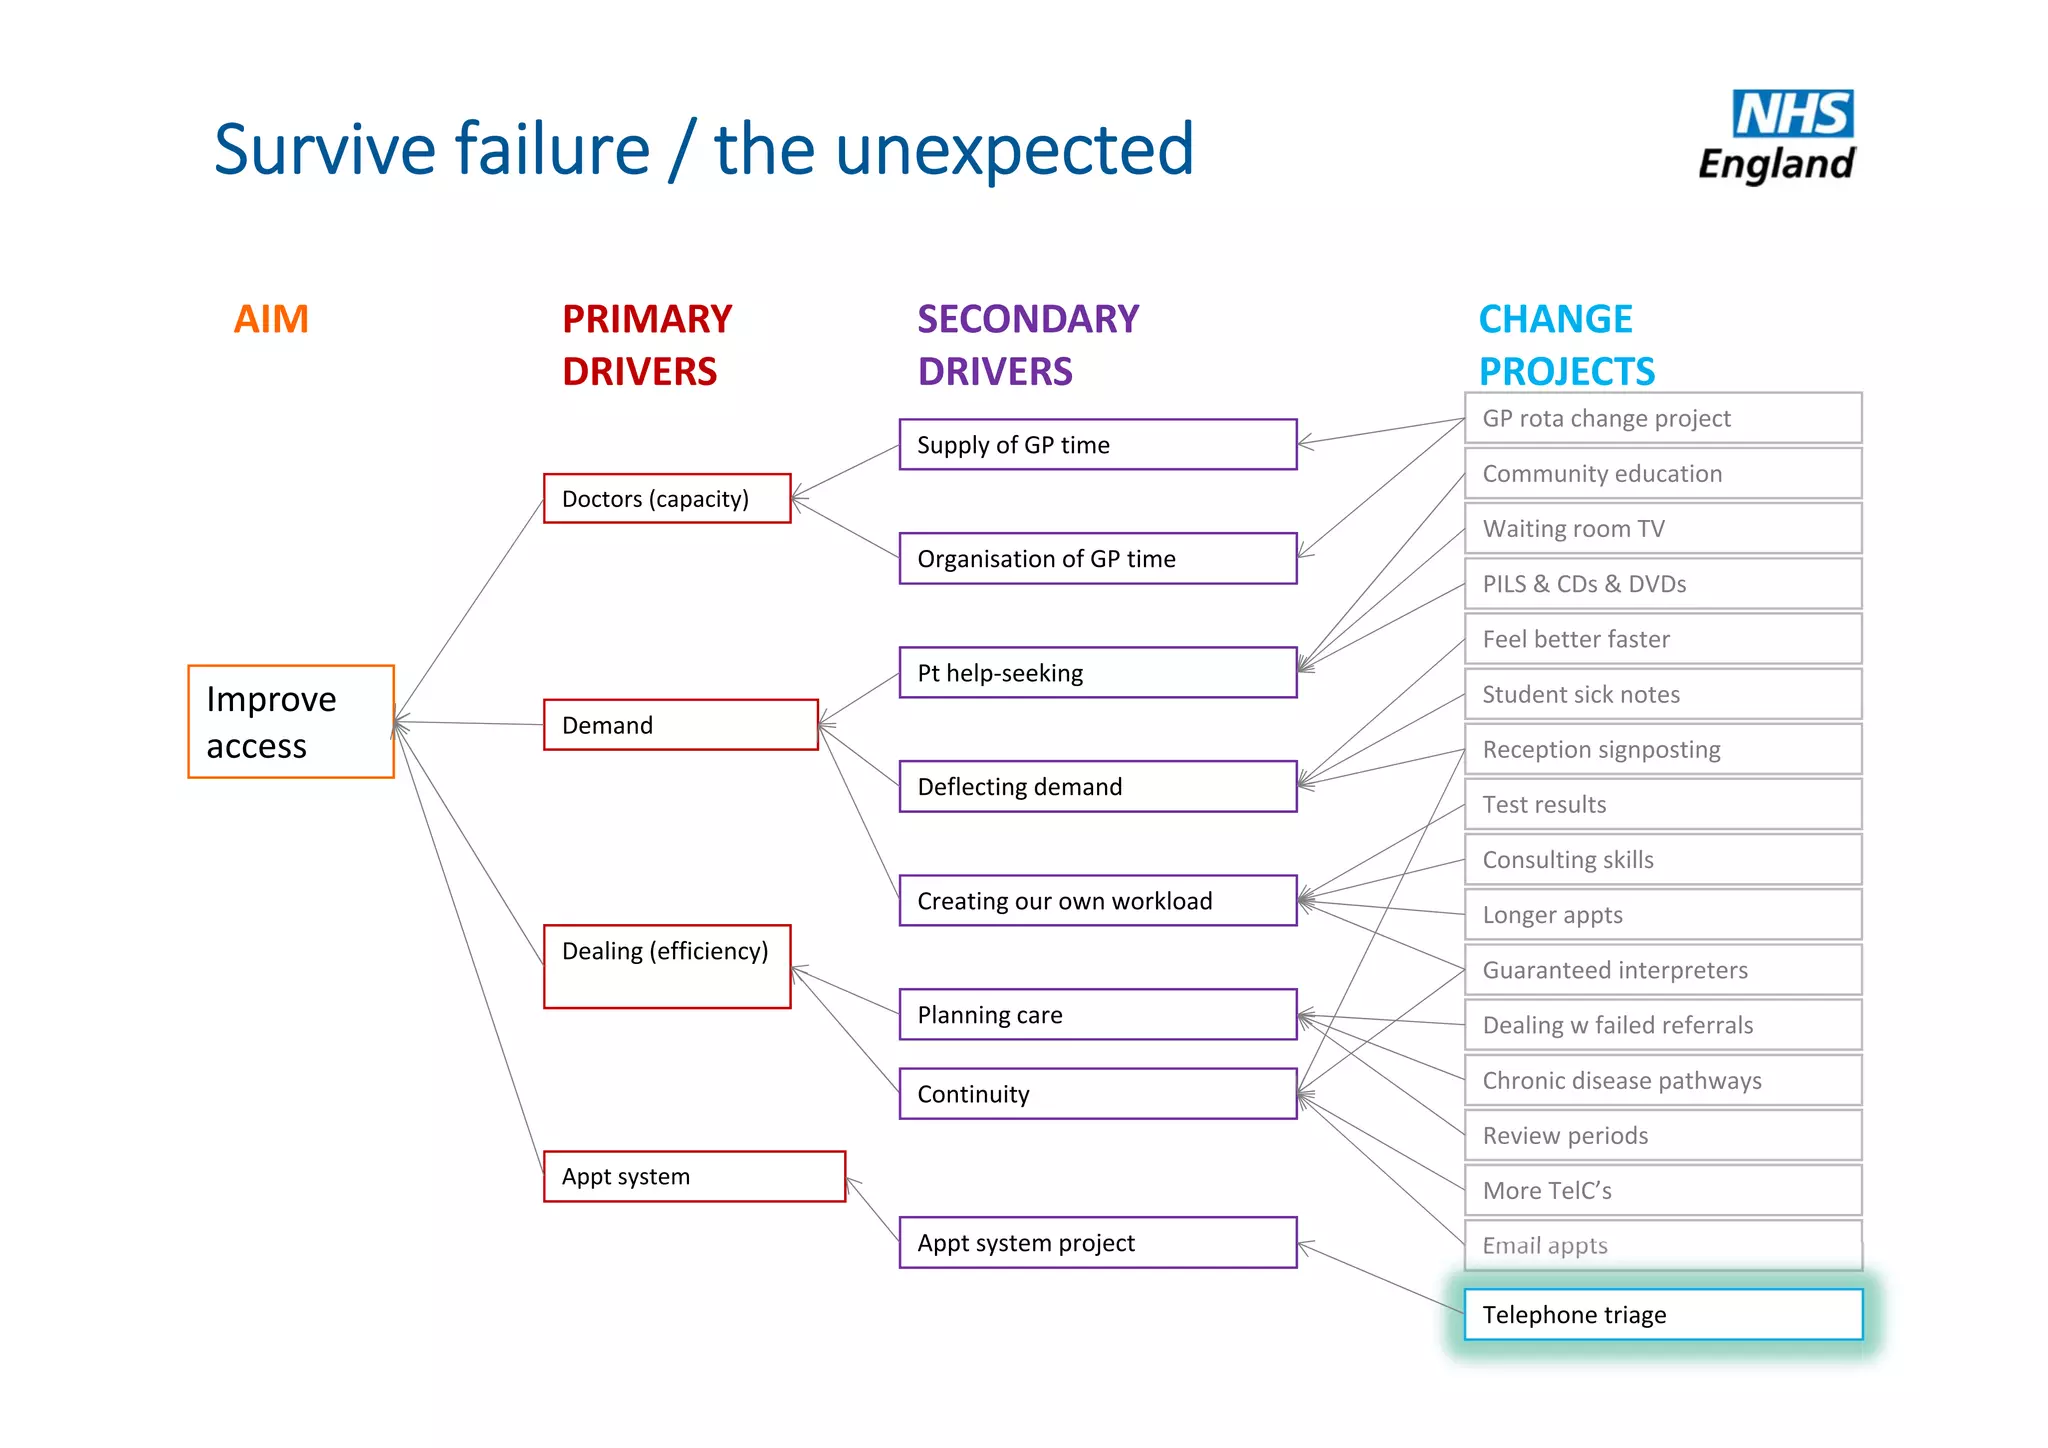
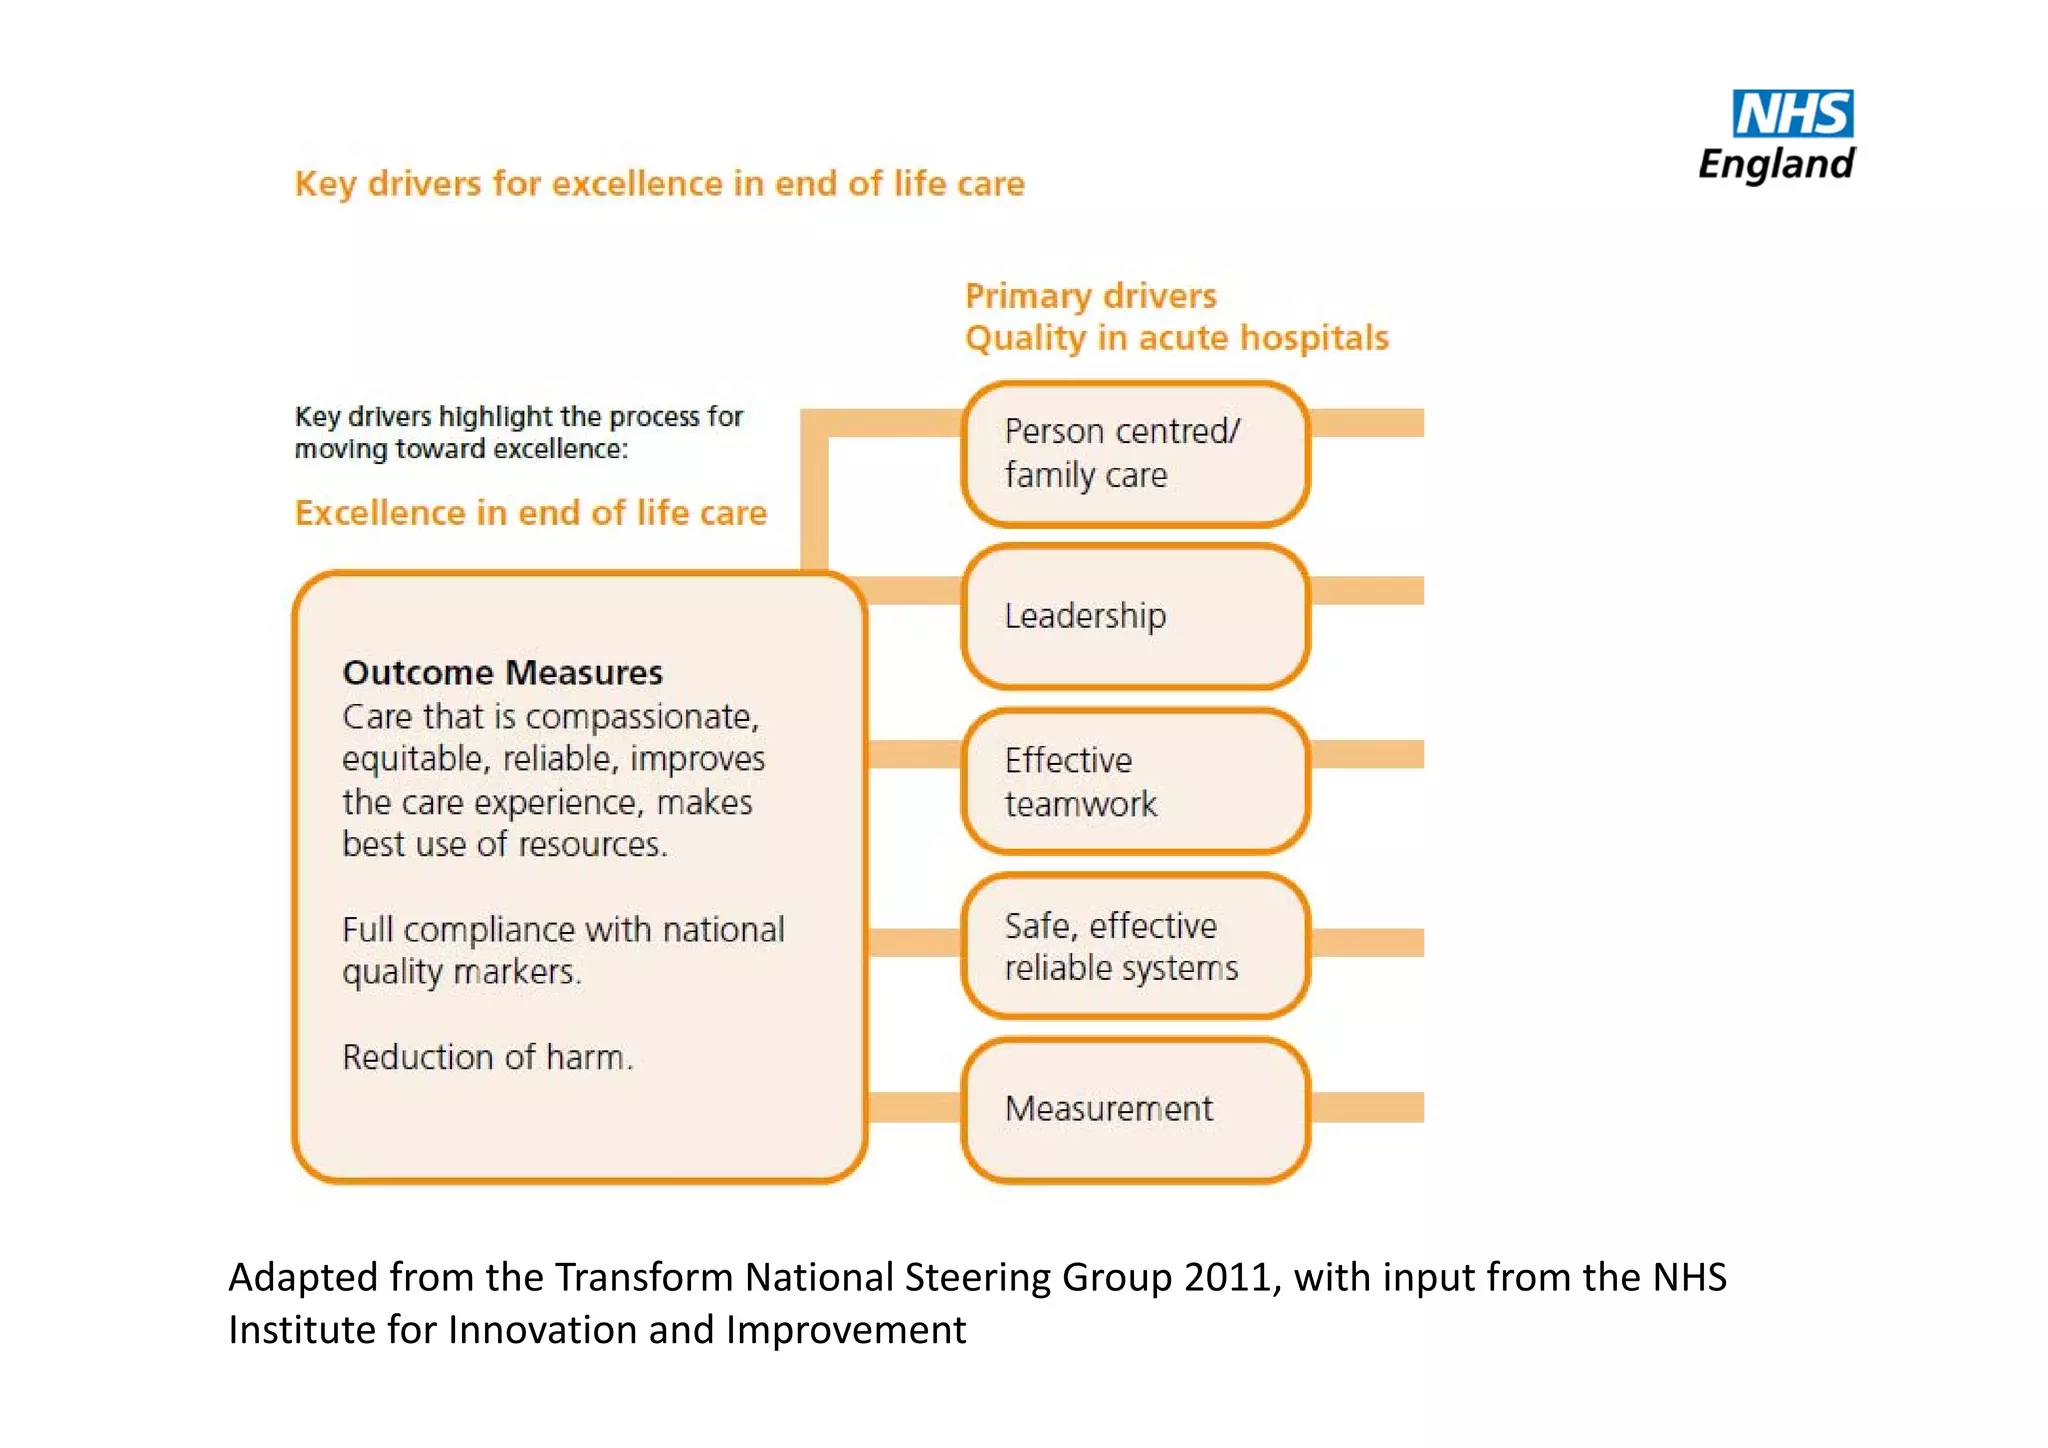
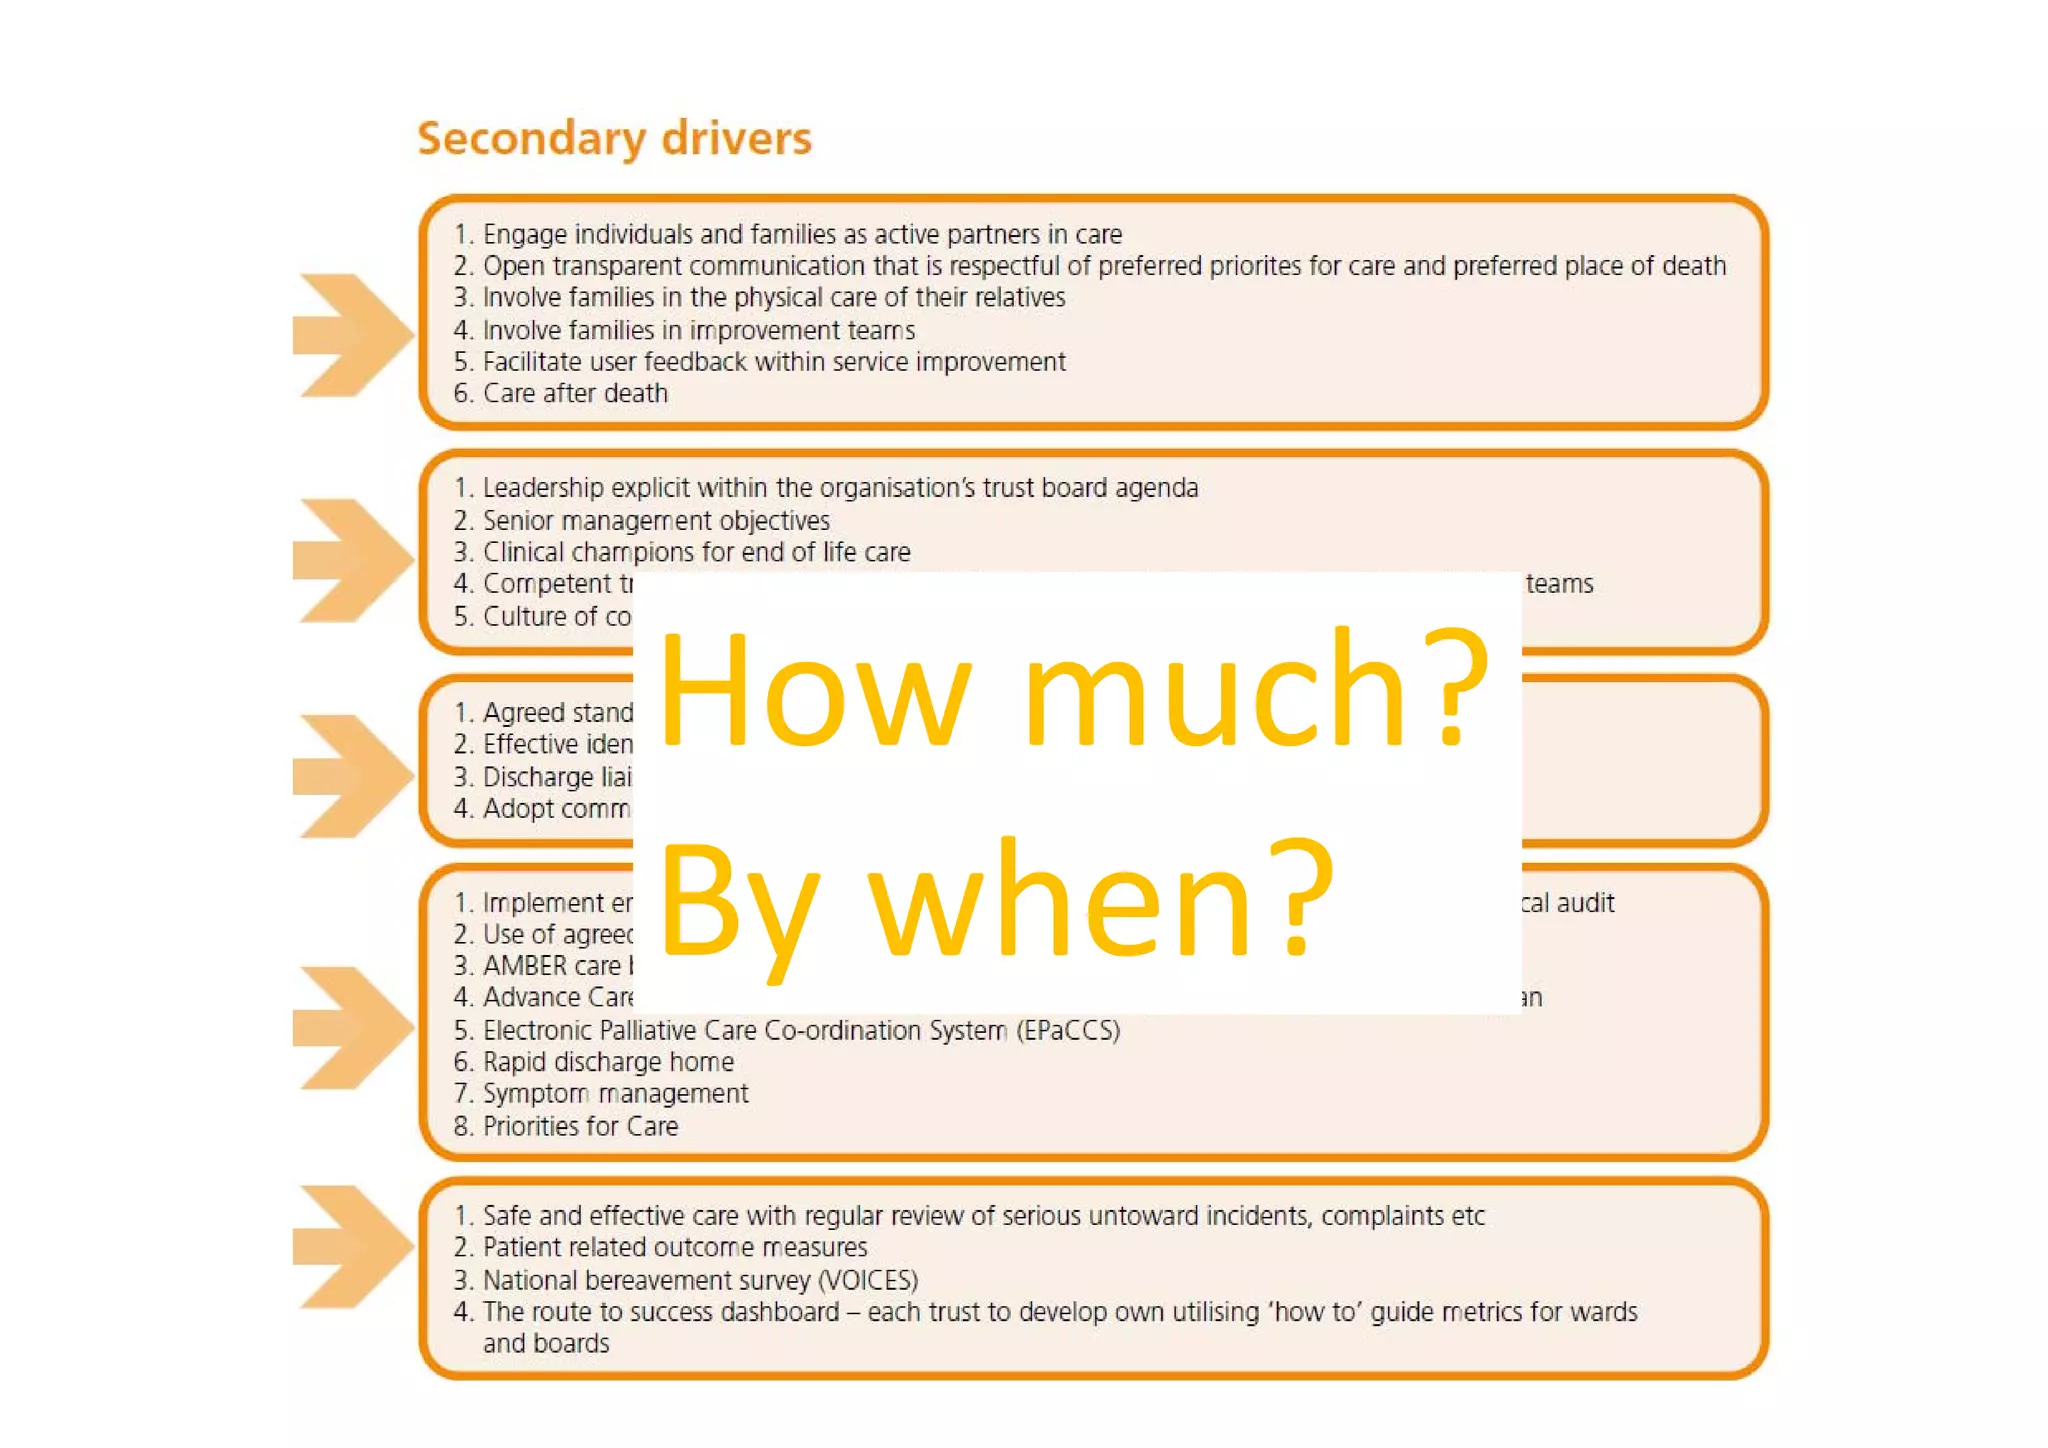
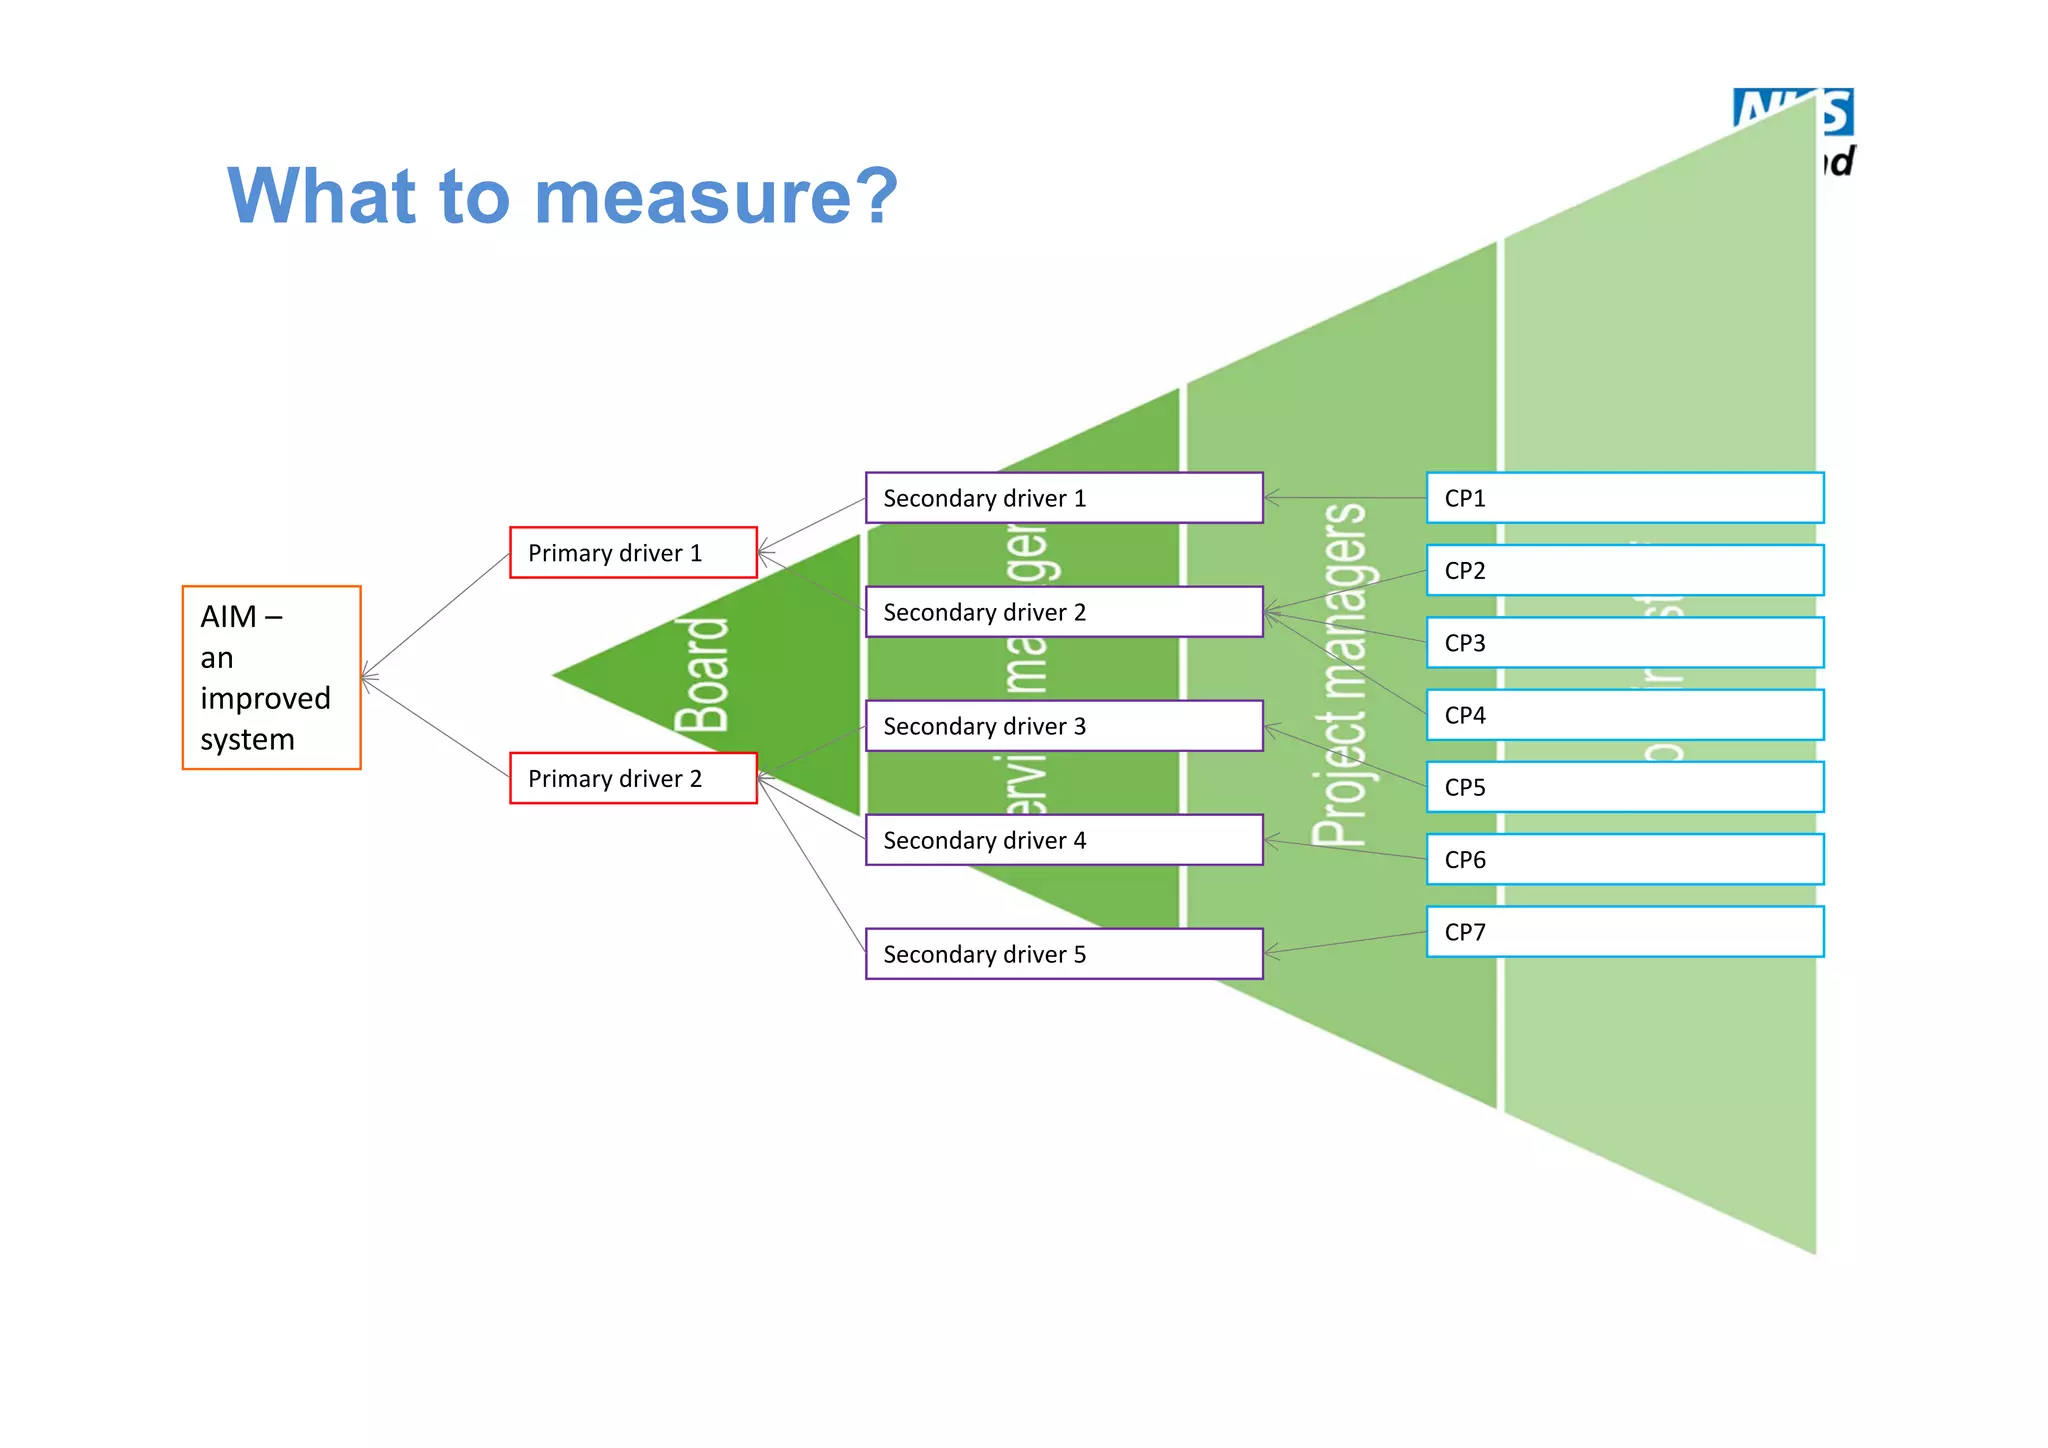
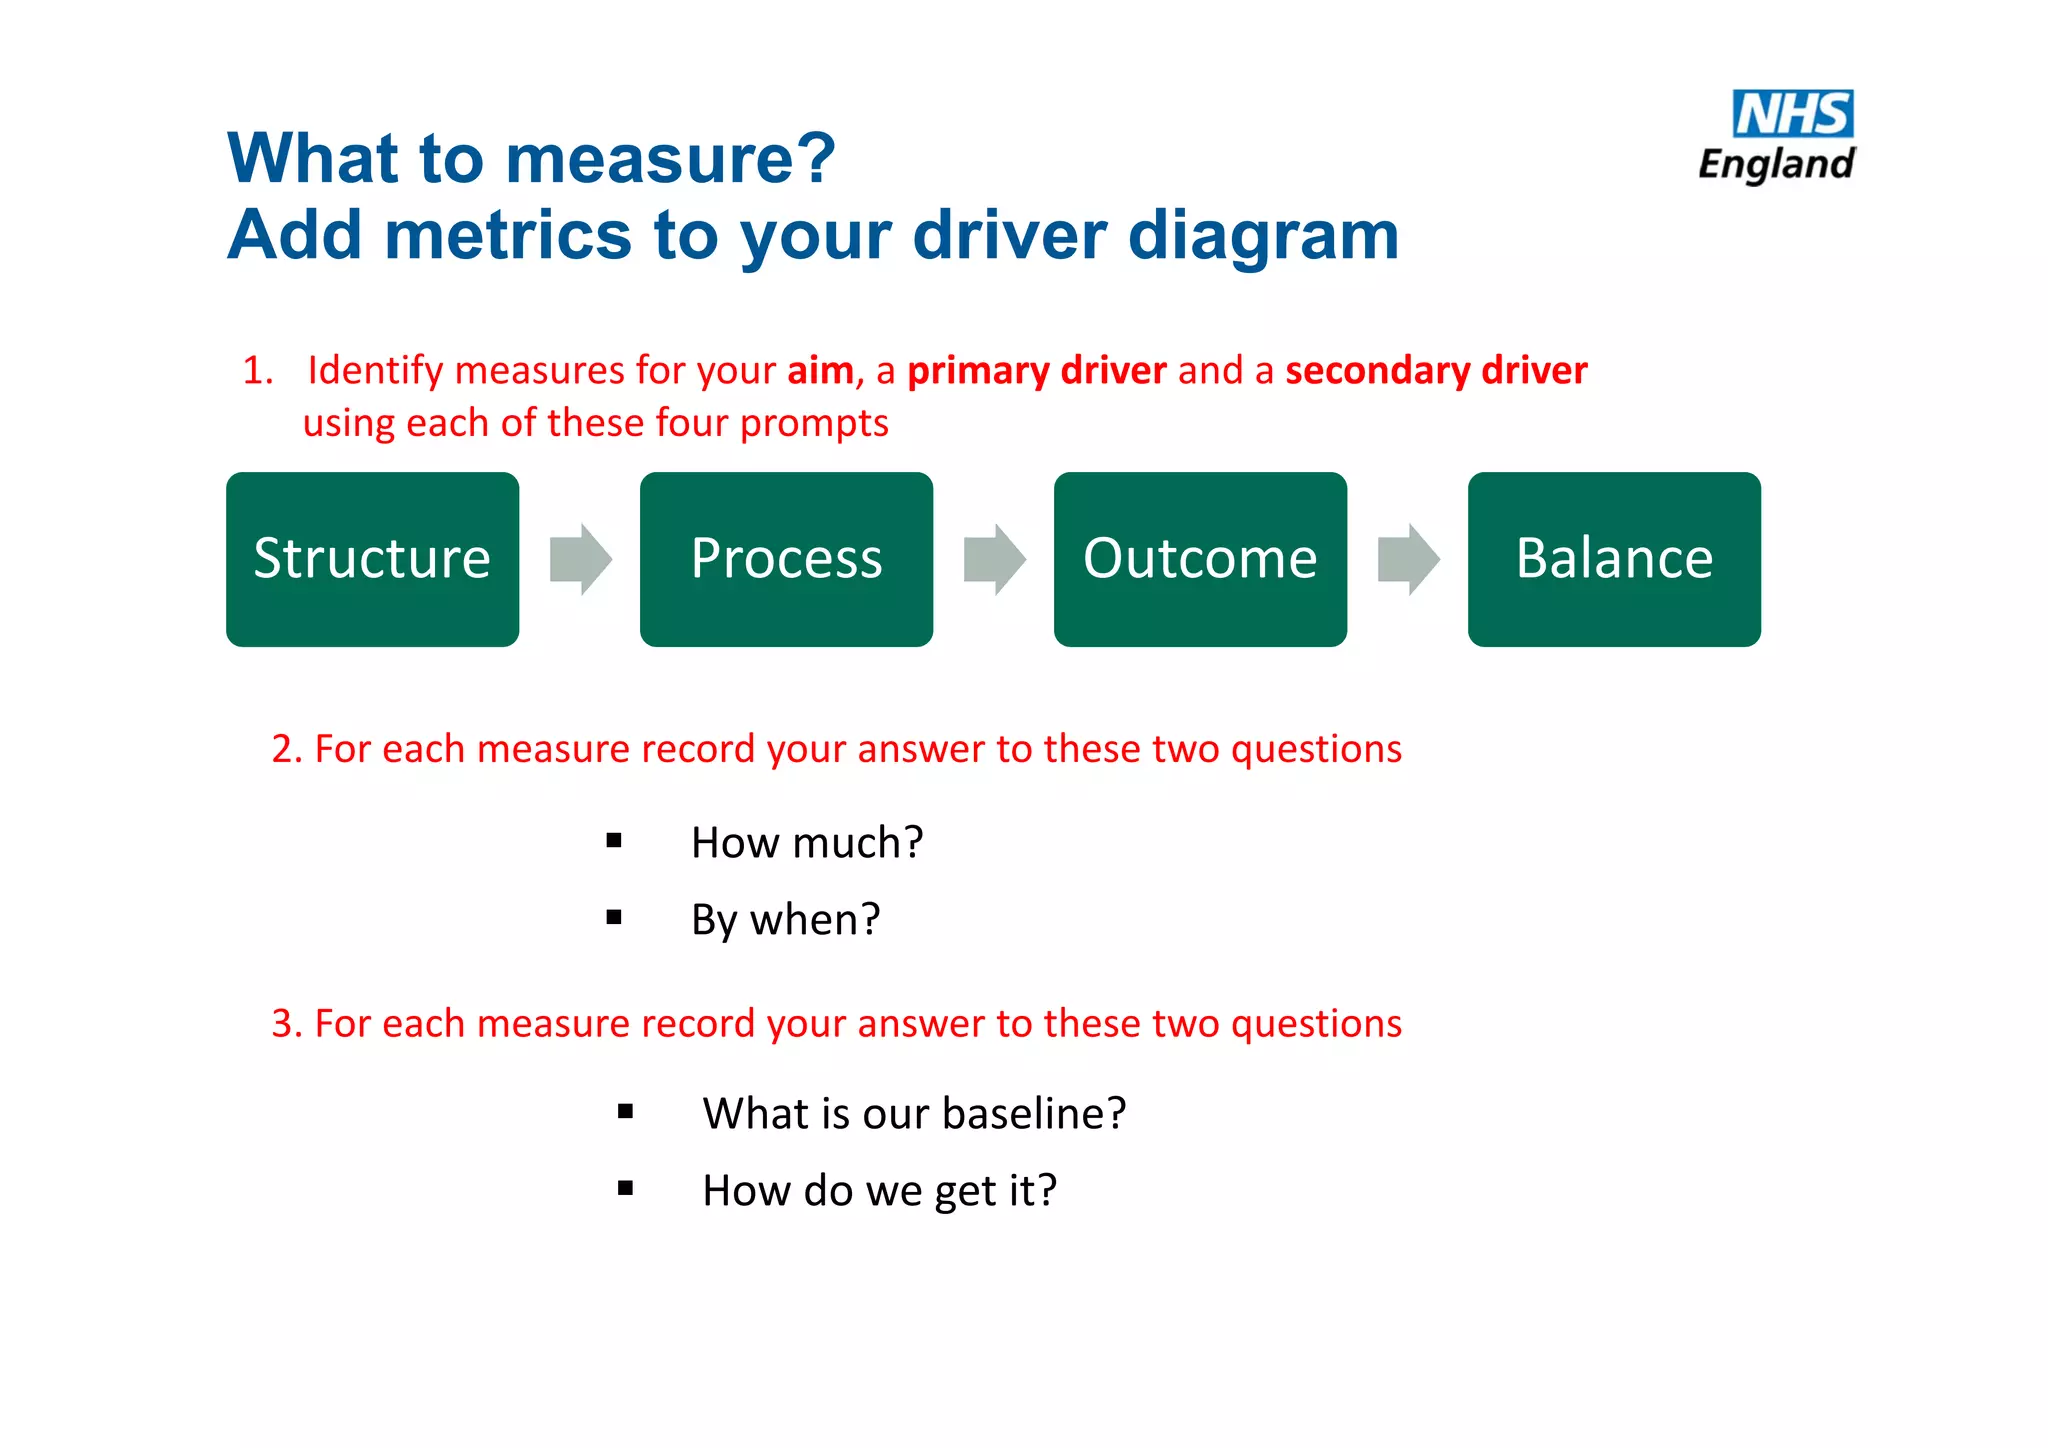
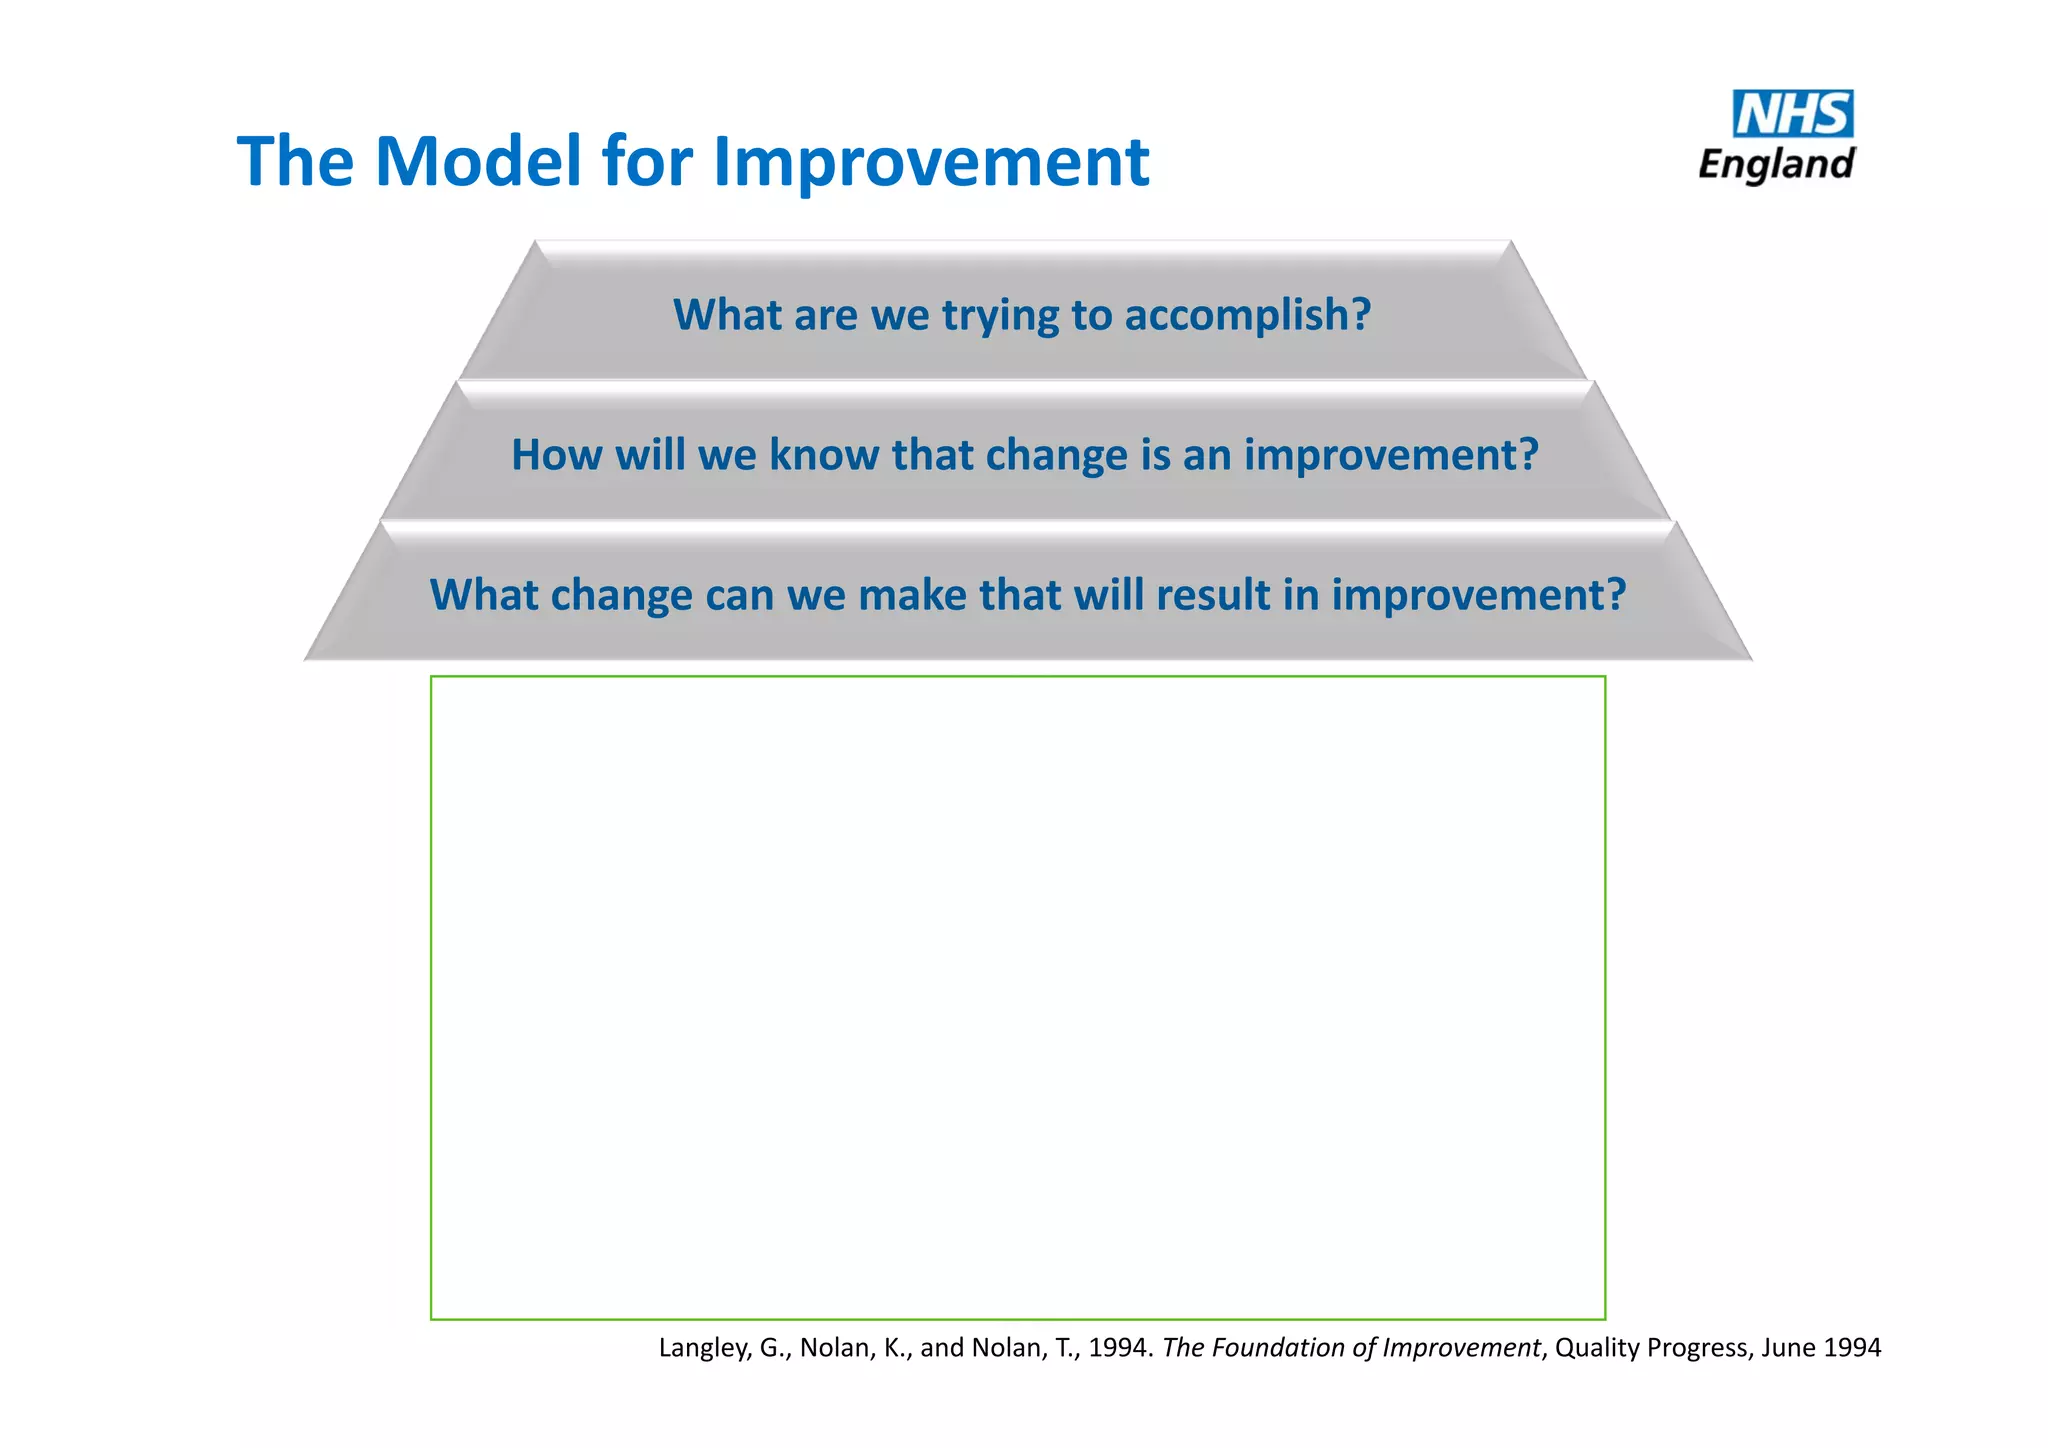
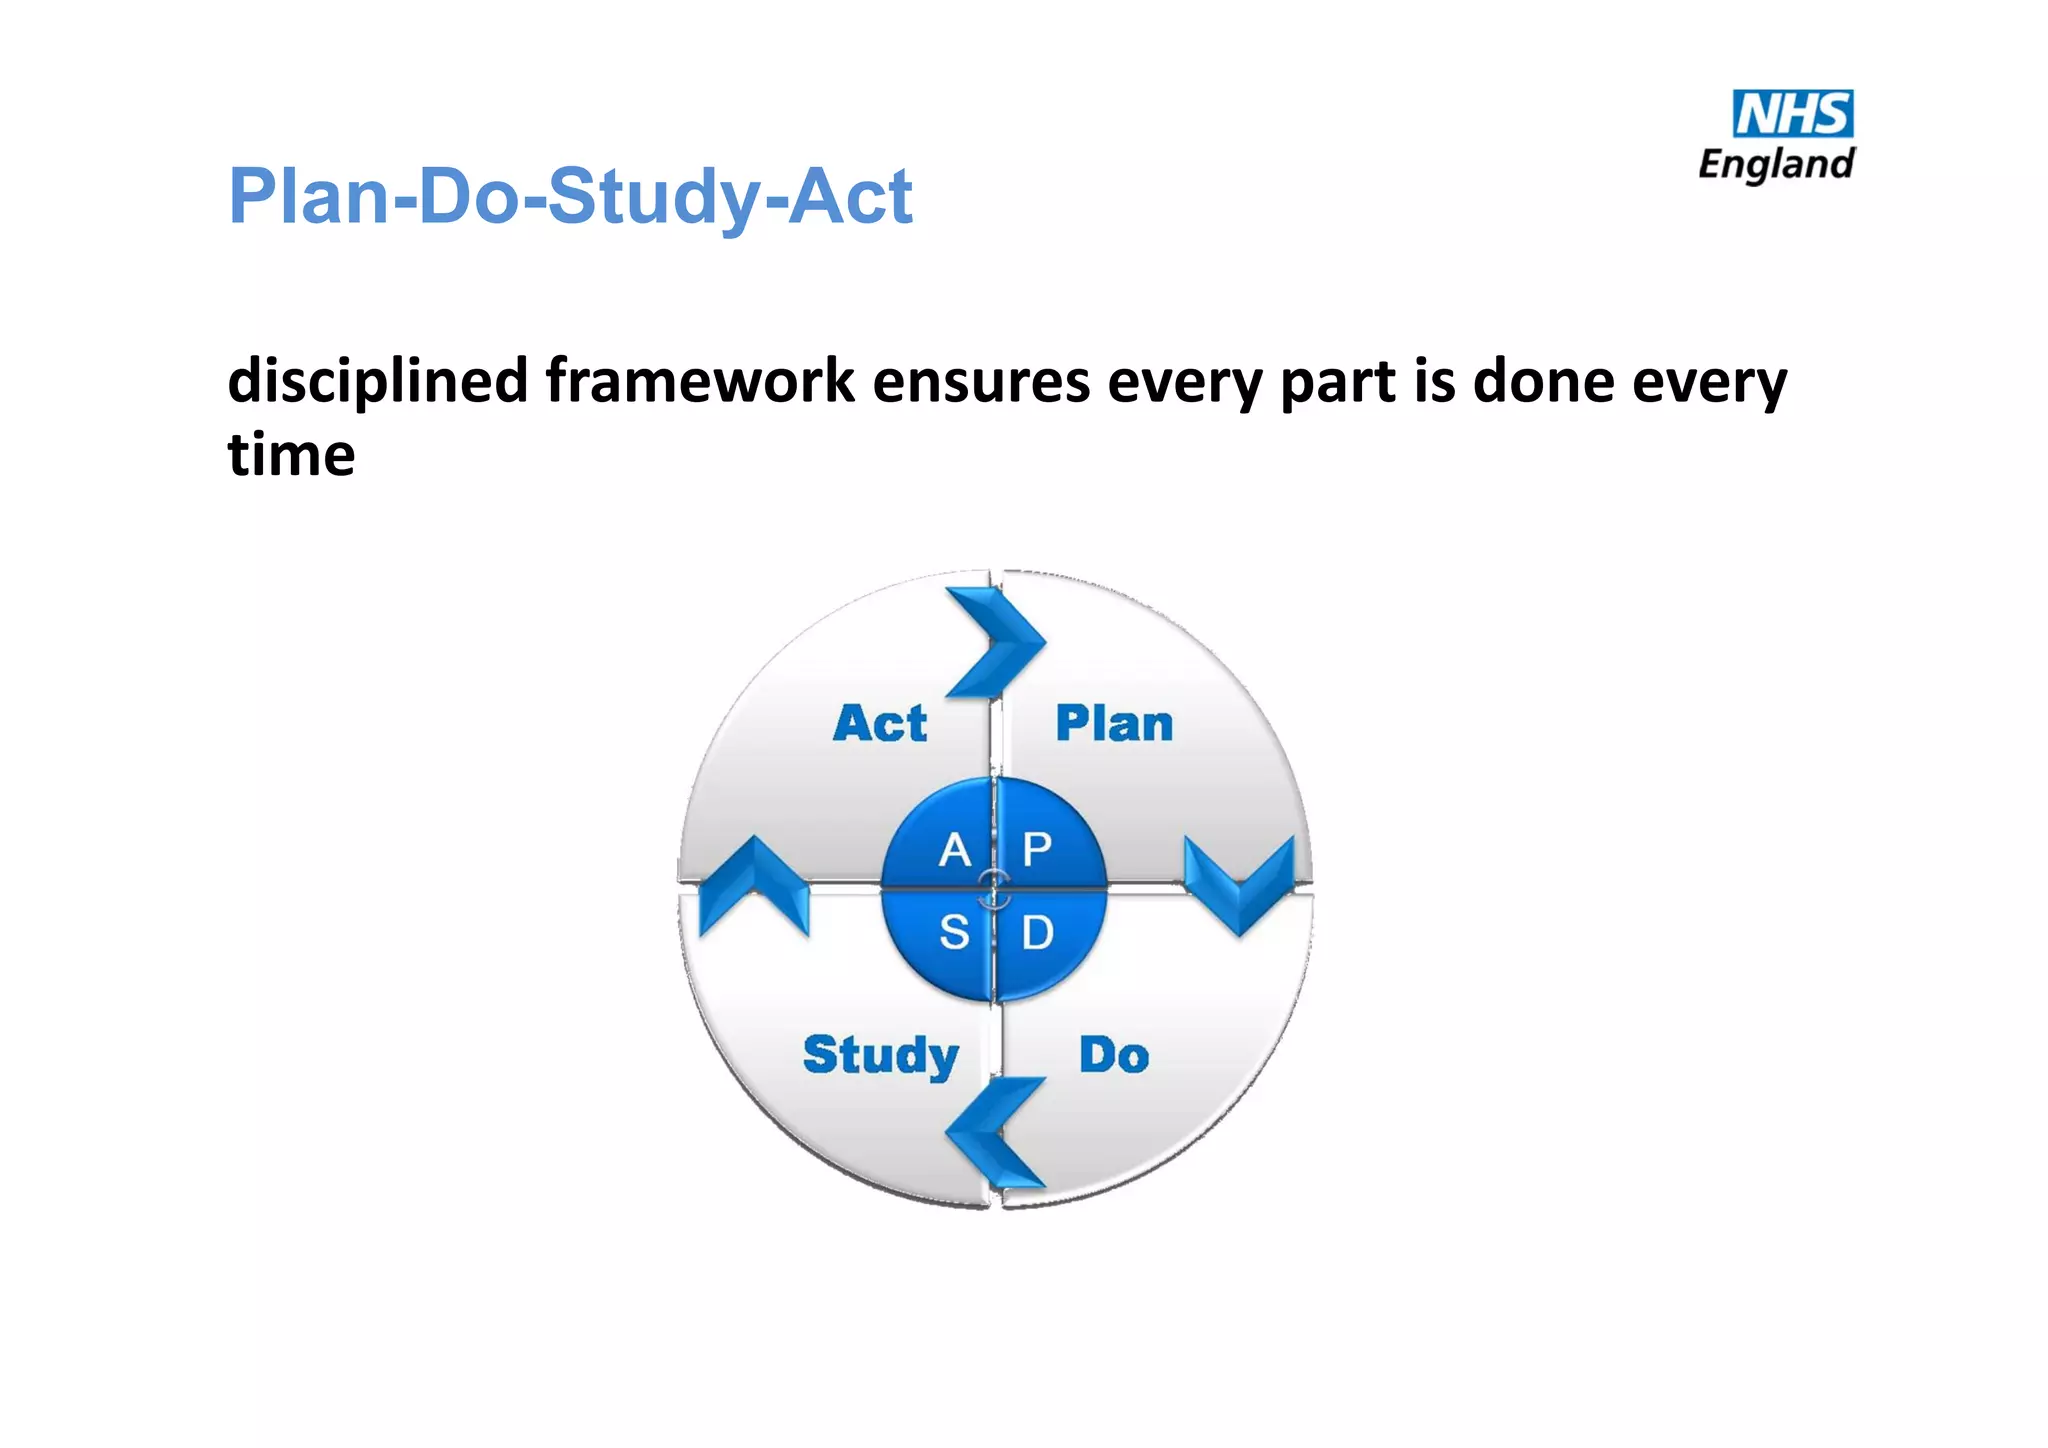
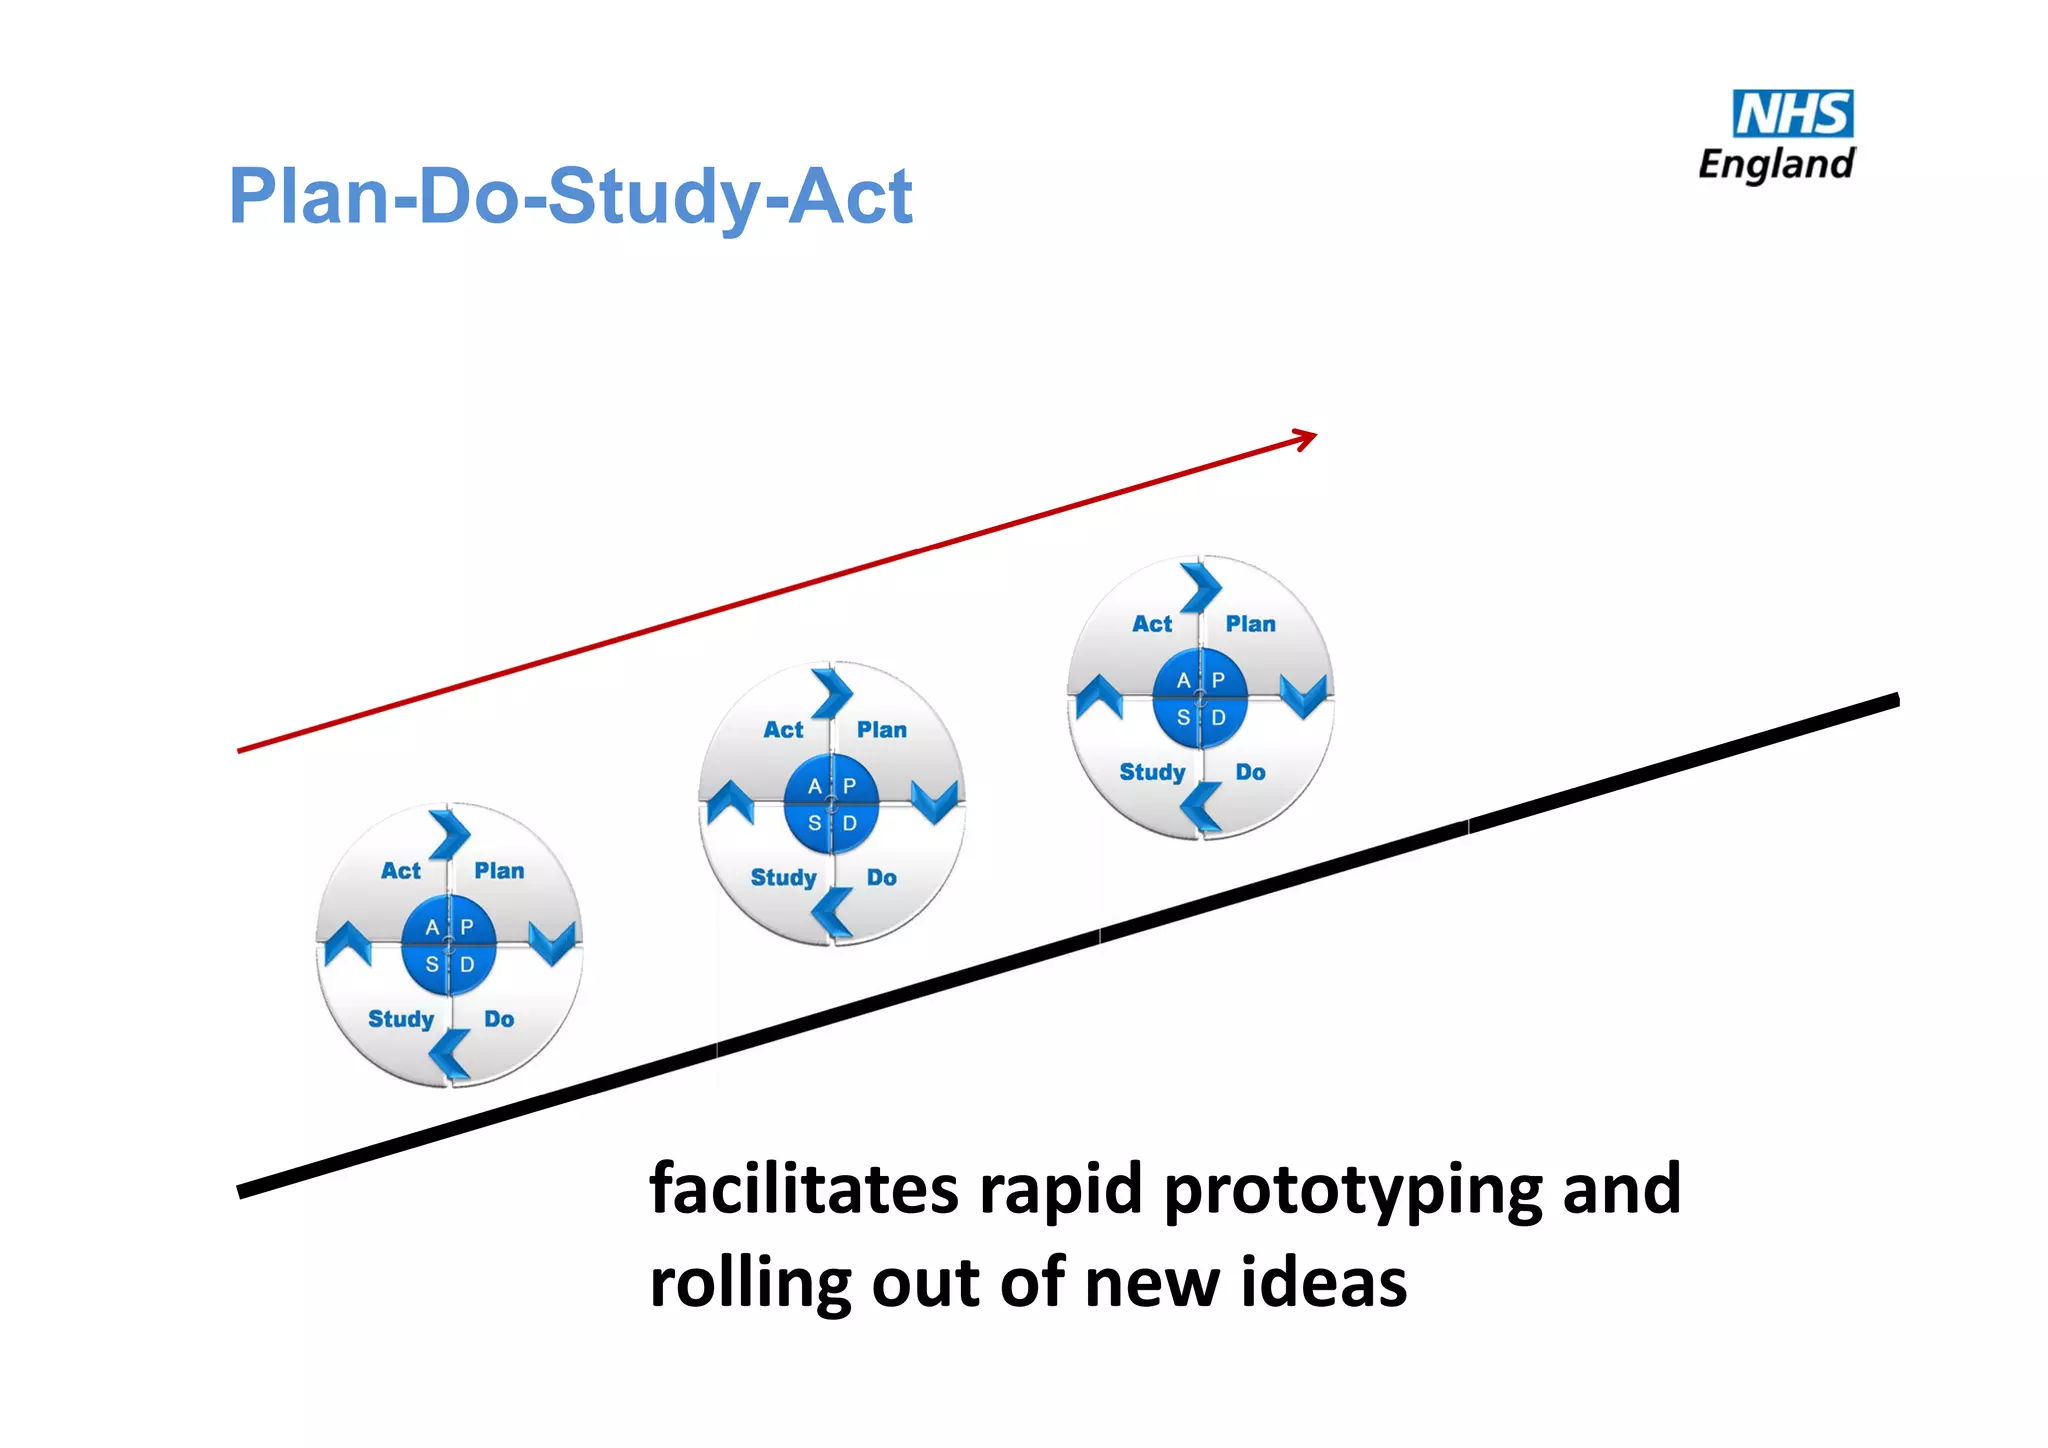
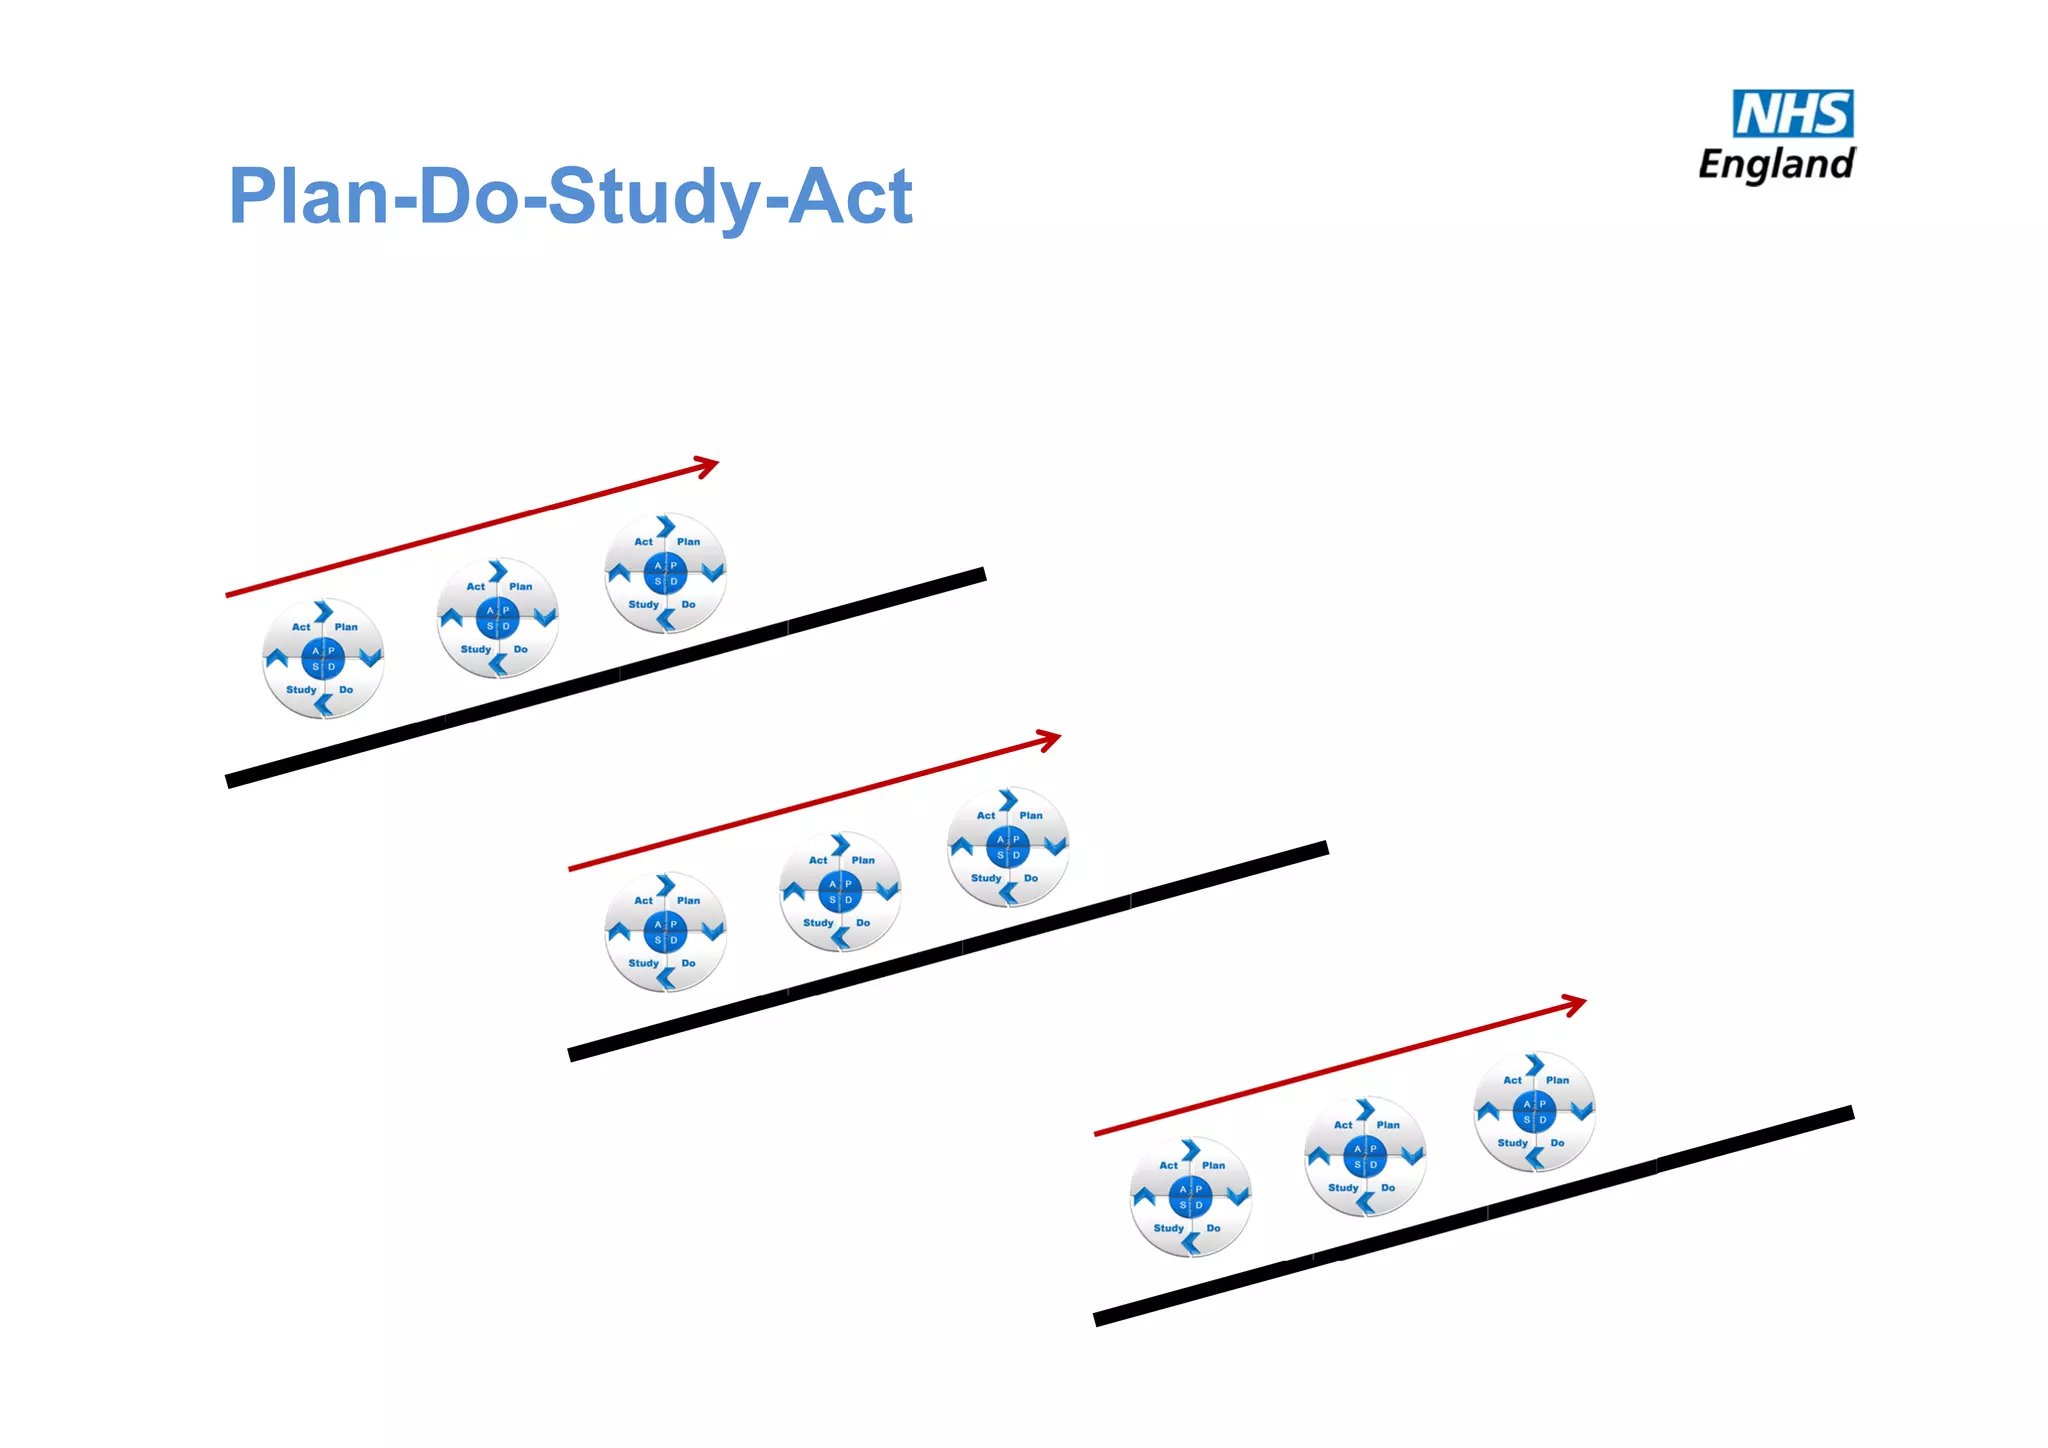
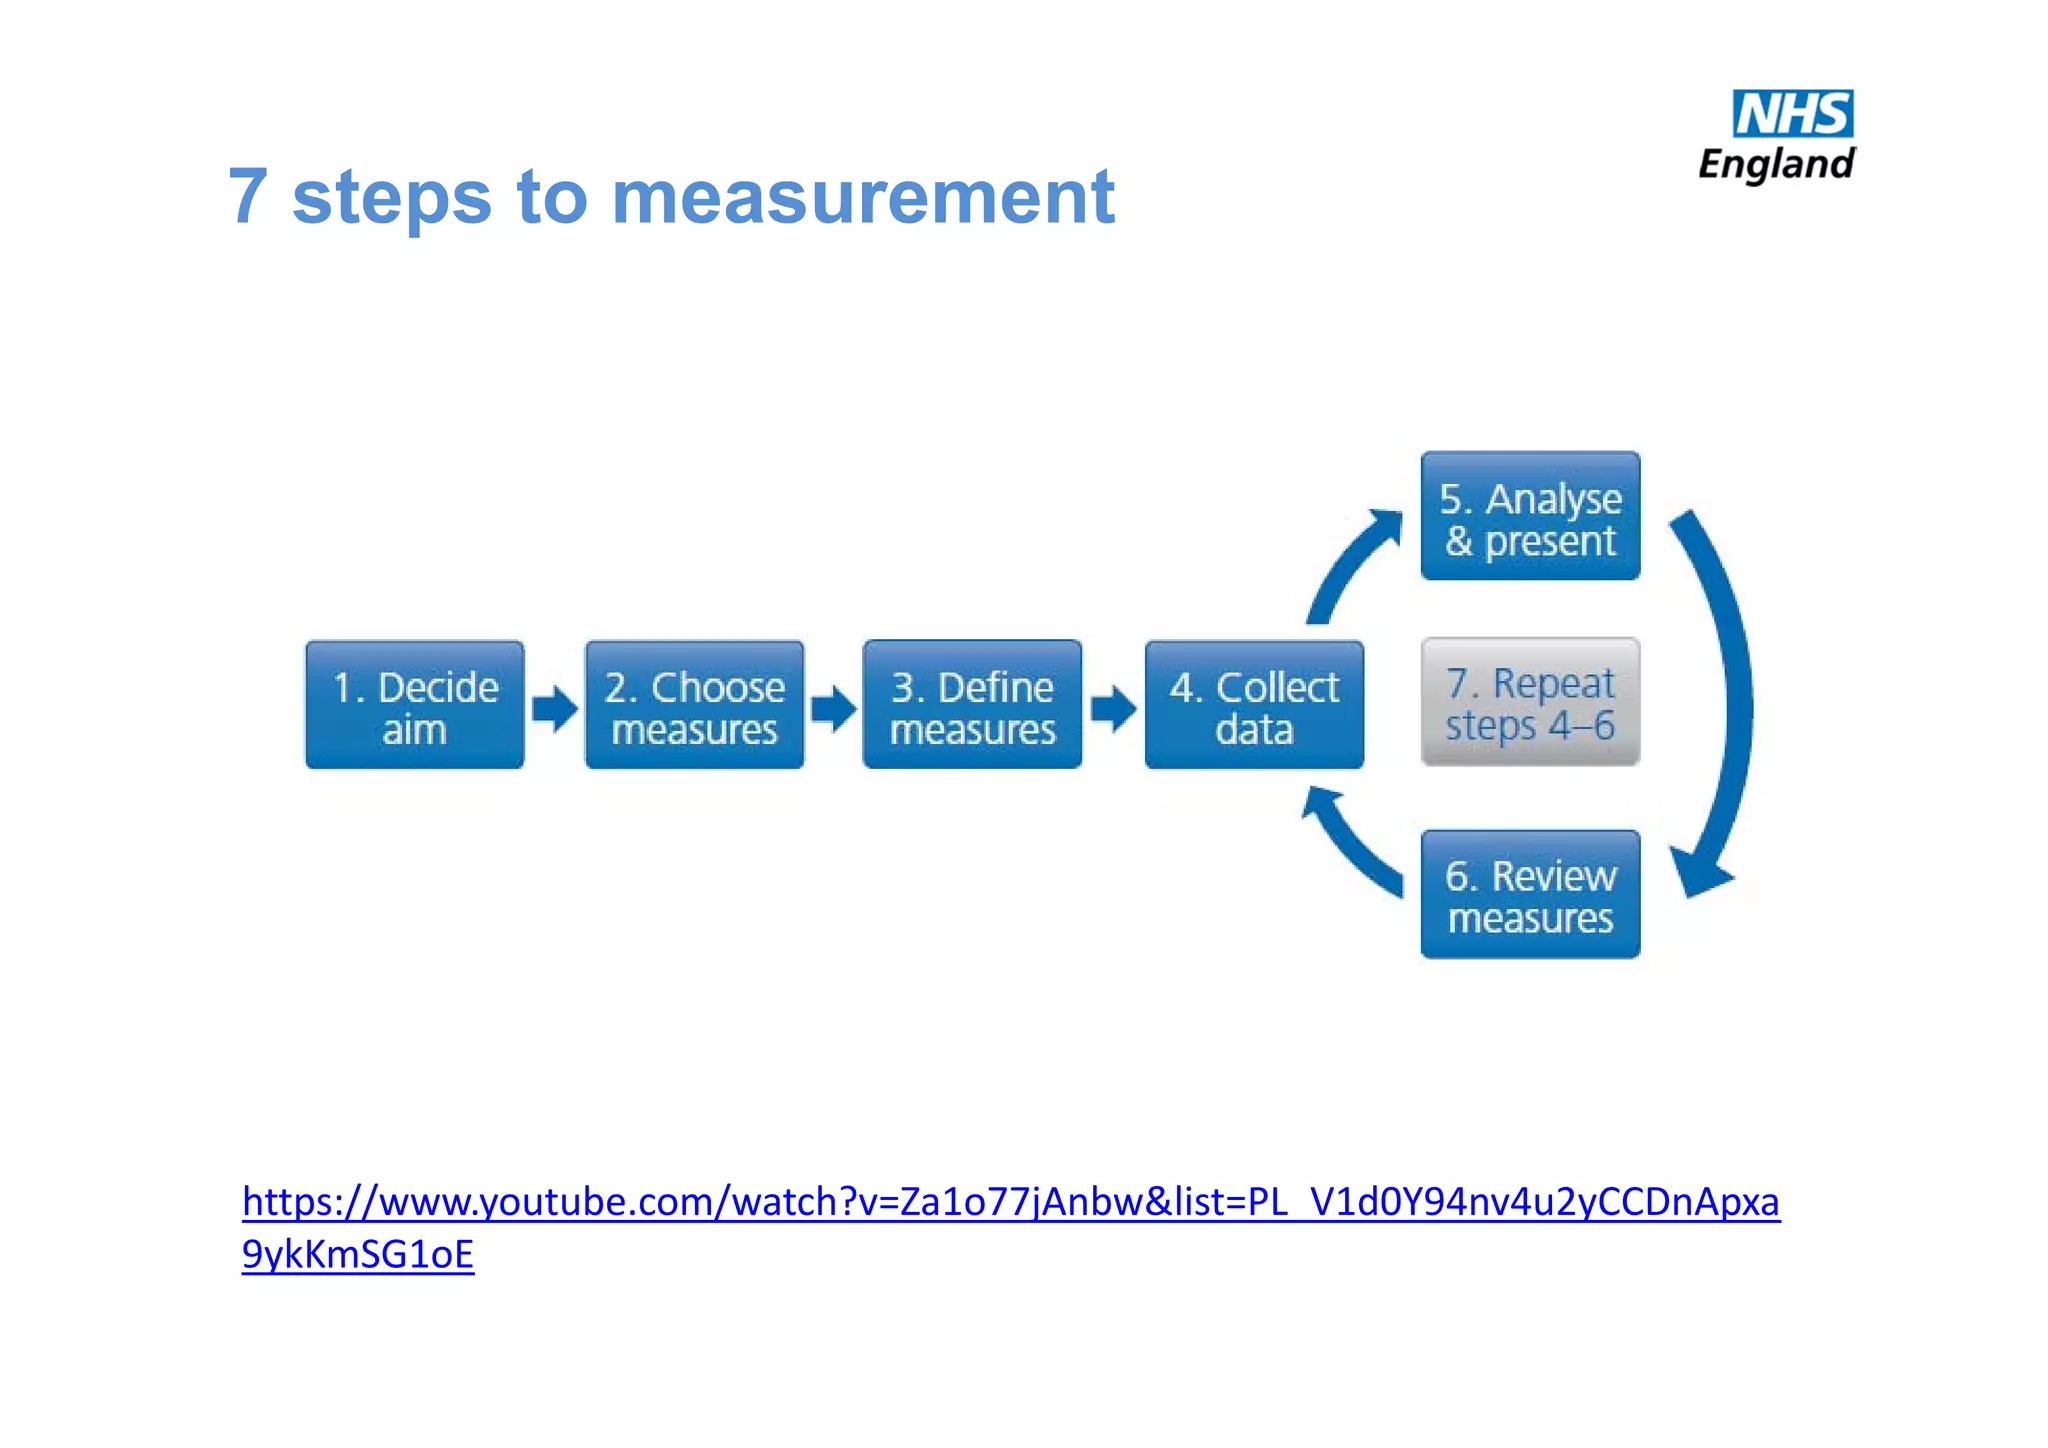
Vital signs – making measures matter
Transforming End of Life Care 
in Acute Hospitals
Sean Manning
18th November 2015
The black hole?
“We call our measures board the 
‘wall of shame’”
“ Most of what we collect seems 
meaningless to us. We rarely see the 
results of what we submit.”
This paperwork is stopping us doing 
our job!”
Insights into
• Importance of measurement
• Traditions of measurement
• Knowing How We are Doing
• Pareto principle
• Structure ‐ process ‐ outcome measures
• Driver diagrams
• Model for improvement
• Tracking variation
• 7 steps to measurement
Hitting the target but
missing the point!
Measurement for improvement
UnderstandUnderstand
ImproveImprove
MotivateMotivate
Curiosity
“I can make the last stage of
my life as good as possible
because everyone works together
confidently, honestly and
consistently to help me and the
people who are important to me,
including my carer(s).”
The traditions of measurement
• eg A‐B comparison, average, huge dataset
Research
• eg one‐to‐many benchmarking 
comparision, average, large dataset
Judgement
• eg continual analysis of single changing 
process over time
Improvement
Research Judgement Improvement
Goal
New knowledge (not its 
applicability)
Comparison
Reward / punishment
Spur for change
Process understanding
Evaluating a change
Hypothesis Fixed None Multiple and flexible
Measures Many Very few Few
Time period Long, past Long, past Short, current
Sample Large Large Small
Confounders Measure or control Describe and try to 
measure
Consider but rarely 
measured
Risks in 
improvement 
settings
Ignores time based 
variation
Over‐engineers data 
collection
Ignores time based 
variation
Over‐reaction to natural 
variation
Incorrectly perceived as 
‘inferior statistics’ 
Measurement mindsets
Based on L Solberg, G Mosser and S McDonald (1997) The Three Faces of Performance Measurement: Improvement, Accountability 
and Research, Journal on Quality Improvement, 23 (3): 135 ‐ 147. 
What mind sets are
at play here?
Research
Improvement
Judgement
What do we collect now?
What does a great team meeting look like?
Is that what we do?
SMART goals
Making better decisions about priorities
Focusing your effort where it matters
Prioritisation - The Pareto Principle
The Principle
We don’t have time to improve everything
A small number of issues account for the majority of the 
challenge
20% of causes account for 80% of the problem
We should focus on the ‘critical few’, not the ‘trivial 
many’
What does it look like?
Interruptions in surgeries
Tally by GPs of the causes of interruptions while with a patient.
Category Count
Sign script ‐ contraception 72
Sign script ‐ minor illness nurse 18
Clinical query ‐ learner 18
Clinical query ‐ NP 24
Sign script ‐ urgent 78
Chaperone 198
Equipment search 60
Admin info 312
Clinical query ‐ GP 66
Panic button 6
Cancellation msg 588
Other 72
TOTALS 1512
0
100
200
300
400
500
600
700
Count
What does it look like?
Interruptions in surgeries
Tally by GPs of the causes of interruptions 
while seeing patients.
Category Count % of Total
Cancellation msg 588 38.9
Admin info 312 20.6
Chaperone 198 13.1
Sign script ‐ urgent 78 5.2
Other 72 4.8
Sign script ‐ contraception 72 4.8
Clinical query ‐ GP 66 4.4
Equipment search 60 4
Clinical query ‐ NP 24 1.6
Clinical query ‐ learner 18 1.2
Sign script ‐ minor illness nurse 18 1.2
Panic button 6 0.4
TOTALS 1512 100
0
5
10
15
20
25
30
35
40
45
% of Total
What does it look like?
0
10
20
30
40
50
60
70
80
90
100
0
5
10
15
20
25
30
35
40
45
% of Total
Cumulative %
What does it look like?
0
10
20
30
40
50
60
70
80
90
100
0
5
10
15
20
25
30
35
40
45
% of Total
Cumulative %
Three categories of interruption (17%) account for 73% of the problem
What to measure?
Structure Process Outcome
Avedis Donabedian
‘Outcomes remain the ultimate validators of the 
effectiveness and quality of medical care’ but they ‘must 
be used with discrimination’
The environment in 
which care occurs
What care is 
delivered, and how
The impact on 
patients and the 
population
What to measure?
Structure Process Outcome
o Outcomes are a worthy goal
o All have pros & cons
o Should measure a selection of all 
three
Veena Ralegh
What to measure?
Structure Process Outcome
“Intermediate outcomes”
• a common solution
• properties of both process & outcome
• but be careful to acknowledge it’s 
not ‘the ultimate outcome’
OUTPUTS
HUMAN 
FACTORS
HUMAN
FACTORS
INTERNAL PROCESSES & PROCECEDURES
INPUTSEXTERNAL
FACTORS
Process Measure(s)
Outcome 
Measure(s)
Balancing 
Measure(s)
What to measure?
Is it being done?
Is it working?
Unintended 
consequences?
Is it in place?
Structure 
Measure(s)
Metrics for different audiences
Board
Service managers
Project managers
Frontline staff
Focus on
outcome
Focus on
process
Relevant process +
outcome measures
Relevant process +
outcome measures
Higher level outcome
measures
Highest level outcome
measures
Driver Diagrams
Benefits ...
build complex strategy
immediate
visual
Different scenarios ...
1. Help generate change ideas
2. Marshall a mass of change ideas
3. Survive failure / the unexpected
avoid “silver bullet”
thinking
highlight overlooked
ideas
Aim
Defect Free
Surgery
Avoid 
Mistakes
Avoid
Complications
Avoid
Delays
Driver Intervention
Conduct team brief
Conduct team debrief
Conduct time out
Produce accurate lists
Implement SSI bundle
Implement VTE bundle
Have correct kit to hand
Ensure staff adequately trained
O1
O2
O3
O1 Overall glitch count
O2 Never events
O3 Number of surgical site infections
P1 % lists with Team Brief
P2 % lists with Team Debrief
P3 % compliance with SSI bundle
P2
P1
P3
Driver Diagrams clinical example
AIM –
an 
improved 
system
Primary driver 1
Primary driver 2
How much? 
By when?
Secondary driver 1
Secondary driver 2
Secondary driver 3
Secondary driver 4
Secondary driver 5
CP1
CP2
CP3
CP4
CP5
CP6
CP7
How much? 
By when?
How much? 
By when?
AIM PRIMARY
DRIVERS
SECONDARY
DRIVERS
CHANGE
PROJECTS
Driver Diagrams
Planning & presenting change
CauseEffect
Drives
Driver Diagrams
Weight loss example
Pedometer
Gym work out 3
days
Squash weekends
No pub weekdays
Take packed
lunch
Low fat meals
Buy only 1
sandwich
Water bottle for
work bag
Fruit for dessert
Put away the
large glasses
Put cycling days
in diary
Cycling kit out
night before
Get rid of
Oyster cardBe more
active
during the
day
Do sport
Drink less
alcohol
Substitute
lower
calorie
foods
Eat lessReduce
calories in
Increase
calories out
Take stairs
2 stone
weight loss
in 6/12
AIM
Improve
access
Help marshal change ideas
Waiting room info, list clinician interests/languages, web info, Rx access 
(Feel Better Faster), signpost more (WIC/HV/minor inj/Secs/DNs/A&E), 
Chronic disease training, care planning, review periods, get it right first 
time, test results processing, teamworking/multiskilling, results line hours, 
protocols for test results, widen skill mix, BP machine in watiting room, 
update rpt Rx, pharmacist planning, streamline processes, streamline 
recalls, education & reflection, up‐to‐date pt contact details, know what 
appt is for, pt registration management, Triage, Care planning / pathways, 
more TelC, emailC, clinical buddies/teams, test results, repeat Rx, 
forwarding tasks + results, check + update usual GP, results actioned by 
right person, advance appt booking, reserve list, ask pt who they want, rota 
in advance, notekeeping w plan + pt info, Consult skills, comp skills, speed 
reading/typing, forms + equipment, multi‐skilling, longer appts, No emerg 
appts, Test results, Care planning, High risk processes, Referral chase‐up, 
results continuity, streamline processes, streamline recalls, clear up alerts,  
handling of normal results, self‐checkin, fast‐track queue 
AIM PRIMARY
DRIVERS
SECONDARY
DRIVERS
CHANGE
PROJECTS
Improve
access
Doctors (capacity)
Demand
Dealing (efficiency)
Appt system
Supply of GP time
Organisation of GP time
Pt help‐seeking
Deflecting demand
Creating our own workload
Planning care
Appt system project
GP rota change project
Community education
Waiting room TV
PILS & CDs & DVDs 
Feel better faster
Student sick notes
Reception signposting
Test results
Consulting skills
Longer appts
Guaranteed interpreters
Help marshal change ideas
Dealing w failed referrals
Chronic disease pathways
Review periods
More TelC’s
Email appts
Continuity
AIM PRIMARY
DRIVERS
SECONDARY
DRIVERS
CHANGE
PROJECTS
Improve
access
Doctors (capacity)
Demand
Dealing (efficiency)
Appt system
Supply of GP time
Organisation of GP time
Pt help‐seeking
Deflecting demand
Creating our own workload
Planning care
Appt system project
GP rota change project
Community education
Waiting room TV
PILS & CDs & DVDs 
Feel better faster
Student sick notes
Reception signposting
Test results
Consulting skills
Longer appts
Guaranteed interpreters
Survive failure / the unexpected
Dealing w failed referrals
Chronic disease pathways
Review periods
More TelC’s
Email appts
Continuity
Telephone triage
Adapted from the Transform National Steering Group 2011, with input from the NHS 
Institute for Innovation and Improvement
How much?
By when?
Different audiences
Board
Service managers
Project managers
Frontline staff
What to measure?
AIM –
an 
improved 
system
Primary driver 1
Primary driver 2
Secondary driver 1
Secondary driver 2
Secondary driver 3
Secondary driver 4
Secondary driver 5
CP1
CP2
CP3
CP4
CP5
CP6
CP7
What to measure?
Add metrics to your driver diagram
Structure Process Outcome Balance
How much?
By when?
What is our baseline?
How do we get it?
1. Identify measures for your aim, a primary driver and a secondary driver 
using each of these four prompts
2. For each measure record your answer to these two questions
3. For each measure record your answer to these two questions 
How much & how often?
There is no precise science to guide decisions about how 
many metrics to use, or how often…
How many different things
are you monitoring consciously?
How frequently?
Straight motorwayReversing round a corner
The usual approach
Meeting rooms
Real world
Approve 
Design Design Design Design
Implement !
Courtesy of Patient Safety First
Opinion
Meeting rooms
Real world
Courtesy of Patient Safety First
Implement  
Approve 
Test & 
refine
Test & 
refine
Test & 
refine
Design
Measurement
Change through small steps
Change ...
• with a clear purpose
• you can learn from (without fear of failure)
• which is less exhausting
• with fewer unintended consequences
• which builds engagement and optimism
What are we trying to accomplish?
How will we know that change is an improvement?
What change can we make that will result in improvement?
The Model for Improvement
Langley, G., Nolan, K., and Nolan, T., 1994. The Foundation of Improvement, Quality Progress, June 1994
Plan-Do-Study-Act
disciplined framework ensures every part is done every 
time
Plan-Do-Study-Act
facilitates rapid prototyping and 
rolling out of new ideas
Plan-Do-Study-Act
“We’re pressed for time, so we’ll be
jumping to conclusions”
We’re pressed for time, so we’ll 
be jumping to conclusions
The Manager’s Dilemma
In order to manage a system, we are required to make predictions
about its future.
How do you look at your data ?
“If I stick my right foot in a bucket
of boiling water and my left foot in
a bucket of ice water, on the
average, I’m pretty comfortable.”
The Problem with Averages
The Problem
Aggregated data presented in
tabular formats or with summary
statistics, will not help you measure
the impact of improvement efforts.
Aggregated data can only lead to
judgment, not to improvement.
Enumerative Dynamic
Did things improve?
What will happen next?
Should we do something?
Smoking Cessation :Percentage of smokers who
have quit smoking after 4 week programme
INTERVENTION
1C-58
50%
55%
60%
65%
70%
75%
80%
85%
90%
95%
100%
10/3/2007
10/17/2007
10/31/2007
11/14/2007
11/28/2007
12/12/2007
12/26/2007
1/9/2008
1/23/2008
2/6/2008
2/20/2008
3/5/2008
3/19/2008
Change
made
here
Did things improve?
What will happen next?
Should we do something?
Smoking Cessation :Percentage of smokers who
have quit smoking after 4 week programme
Protocol
introduced
Letter
from
Clinical
Director
Pharmacy
included
% surgical patients receiving Prophylactic Antibiotics
0
10
20
30
40
50
60
70
80
90
100
Apr-07
May-07
Jun-07
Jul-07
Aug-07
Sep-07
Oct-07
Nov-07
Dec-07
Jan-08
Feb-08
Mar-08
Apr-08
May-08
%reconciled
Run Chart
Waiting time results
70
35
0
10
20
30
40
50
60
70
80
Avg
Before
Change
Avg After
Change
WaitTime(min.)
Waiting time results 0
10
20
30
40
50
60
70
80
90
100
date
Jan
Feb
Mar
Apr
May
Jun
Jul
Aug
Sep
Oct
Nov
Dec
Change
Made
CycleTime(min.)
0
10
20
30
40
50
60
70
80
90
100
date
Jan
Feb
Mar
Apr
May
Jun
Jul
Aug
Sep
Oct
Nov
Dec
Change
Made
CycleTime(min.)
Unit 1
Unit 3
0
10
20
30
40
50
60
70
80
90
100
date
Jan
Feb
Mar
Apr
May
Jun
Jul
Aug
Sep
Oct
Nov
Dec
Change
Made
CycleTime(min.)
Unit 270
35
0
10
20
30
40
50
60
70
80
Avg
Before
Change
Avg After
Change
WaitTime(min.)
If We Have 3 Numbers in Sequence:
How Do You Report These?
Downward Trend
Upward Trend
Some Recovery
Setback
Collapse
Dramatic Recovery
Each pattern has an equal 1:6 chance
Lets Get Scientific!
Data has no meaning without a
Context
Run Charts
Plot the dots
0
10
20
30
40
50
60
70
80
90
100
date
Jan
Feb
Mar
Apr
May
Jun
Jul
Aug
Sep
Oct
Nov
Dec
Change
Made
CycleTime(min.)
0
20
40
60
80
100
120
Consecutive trips
Min.
My Trip To Work
Mean
Common
Cause
Special
Cause
Statistical Process Control
(SPC) Charts:
No of Admissions
0
200
150
100
50
250
Performance Report – Number of Admissions
Week
1 2 3 4 5 6 7 8 9 10 11 12 13 14 15 16 17 18 19 20
No Admissions          Median          Lower Limit (66.5)          Upper Limit (222.4)
65
It is normal
to have some variation
But some may be
‘special’
Control charts
2 Ways To Improve A Process
If controlled variation (Common Cause)
• process is stable
• variation is inherent to process
• therefore, process must be changed i.e. Redesign 
If uncontrolled variation (Special Cause)
• process is unstable
• variation is extrinsic to process
• cause should be identified and “treated”
7 steps to measurement
https://www.youtube.com/watch?v=Za1o77jAnbw&list=PL_V1d0Y94nv4u2yCCDnApxa
9ykKmSG1oE
Insights into
• Importance of measurement
• Traditions of measurement
• Knowing How We are Doing
• Pareto principle
• Structure ‐ process ‐ outcome measures
• Driver diagrams
• Model for improvement
• Tracking variation
• 7 steps to measurement
What do you need from your data?

Transforming End of Life Care in Acute Hospitals PM Workshop 3: Vital Signs ‘Making Measurement Better’ How well things are going and how to make it better’