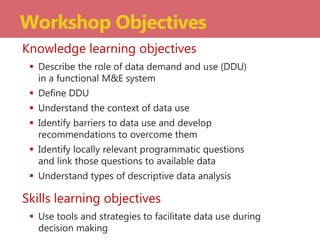
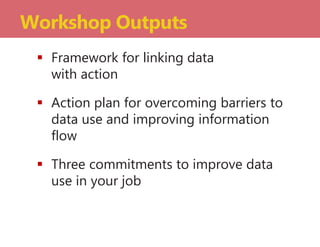
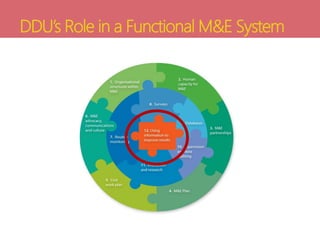
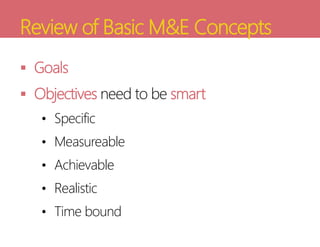
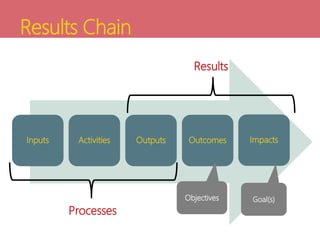
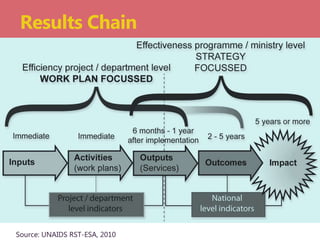
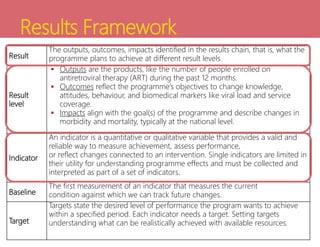
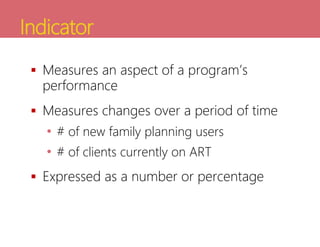
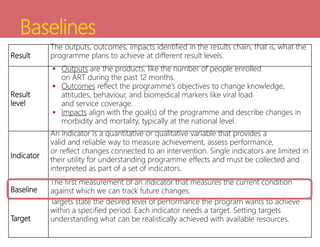
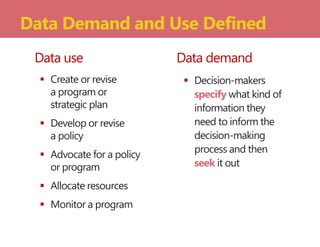
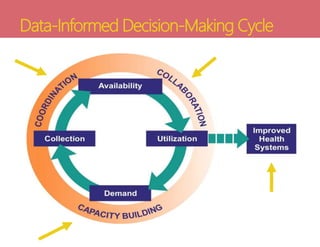
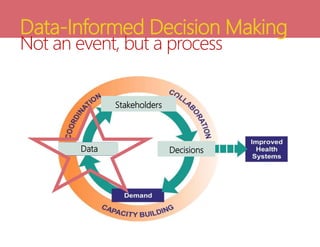
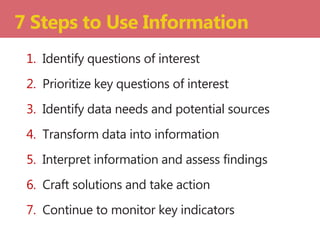
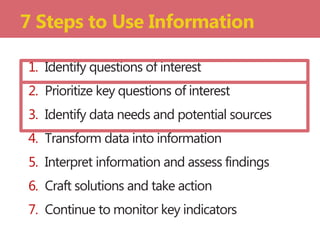
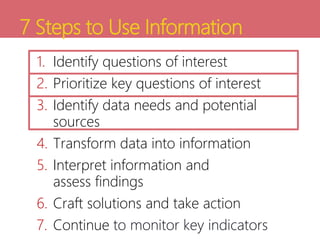
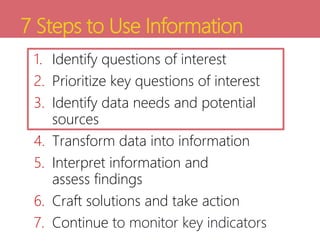
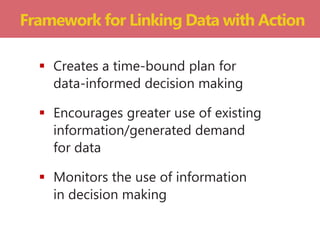
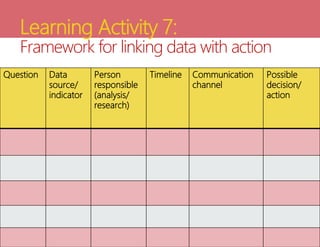
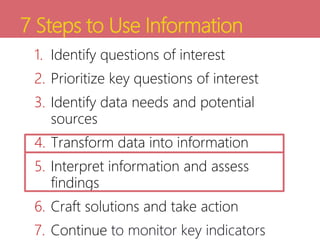
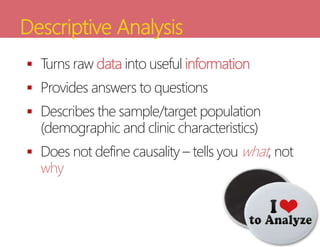
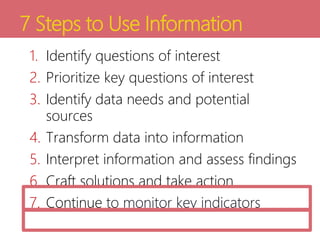
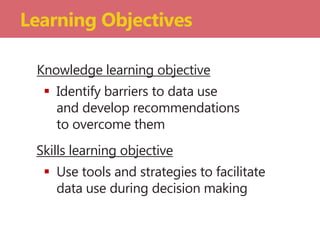
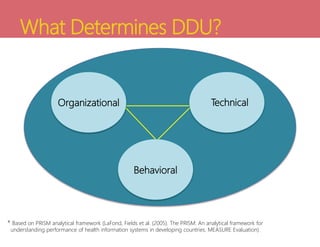
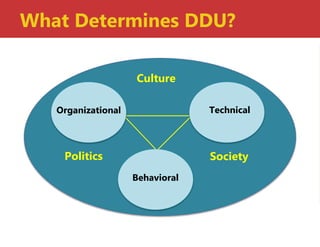
This document provides an overview of a workshop on data demand and use. The workshop objectives are to develop a framework for linking data with action, create an action plan for overcoming barriers to data use and improving information flow, and establish three commitments to improve data use in participants' jobs. The workshop covers various monitoring and evaluation concepts like results chains, indicators, baselines, and targets. It also discusses data demand and use, the context of decision making, barriers to data use, and descriptive data analysis techniques like service delivery analysis and unit cost analysis. Participants will learn a seven-step process for using information to make data-informed decisions.
Led by Tara Nutley
The Data Demand and Use Training Materials increase the skills of M&E officers and health program staff to conduct data analysis, interpretation, presentation and use for health program improvement. Download Data Demand and Use Training Materials: https://www.cpc.unc.edu/measure/tools/data-demand-use/data-demand-and-use-training-resources
Webinar Recording: http://universityofnc.adobeconnect.com/p9rbiydyl2a/
Identifying the basic purposes and scope of M&E. Describing the functions of an M&E plan. Identifying and understanding the main components of an M&E plan
Assessment of Constraints to Data Use is a rapid assessment tool designed to identify barriers and constraints that inhibit effective practices in data use.
http://www.cpc.unc.edu/measure/publications/ms-11-46-a
Self-Assessment of Organizational Capacity in Monitoring & EvaluationMEASURE Evaluation
Presentation that captures self-assessments of two teams of Ethiopian health officers (most of whom have M&E responsibilities): those from SNNP Regional Health Bureau and those from the Sidama Zonal Health Department.
Integrating big data into the monitoring and evaluation of development progra...UN Global Pulse
This report provides guidelines for evaluators, evaluation and programme managers, policy makers
and funding agencies on how to take advantage of the rapidly emerging field of big data in the design
and implementation of systems for monitoring and evaluating development programmes.
The report is organized in two parts. Part I: Development evaluation in the age of big data reviews the data revolution and discusses the promise, and challenges this offers for strengthening development monitoring and evaluation. Part II: Guidelines for integrating big data into the monitoring and evaluation frameworks of development programmes focuses on what a big data inclusive M&E system would look like.
Data for Impact hosted a one-hour webinar sharing guidance for using routine data in evaluations. More: https://www.data4impactproject.org/resources/webinars/routine-data-use-in-evaluation-practical-guidance/
DAS Slides: Data Quality Best PracticesDATAVERSITY
Tackling Data Quality problems requires more than a series of tactical, one-off improvement projects. By their nature, many Data Quality problems extend across and often beyond an organization. Addressing these issues requires a holistic architectural approach combining people, process, and technology. Join Nigel Turner and Donna Burbank as they provide practical ways to control Data Quality issues in your organization.
A series of modules on project cycle, planning and the logical framework, aimed at team leaders of international NGOs in developing countries.
Part 7 of 11.
There are two handouts to go with this module, Population Indicators, and a Logframe with blanks. http://www.slideshare.net/Makewa/population-indicators-handout and http://www.slideshare.net/Makewa/exercise-watsan-logframe-with-blanks
The Information Use Map assesses and identifies opportunities for improved data use and feedback mechanisms for stakeholders across different levels of the health system.
https://www.cpc.unc.edu/measure/publications/ms-11-46-c
Presentation recording: http://universityofnc.adobeconnect.com/p1kr6eri348/
Managing missing values in routinely reported data: One approach from the Dem...MEASURE Evaluation
This Data for Impact webinar was held in December 2020. Access the recording and learn more at https://www.data4impactproject.org/resources/webinars/managing-missing-values-in-routinely-reported-data-one-approach-from-the-democratic-republic-of-the-congo/
This Data for Impact webinar took place October 29, 2020. Learn more at https://www.data4impactproject.org/resources/webinars/use-of-routine-data-for-economic-evaluations/
Lessons learned in using process tracing for evaluationMEASURE Evaluation
Access the recording for this Data for Impact (D4I) webinar at https://www.data4impactproject.org/lessons-learned-in-using-process-tracing-for-evaluation/
Report Back from SGO 2024: What’s the Latest in Cervical Cancer?bkling
Are you curious about what’s new in cervical cancer research or unsure what the findings mean? Join Dr. Emily Ko, a gynecologic oncologist at Penn Medicine, to learn about the latest updates from the Society of Gynecologic Oncology (SGO) 2024 Annual Meeting on Women’s Cancer. Dr. Ko will discuss what the research presented at the conference means for you and answer your questions about the new developments.
ARTIFICIAL INTELLIGENCE IN HEALTHCARE.pdfAnujkumaranit
Artificial intelligence (AI) refers to the simulation of human intelligence processes by machines, especially computer systems. It encompasses tasks such as learning, reasoning, problem-solving, perception, and language understanding. AI technologies are revolutionizing various fields, from healthcare to finance, by enabling machines to perform tasks that typically require human intelligence.
Prix Galien International 2024 Forum ProgramLevi Shapiro
June 20, 2024, Prix Galien International and Jerusalem Ethics Forum in ROME. Detailed agenda including panels:
- ADVANCES IN CARDIOLOGY: A NEW PARADIGM IS COMING
- WOMEN’S HEALTH: FERTILITY PRESERVATION
- WHAT’S NEW IN THE TREATMENT OF INFECTIOUS,
ONCOLOGICAL AND INFLAMMATORY SKIN DISEASES?
- ARTIFICIAL INTELLIGENCE AND ETHICS
- GENE THERAPY
- BEYOND BORDERS: GLOBAL INITIATIVES FOR DEMOCRATIZING LIFE SCIENCE TECHNOLOGIES AND PROMOTING ACCESS TO HEALTHCARE
- ETHICAL CHALLENGES IN LIFE SCIENCES
- Prix Galien International Awards Ceremony
Explore natural remedies for syphilis treatment in Singapore. Discover alternative therapies, herbal remedies, and lifestyle changes that may complement conventional treatments. Learn about holistic approaches to managing syphilis symptoms and supporting overall health.
These simplified slides by Dr. Sidra Arshad present an overview of the non-respiratory functions of the respiratory tract.
Learning objectives:
1. Enlist the non-respiratory functions of the respiratory tract
2. Briefly explain how these functions are carried out
3. Discuss the significance of dead space
4. Differentiate between minute ventilation and alveolar ventilation
5. Describe the cough and sneeze reflexes
Study Resources:
1. Chapter 39, Guyton and Hall Textbook of Medical Physiology, 14th edition
2. Chapter 34, Ganong’s Review of Medical Physiology, 26th edition
3. Chapter 17, Human Physiology by Lauralee Sherwood, 9th edition
4. Non-respiratory functions of the lungs https://academic.oup.com/bjaed/article/13/3/98/278874
Couples presenting to the infertility clinic- Do they really have infertility...Sujoy Dasgupta
Dr Sujoy Dasgupta presented the study on "Couples presenting to the infertility clinic- Do they really have infertility? – The unexplored stories of non-consummation" in the 13th Congress of the Asia Pacific Initiative on Reproduction (ASPIRE 2024) at Manila on 24 May, 2024.
Tom Selleck Health: A Comprehensive Look at the Iconic Actor’s Wellness Journeygreendigital
Tom Selleck, an enduring figure in Hollywood. has captivated audiences for decades with his rugged charm, iconic moustache. and memorable roles in television and film. From his breakout role as Thomas Magnum in Magnum P.I. to his current portrayal of Frank Reagan in Blue Bloods. Selleck's career has spanned over 50 years. But beyond his professional achievements. fans have often been curious about Tom Selleck Health. especially as he has aged in the public eye.
Follow us on: Pinterest
Introduction
Many have been interested in Tom Selleck health. not only because of his enduring presence on screen but also because of the challenges. and lifestyle choices he has faced and made over the years. This article delves into the various aspects of Tom Selleck health. exploring his fitness regimen, diet, mental health. and the challenges he has encountered as he ages. We'll look at how he maintains his well-being. the health issues he has faced, and his approach to ageing .
Early Life and Career
Childhood and Athletic Beginnings
Tom Selleck was born on January 29, 1945, in Detroit, Michigan, and grew up in Sherman Oaks, California. From an early age, he was involved in sports, particularly basketball. which played a significant role in his physical development. His athletic pursuits continued into college. where he attended the University of Southern California (USC) on a basketball scholarship. This early involvement in sports laid a strong foundation for his physical health and disciplined lifestyle.
Transition to Acting
Selleck's transition from an athlete to an actor came with its physical demands. His first significant role in "Magnum P.I." required him to perform various stunts and maintain a fit appearance. This role, which he played from 1980 to 1988. necessitated a rigorous fitness routine to meet the show's demands. setting the stage for his long-term commitment to health and wellness.
Fitness Regimen
Workout Routine
Tom Selleck health and fitness regimen has evolved. adapting to his changing roles and age. During his "Magnum, P.I." days. Selleck's workouts were intense and focused on building and maintaining muscle mass. His routine included weightlifting, cardiovascular exercises. and specific training for the stunts he performed on the show.
Selleck adjusted his fitness routine as he aged to suit his body's needs. Today, his workouts focus on maintaining flexibility, strength, and cardiovascular health. He incorporates low-impact exercises such as swimming, walking, and light weightlifting. This balanced approach helps him stay fit without putting undue strain on his joints and muscles.
Importance of Flexibility and Mobility
In recent years, Selleck has emphasized the importance of flexibility and mobility in his fitness regimen. Understanding the natural decline in muscle mass and joint flexibility with age. he includes stretching and yoga in his routine. These practices help prevent injuries, improve posture, and maintain mobilit
Flu Vaccine Alert in Bangalore Karnatakaaddon Scans
As flu season approaches, health officials in Bangalore, Karnataka, are urging residents to get their flu vaccinations. The seasonal flu, while common, can lead to severe health complications, particularly for vulnerable populations such as young children, the elderly, and those with underlying health conditions.
Dr. Vidisha Kumari, a leading epidemiologist in Bangalore, emphasizes the importance of getting vaccinated. "The flu vaccine is our best defense against the influenza virus. It not only protects individuals but also helps prevent the spread of the virus in our communities," he says.
This year, the flu season is expected to coincide with a potential increase in other respiratory illnesses. The Karnataka Health Department has launched an awareness campaign highlighting the significance of flu vaccinations. They have set up multiple vaccination centers across Bangalore, making it convenient for residents to receive their shots.
To encourage widespread vaccination, the government is also collaborating with local schools, workplaces, and community centers to facilitate vaccination drives. Special attention is being given to ensuring that the vaccine is accessible to all, including marginalized communities who may have limited access to healthcare.
Residents are reminded that the flu vaccine is safe and effective. Common side effects are mild and may include soreness at the injection site, mild fever, or muscle aches. These side effects are generally short-lived and far less severe than the flu itself.
Healthcare providers are also stressing the importance of continuing COVID-19 precautions. Wearing masks, practicing good hand hygiene, and maintaining social distancing are still crucial, especially in crowded places.
Protect yourself and your loved ones by getting vaccinated. Together, we can help keep Bangalore healthy and safe this flu season. For more information on vaccination centers and schedules, residents can visit the Karnataka Health Department’s official website or follow their social media pages.
Stay informed, stay safe, and get your flu shot today!
Pulmonary Thromboembolism - etilogy, types, medical- Surgical and nursing man...VarunMahajani
Disruption of blood supply to lung alveoli due to blockage of one or more pulmonary blood vessels is called as Pulmonary thromboembolism. In this presentation we will discuss its causes, types and its management in depth.
Recomendações da OMS sobre cuidados maternos e neonatais para uma experiência pós-natal positiva.
Em consonância com os ODS – Objetivos do Desenvolvimento Sustentável e a Estratégia Global para a Saúde das Mulheres, Crianças e Adolescentes, e aplicando uma abordagem baseada nos direitos humanos, os esforços de cuidados pós-natais devem expandir-se para além da cobertura e da simples sobrevivência, de modo a incluir cuidados de qualidade.
Estas diretrizes visam melhorar a qualidade dos cuidados pós-natais essenciais e de rotina prestados às mulheres e aos recém-nascidos, com o objetivo final de melhorar a saúde e o bem-estar materno e neonatal.
Uma “experiência pós-natal positiva” é um resultado importante para todas as mulheres que dão à luz e para os seus recém-nascidos, estabelecendo as bases para a melhoria da saúde e do bem-estar a curto e longo prazo. Uma experiência pós-natal positiva é definida como aquela em que as mulheres, pessoas que gestam, os recém-nascidos, os casais, os pais, os cuidadores e as famílias recebem informação consistente, garantia e apoio de profissionais de saúde motivados; e onde um sistema de saúde flexível e com recursos reconheça as necessidades das mulheres e dos bebês e respeite o seu contexto cultural.
Estas diretrizes consolidadas apresentam algumas recomendações novas e já bem fundamentadas sobre cuidados pós-natais de rotina para mulheres e neonatos que recebem cuidados no pós-parto em unidades de saúde ou na comunidade, independentemente dos recursos disponíveis.
É fornecido um conjunto abrangente de recomendações para cuidados durante o período puerperal, com ênfase nos cuidados essenciais que todas as mulheres e recém-nascidos devem receber, e com a devida atenção à qualidade dos cuidados; isto é, a entrega e a experiência do cuidado recebido. Estas diretrizes atualizam e ampliam as recomendações da OMS de 2014 sobre cuidados pós-natais da mãe e do recém-nascido e complementam as atuais diretrizes da OMS sobre a gestão de complicações pós-natais.
O estabelecimento da amamentação e o manejo das principais intercorrências é contemplada.
Recomendamos muito.
Vamos discutir essas recomendações no nosso curso de pós-graduação em Aleitamento no Instituto Ciclos.
Esta publicação só está disponível em inglês até o momento.
Prof. Marcus Renato de Carvalho
www.agostodourado.com
micro teaching on communication m.sc nursing.pdfAnurag Sharma
Microteaching is a unique model of practice teaching. It is a viable instrument for the. desired change in the teaching behavior or the behavior potential which, in specified types of real. classroom situations, tends to facilitate the achievement of specified types of objectives.
New Drug Discovery and Development .....NEHA GUPTA
The "New Drug Discovery and Development" process involves the identification, design, testing, and manufacturing of novel pharmaceutical compounds with the aim of introducing new and improved treatments for various medical conditions. This comprehensive endeavor encompasses various stages, including target identification, preclinical studies, clinical trials, regulatory approval, and post-market surveillance. It involves multidisciplinary collaboration among scientists, researchers, clinicians, regulatory experts, and pharmaceutical companies to bring innovative therapies to market and address unmet medical needs.
1. Data Demand and Use
Workshop
Isabel Brodsky and Verne Kemerer
MEASURE Evaluation
October 24–27, 2017
Freetown, Sierra Leone
2. Knowledge learning objectives
Describe the role of data demand and use (DDU)
in a functional M&E system
Define DDU
Understand the context of data use
Identify barriers to data use and develop
recommendations to overcome them
Identify locally relevant programmatic questions
and link those questions to available data
Understand types of descriptive data analysis
Skills learning objectives
Use tools and strategies to facilitate data use during
decision making
Workshop Objectives
3. Framework for linking data
with action
Action plan for overcoming barriers to
data use and improving information
flow
Three commitments to improve data
use in your job
Workshop Outputs
5. Session 1: Learning Objectives
Knowledge learning objective:
Describe the role of data demand and use
in a functional monitoring and evaluation
(M&E) system
7. Strategic Information
Are we making progress towards or are we
achieving our goals, objectives, and targets?
How does service delivery vary across facilities?
What are we doing well and how are we
under-performing?
Can we improve service coverage with
existing resources?
How should we allocate resources?
Do we need to advocate for additional resources or
for changes to policies
and programmes?
8. Review of Basic M&E Concepts
Goals
Objectives need to be smart
• Specific
• Measureable
• Achievable
• Realistic
• Time bound
11. Results Framework
Result
The outputs, outcomes, impacts identified in the results chain, that is, what the
programme plans to achieve at different result levels.
Result
level
Outputs are the products, like the number of people enrolled on
antiretroviral therapy (ART) during the past 12 months.
Outcomes reflect the programme’s objectives to change knowledge,
attitudes, behaviour, and biomedical markers like viral load and service
coverage.
Impacts align with the goal(s) of the programme and describe changes in
morbidity and mortality, typically at the national level.
Indicator
An indicator is a quantitative or qualitative variable that provides a valid and
reliable way to measure achievement, assess performance,
or reflect changes connected to an intervention. Single indicators are limited in
their utility for understanding programme effects and must be collected and
interpreted as part of a set of indicators.
Baseline
The first measurement of an indicator that measures the current
condition against which we can track future changes.
Target
Targets state the desired level of performance the program wants to achieve
within a specified period. Each indicator needs a target. Setting targets
understanding what can be realistically achieved with available resources.
12. Indicator
Measures an aspect of a program’s
performance
Measures changes over a period of time
• # of new family planning users
• # of clients currently on ART
Expressed as a number or percentage
13. Baselines
Result
The outputs, outcomes, impacts identified in the results chain, that is, what the
programme plans to achieve at different result levels.
Result
level
Outputs are the products, like the number of people enrolled
on ART during the past 12 months.
Outcomes reflect the programme’s objectives to change knowledge,
attitudes, behaviour, and biomedical markers like viral load
and service coverage.
Impacts align with the goal(s) of the programme and describe changes in
morbidity and mortality, typically at the national level.
Indicator
An indicator is a quantitative or qualitative variable that provides a
valid and reliable way to measure achievement, assess performance,
or reflect changes connected to an intervention. Single indicators are limited in
their utility for understanding programme effects and must be collected and
interpreted as part of a set of indicators.
Baseline
The first measurement of an indicator that measures the current condition
against which we can track future changes.
Target
Targets state the desired level of performance the program wants to achieve
within a specified period. Each indicator needs a target. Setting targets
understanding what can be realistically achieved with available resources.
14. What are the sources of data?
What are the data collection
methods?
Who collects the data?
How often are data collected?
Who analyses these data?
Who reports these data?
Who uses these data?
Establishing a Baseline
15. Targets
Result
The outputs, outcomes, impacts identified in the results chain, that is, what the
programme plans to achieve at different result levels.
Result
level
Outputs are the products, like the number of people enrolled on
ART during the past 12 months.
Outcomes reflect the programme’s objectives to change knowledge,
attitudes, behaviour, and biomedical markers like viral load
and service coverage.
Impacts align with the goal(s) of the programme and describe changes in
morbidity and mortality, typically at the national level.
Indicator
An indicator is a quantitative or qualitative variable that provides a
valid and reliable way to measure achievement, assess performance,
or reflect changes connected to an intervention. Single indicators are limited in
their utility for understanding programme effects and must be collected and
interpreted as part of a set of indicators.
Baseline
The first measurement of an indicator that measures the current
condition against which we can track future changes.
Target
Targets state the desired level of performance the program wants to achieve
within a specified period. Each indicator needs a target. Setting targets
understanding what can be realistically achieved with available resources.
16. Calculating Targets
Things to consider
Existing capacity of staff and facilities
Staff turn-over
Budget allocations through the
Ministry of Health (MOH)
Other funding streams like bilateral
and multilateral donors
21. Data use
Create or revise
a program or
strategic plan
Develop or revise
a policy
Advocate for a policy
or program
Allocate resources
Monitor a program
Data Demand and Use Defined
Data demand
Decision-makers
specify what kind of
information they
need to inform the
decision-making
process and then
seek it out
28. “We are always giving patient forms and
data to our M&E Unit, who then gives
data to donors and the government. I am
the head doctor and I never have the
chance to look through the data before
they go up. We just keep giving data up
and up, and we never hear back about
it…”
Head of ART facility, Nigeria
29. Census
Vital events data
Surveillance data
Household surveys
Facility-level service statistics
Financial and management information
Modeling, estimates, and projections
Health research
Data and Information
30. Paves path between data collectors
and users
Leads to greater appreciation
of data
Important element of management
and supervision
Working toward a Culture of Data Use
32. View activities from different perspectives
Have different degrees of understanding
Need/want different information
Need information at different levels
of complexity
Have different intensities of interest
Have different roles in the decision-making
process
Knowing Your Stakeholders
Why is it important?
33. Learning Activity 4
Stakeholder analysis matrix
Stakeholder
Description
Role
Knowledgelevel
Commitment
Resources
Constraints
Government Sector
Political Sector
Commercial Sector
Source: MEASURE Evaluation, 2011
34. Involving Stakeholders in the
Data Use Process
Relevance of data
Ownership of data
Appropriate dissemination
of data
Use of data
39. Knowledge learning objectives:
Define data demand and use
Identify barriers to data use and develop
recommendations to overcome them
Identify locally relevant programmatic
questions and link those questions to
available data
Session 4 Learning Objective
41. 1. Identify questions of interest
2. Prioritize key questions of interest
3. Identify data needs and potential sources
4. Transform data into information
5. Interpret information and assess findings
6. Craft solutions and take action
7. Continue to monitor key indicators
7 Steps to Use Information
42. Should we expand care and treatment
programs in Njombe province?
Am I meeting the HIV prevention needs of
my key populations?
Are men and women seeking HIV
care equally?
What is the quality of my HIV prevention
service?
Step 1: Identify Questions
Examples
43. Should we expand care and treatment
programs in Njombe province?
What is the burden of HIV in the province over
time?
How many facilities are offering counseling
and testing (C&T) in the region?
How many people are being seen
at each facility?
Are there key facilities that have capacity to
expand C&T to reach gaps?
Step 2: Prioritize Questions
44. Demographic and health surveys (DHS),
AIDS indicator surveys (AIS), etc.
Routine health information system (RHIS)
External data sources: behavioral surveillance systems,
mapping exercises, surveys
Projections
Step 3: Identify Data Sources
45. Step 4: Transform Data into Information
Source: Key Findings of the 2013 Sierra Leone Demographic & Health Survey, page 9
46. Step 5: Interpret Information
and Draw Conclusions
Relevance
of finding
Reasons
for finding
Consider
other data
Conduct
further
research
47. Gather additional information
Prioritize Njombe in national expansion strategy
Expand voluntary counseling and testing (VCT) and
C&T in high priority facilities
Current VCT facilities do outreach to hotspots
Create referral protocol to ensure those tested are
entering into C&T
Step 6: Craft Solutions and Take Action
48. Monitor implementation of action plan
Consider frequency and duration of monitoring
Develop tool for monitoring
Step 7: Continue to Monitor Key Indicators
51. Knowledge learning objective
Identify locally relevant programmatic
questions and link those questions to
available data
Skills learning objective
Use tools and strategies to facilitate data
use during decision making
Session 5: Learning Objectives
52. 1. Identify questions of interest
2. Prioritize key questions of interest
3. Identify data needs and potential sources
4. Transform data into information
5. Interpret information and assess findings
6. Craft solutions and take action
7. Continue to monitor key indicators
7 Steps to Use Information
53. Questions
Are we implementing the
program as planned?
Are we fully meeting the
needs of our clients?
What additional resources are
needed to meet
the needs of our clients?
Are our interventions making
a difference?
Questions Lead to Decisions
Decisions
Allocation of resources across
districts/community-based
organizations (CBOs)
Revising program approaches
to emphasize results
Addition of outreach
education programs to most-
at-risk populations
Advocacy for new program
areas
54. Brainstorming about what different staff
are interested in knowing
Participatory discussion of indicators/data
— desire to know more
Gathering feedback from clients
Preparing for upcoming decisions
that have to be made or
planning exercises
External factors — donors questions
How Do I Identify Questions of Interest?
55. 7 Steps to Use Information
1. Identify questions of interest
2. Prioritize key questions of interest
3. Identify data needs and potential
sources
4. Transform data into information
5. Interpret information and
assess findings
6. Craft solutions and take action
7. Continue to monitor key indicators
58. 7 Steps to Use Information
1. Identify questions of interest
2. Prioritize key questions of interest
3. Identify data needs and potential
sources
4. Transform data into information
5. Interpret information and
assess findings
6. Craft solutions and take action
7. Continue to monitor key indicators
59. Creates a time-bound plan for
data-informed decision making
Encourages greater use of existing
information/generated demand
for data
Monitors the use of information
in decision making
Framework for Linking Data with Action
60. Learning Activity 7:
Framework for linking data with action
Question Data
source/
indicator
Person
responsible
(analysis/
research)
Timeline Communication
channel
Possible
decision/
action
63. 7 Steps to Use Information
1. Identify questions of interest
2. Prioritize key questions of interest
3. Identify data needs and potential
sources
4. Transform data into information
5. Interpret information and assess
findings
6. Craft solutions and take action
7. Continue to monitor key indicators
65. Descriptive Analysis
Turns raw data into useful information
Provides answers to questions
Describes the sample/target population
(demographic and clinic characteristics)
Does not define causality – tells you what, not
why
66. Question: Is my program meeting its
objectives?
Analysis: Compare program targets and
actual program performance
to learn how far you are from target
Interpretation: Why you have, or have
not, achieved the target and what
this means for your program
Descriptive Analysis Answers
Programmatic questions
67. Service delivery descriptive analysis
Service coverage analysis
Unit cost analysis
Trend analysis
Types of Descriptive Analyses
Using Routine Data
68. Service Delivery Descriptive Analysis
Selection of ARV Indicators
Private
sector
Public
health
system
Civil
society
# of clients who have refilled their prescriptions on-time at a
fee-for-service pharmacy
√
# of clients on ARVs who have been admitted into a
care facility for end-of-life support in the past six months √ √ √
# of clients on ARVs who have been counselled on ARV
adherence in the past three months
√ √ √
# of clients who have had CD4 and VL tested in the past six
months
√ √ √
# of clients enrolled in ARV programme √ √
# of client eligible for ARVs √ √ √
# of clients who have refilled their prescriptions on time at a
subsidized pharmacy
√ √
# of CD4 test kits procured through bilateral development
partners and distributed by NGOs
and INGOs to public-sector ARV clinics
√ √
69. Service Coverage Analysis
Supply of services data
Need for HIV services
Calculate:
Service coverage =
Supply of services
Demand for services
70. Service Coverage Analysis
Service
coverage
=
# of individuals who have
received the services
# of individuals in need
of the service
Service coverage =
467 individuals have received
HIV testing and counselling (HTC) services
1,000 individuals in need of HTC services
= 47%
71. Unit Cost Analysis
What is the unit cost of delivering antenatal care (ANC) services
through an existing mobile health unit that provides maternal and
child health (MCH) services?
Item Amount
Fixed costs per month
Overhead SLL 7.8M
Personnel SLL 30.5M
Variable costs per month
Commodities SLL 7.8M
Other SLL 15M
# MCH clients/month 100
# MCH clients/month receiving ANC services 23
Cost data adapted from 10.1371/journal.pone.0119236
72. Observe the overall pattern of change
Reveal patterns due to seasonal variations
Identify outliers and high/low performance in
certain time periods
Compare the effect before or after
an event
Produce projections to help with programme
planning and target setting
Descriptive Statistics
Trend analysis
73. Trend Analysis
Comparing time periods and sites
Source: 2016 Sierra Leone Malaria Indicator Survey
Full Report, page 51
74. Display trends, relationships, and comparisons
Simple and self-explanatory
Charts and Graphs
80. Session 6 Review: Interpreting Data
Relevance of
finding
Reasons for
finding
Consider
other data
Conduct
research
Have we met our target?
How does performance compare
to other time periods? Facilities?
What could explain the observation?
Talk to beneficiaries and community
leaders
Ask program managers
Analyze other data sources
• Do they confirm or reject
your finding?
o Why?
If there are no data, need for research
Methodology depends on question
and available resources
83. 7 Steps to Use Information
1. Identify questions of interest
2. Prioritize key questions of interest
3. Identify data needs and potential
sources
4. Transform data into information
5. Interpret information and assess findings
6. Craft solutions and take action
7. Continue to monitor key indicators
84. Knowledge learning objective
Identify barriers to data use
and develop recommendations
to overcome them
Skills learning objective
Use tools and strategies to facilitate
data use during decision making
Learning Objectives
85. What Determines DDU?
* Based on PRISM analytical framework (LaFond, Fields et al. (2005). The PRISM: An analytical framework for
understanding performance of health information systems in developing countries. MEASURE Evaluation).
Organizational Technical
Behavioral
87. Technical
Have you ever had an experience while making a policy or
program-related decision when you were concerned about the
quality of the information being used?
Behavioral
What specific challenges have you experienced among your
staff when it comes to using data?
Organizational
How does your organization support having the necessary
information to make decisions?
Learning Activity 10:
Identifying barriers to data use: discussion questions
88. Learning Activity 11:
Developing an action plan to address
barriers to data use
Barrier Action Steps
Responsible
person
Timeline Indicators
1. 1a.
1b.
1c
1a.
1b.
1c.
1a.
1b.
1c.
1a.
1b.
1c.
2. 2a.
2b.
2c.
2a.
2b.
2c.
2a.
2b.
2c.
2a.
2b.
2c.
89. Plan, plan, plan!!!
Engage key stakeholders to fully
understand:
• Decisions they make
• Information they need
• Appropriate dissemination
Building Data Use into Your Work
90. Institute regular meetings
Document and
communicate data
use successes
Practical Steps to Integrate DDU
Institutionalize tools (ex.,
framework for linking
data with action)
91. Identify a group leader
Identify 2–3 things your group can do
to facilitate data use within the first two
months of returning back to work, based
on your action plan
Small group discussion: 20 mins
Group presentations: 15 mins
Make Commitments
92. This presentation was produced with the support of the United
States Agency for International Development (USAID) under the
terms of MEASURE Evaluation cooperative agreement AID-OAA-L-
14-00004. MEASURE Evaluation is implemented by the Carolina
Population Center, University of North Carolina at Chapel Hill in
partnership with ICF International; John Snow, Inc.; Management
Sciences for Health; Palladium; and Tulane University. Views
expressed are not necessarily those of USAID or the United States
government.
www.measureevaluation.org