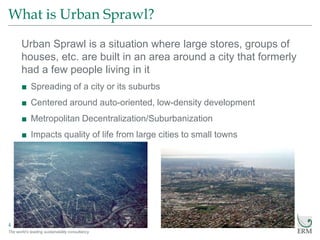
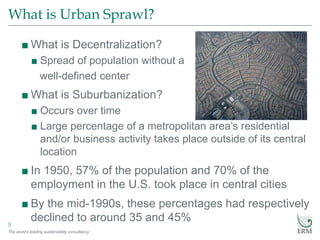
“Insert” then choose “Picture” – select your picture.
Right click your picture and “Send to back”.
The world’s leading sustainability consultancy
Urban Sprawl
By: Bill Burkey
The world’s leading sustainability consultancy
My inspiration for this topic…
2
The world’s leading sustainability consultancy
Contents
What is Urban Sprawl?
■ Decentralization
■ Suburbanization
Pros and Cons of Urban Sprawl
■ The “American Dream”
■ Air Pollution
Maps of Sprawl
■ Examples of Sprawling Cities
■ Commute times
What can we do to help with Urban Sprawl
■ Address Causes
■ Changes in Public Policy
The world’s leading sustainability consultancy
What is Urban Sprawl?
4
Urban Sprawl is a situation where large stores, groups of
houses, etc. are built in an area around a city that formerly
had a few people living in it
■ Spreading of a city or its suburbs
■ Centered around auto-oriented, low-density development
■ Metropolitan Decentralization/Suburbanization
■ Impacts quality of life from large cities to small towns
The world’s leading sustainability consultancy
What is Urban Sprawl?
5
■ What is Decentralization?
■ Spread of population without a
well-defined center
■ What is Suburbanization?
■ Occurs over time
■ Large percentage of a metropolitan area’s residential
and/or business activity takes place outside of its central
location
■ In 1950, 57% of the population and 70% of the
employment in the U.S. took place in central cities
■ By the mid-1990s, these percentages had respectively
declined to around 35 and 45%
The world’s leading sustainability consultancy
Pros of Urban Sprawl
6
■Less expensive land
■ “The American Dream”
■ Lower rent apartments
■ Lifestyle preference
■Better school system
■ Higher test scores
■ Lower dropout rates
■Crime rates generally lower
■ 37% higher in urban vs. suburban
■ 74% higher than in rural areas
The world’s leading sustainability consultancy
Cons of Urban Sprawl
7
■Automobile dependent/requirement
■ Increased traffic congestion and commutes
■ Higher air pollution
■ Increased levels of Auto crashes
■ Credited in part with obesity
■ Health issues
■Loss of Undeveloped Land
■ Affects water supply
■ Businesses, Schools, Services, etc. spread out
■ Roads/buildings destroy farmland and wildlife habitat
The world’s leading sustainability consultancy
Urban Sprawl in Houston from 1984 - 2012
8
The world’s leading sustainability consultancy
Urban Sprawl in Atlanta from 1985 - 2012
9
The world’s leading sustainability consultancy
Lowest and Highest Sprawling cities in the U.S.
10
■ The "Sprawl Index Scores" is derived from 22 factors that measure four
different metro-development features: diffusion or concentration of housing and
population; segregation or integration of homes vis-à-vis activities of daily life;
lack or presence of strong economic and social centers; and connectedness or
disconnectedness of street networks. Lower scores represent greater sprawl.
The average score for the 83 metros included in the study was 100.
The world’s leading sustainability consultancy
Average Commute time in the United States
11
The world’s leading sustainability consultancy
Suburban Sprawl – Not as cheap as you think!
12
The world’s leading sustainability consultancy
Not just an issue in the US
13
■ Suburbs are growing 160% faster than city centers
■ Half of urban residents live in the suburbs
■ 17 of the more than 40 new developments underway/planned in
Edmonton, net costs have been projected to exceed revenues by
nearly $4 billion over 60 years
■ The City of London, Ontario found that over a 50-year period sprawling
growth would entail capital costs $2.7 billion higher, and operating
costs about $1.7 billion higher, than for a compact growth scenario
■ Governments in Canada spend almost $29 billion on roads every year
■ More than they spend on transit, rail, air, marine, etc. combined
■ In Calgary, adopting a denser growth pattern that used 25% less land, it
could save $11 billion in capital costs alone
The world’s leading sustainability consultancy
Gasoline used per person (per year)
14
The world’s leading sustainability consultancy
Density versus World Population
15
■This map demonstrates
how large the single
city would be if the
entire world’s
population lived in it,
based on current city
densities from around
the world
The world’s leading sustainability consultancy
What can we do to reduce the “cost” of Sprawl?
16
■ Address the Causes of Sprawl
■ New Construction encroaches on natural spaces and farmland
■ Urban businesses and neighborhoods struggle to stay afloat
■ Better zoning/development plans that do not facilitate
Sprawl
■ Prices encourage Sprawl
■ Prices have a profound impact on the decisions of firms and
individuals, pulling them towards the fringes of our cities
■ Where to build new developments
■ Where to buy houses
■ Where to move or open a business
■ Cities, Citizens, Businesses, Governments, and the Economy will
continue to suffer the cost of Sprawl
The world’s leading sustainability consultancy
What can we do to reduce the “cost” of Sprawl?
17
■ Changes in Public Policy
■ Shift prices to encourage development in established areas
■ Protect natural areas and agricultural land from further and future incursions
of Sprawl
■ Help address Sprawl and also boost the economy and balance government
finance
■ Sustainable and Smart Growth
■ Reinvest in neglected communities and provide more housing opportunities
■ Rehabilitate abandoned properties
■ Encourage new development or redevelopment in already built up areas
■ Create and nurture thriving, mixed-use centers of activity
■ Support growth management strategies
■ Craft transportation policies that complement smarter growth
The world’s leading sustainability consultancy
Smart Growth cycle for Sustainable Cities
18
Smart
Growth
Enhance
Quality of Life
Promote
Economic
Development
Create Livable
Communities
Promote
Alternative
Transportation
Create a
range of
Housing
Opportunities
Preserve
Open Space,
Natural
Resources
and
Environment
The world’s leading sustainability consultancy
Plans for a Smart Growth America
19
http://www.smartgrowthamerica.org/images/boulder-poster.jpg
The world’s leading sustainability consultancy
Questions and Comment time!
20

Urban Sprawl

  • 1.
    “Insert” then choose“Picture” – select your picture. Right click your picture and “Send to back”. The world’s leading sustainability consultancy Urban Sprawl By: Bill Burkey The world’s leading sustainability consultancy
  • 2.
    The world’s leadingsustainability consultancy My inspiration for this topic… 2
  • 3.
    The world’s leadingsustainability consultancy Contents What is Urban Sprawl? ■ Decentralization ■ Suburbanization Pros and Cons of Urban Sprawl ■ The “American Dream” ■ Air Pollution Maps of Sprawl ■ Examples of Sprawling Cities ■ Commute times What can we do to help with Urban Sprawl ■ Address Causes ■ Changes in Public Policy
  • 4.
    The world’s leadingsustainability consultancy What is Urban Sprawl? 4 Urban Sprawl is a situation where large stores, groups of houses, etc. are built in an area around a city that formerly had a few people living in it ■ Spreading of a city or its suburbs ■ Centered around auto-oriented, low-density development ■ Metropolitan Decentralization/Suburbanization ■ Impacts quality of life from large cities to small towns
  • 5.
    The world’s leadingsustainability consultancy What is Urban Sprawl? 5 ■ What is Decentralization? ■ Spread of population without a well-defined center ■ What is Suburbanization? ■ Occurs over time ■ Large percentage of a metropolitan area’s residential and/or business activity takes place outside of its central location ■ In 1950, 57% of the population and 70% of the employment in the U.S. took place in central cities ■ By the mid-1990s, these percentages had respectively declined to around 35 and 45%
  • 6.
    The world’s leadingsustainability consultancy Pros of Urban Sprawl 6 ■Less expensive land ■ “The American Dream” ■ Lower rent apartments ■ Lifestyle preference ■Better school system ■ Higher test scores ■ Lower dropout rates ■Crime rates generally lower ■ 37% higher in urban vs. suburban ■ 74% higher than in rural areas
  • 7.
    The world’s leadingsustainability consultancy Cons of Urban Sprawl 7 ■Automobile dependent/requirement ■ Increased traffic congestion and commutes ■ Higher air pollution ■ Increased levels of Auto crashes ■ Credited in part with obesity ■ Health issues ■Loss of Undeveloped Land ■ Affects water supply ■ Businesses, Schools, Services, etc. spread out ■ Roads/buildings destroy farmland and wildlife habitat
  • 8.
    The world’s leadingsustainability consultancy Urban Sprawl in Houston from 1984 - 2012 8
  • 9.
    The world’s leadingsustainability consultancy Urban Sprawl in Atlanta from 1985 - 2012 9
  • 10.
    The world’s leadingsustainability consultancy Lowest and Highest Sprawling cities in the U.S. 10 ■ The "Sprawl Index Scores" is derived from 22 factors that measure four different metro-development features: diffusion or concentration of housing and population; segregation or integration of homes vis-à-vis activities of daily life; lack or presence of strong economic and social centers; and connectedness or disconnectedness of street networks. Lower scores represent greater sprawl. The average score for the 83 metros included in the study was 100.
  • 11.
    The world’s leadingsustainability consultancy Average Commute time in the United States 11
  • 12.
    The world’s leadingsustainability consultancy Suburban Sprawl – Not as cheap as you think! 12
  • 13.
    The world’s leadingsustainability consultancy Not just an issue in the US 13 ■ Suburbs are growing 160% faster than city centers ■ Half of urban residents live in the suburbs ■ 17 of the more than 40 new developments underway/planned in Edmonton, net costs have been projected to exceed revenues by nearly $4 billion over 60 years ■ The City of London, Ontario found that over a 50-year period sprawling growth would entail capital costs $2.7 billion higher, and operating costs about $1.7 billion higher, than for a compact growth scenario ■ Governments in Canada spend almost $29 billion on roads every year ■ More than they spend on transit, rail, air, marine, etc. combined ■ In Calgary, adopting a denser growth pattern that used 25% less land, it could save $11 billion in capital costs alone
  • 14.
    The world’s leadingsustainability consultancy Gasoline used per person (per year) 14
  • 15.
    The world’s leadingsustainability consultancy Density versus World Population 15 ■This map demonstrates how large the single city would be if the entire world’s population lived in it, based on current city densities from around the world
  • 16.
    The world’s leadingsustainability consultancy What can we do to reduce the “cost” of Sprawl? 16 ■ Address the Causes of Sprawl ■ New Construction encroaches on natural spaces and farmland ■ Urban businesses and neighborhoods struggle to stay afloat ■ Better zoning/development plans that do not facilitate Sprawl ■ Prices encourage Sprawl ■ Prices have a profound impact on the decisions of firms and individuals, pulling them towards the fringes of our cities ■ Where to build new developments ■ Where to buy houses ■ Where to move or open a business ■ Cities, Citizens, Businesses, Governments, and the Economy will continue to suffer the cost of Sprawl
  • 17.
    The world’s leadingsustainability consultancy What can we do to reduce the “cost” of Sprawl? 17 ■ Changes in Public Policy ■ Shift prices to encourage development in established areas ■ Protect natural areas and agricultural land from further and future incursions of Sprawl ■ Help address Sprawl and also boost the economy and balance government finance ■ Sustainable and Smart Growth ■ Reinvest in neglected communities and provide more housing opportunities ■ Rehabilitate abandoned properties ■ Encourage new development or redevelopment in already built up areas ■ Create and nurture thriving, mixed-use centers of activity ■ Support growth management strategies ■ Craft transportation policies that complement smarter growth
  • 18.
    The world’s leadingsustainability consultancy Smart Growth cycle for Sustainable Cities 18 Smart Growth Enhance Quality of Life Promote Economic Development Create Livable Communities Promote Alternative Transportation Create a range of Housing Opportunities Preserve Open Space, Natural Resources and Environment
  • 19.
    The world’s leadingsustainability consultancy Plans for a Smart Growth America 19 http://www.smartgrowthamerica.org/images/boulder-poster.jpg
  • 20.
    The world’s leadingsustainability consultancy Questions and Comment time! 20

Editor's Notes

  • #7 House with fenceTwo car garageNational Center for Policy Analysis (NCPA), 73 percent of suburban New Jersey students scored "at or above" the basic reading level, whereas only 27 percent of urban students in New Jersey achieved the same goal.
  • #8 Lower driver and passenger fatality rates are seen in dense cities as opposed to sprawl-friendly counterparts Results in more cases of asthma and other respiratory ailments. Linked to Climate Change?Mobile sources account for 30% of emissions of Nitrogen Oxide and 30% of Hydrocarbon emissionsMetro Atlanta accounts for 58% Nitrogen Oxide and 47% Hydrocarbon
  • #12 On average, Americans spent 23.7 minutes getting to work. Average American spends the equivalent of eight 55-hour work weeks behind the steering wheel of a car annuallyMore than three-quarters of them drove alone to their jobs1 in 10 carpooled 5 percent took public transportation.
  • #13 Sprawl dwellers pay only half the cost of Roads – hiding the real cost of the suburbsSuburban residence drive 3x as much as urban drivers 81 % of Canadians live in Cities – half of those live in the suburbsIf urban core growth were encouraged, savings could be hadCities/Taxpayers could save millions w/ higher density development
  • #15 80 Gigajoule = 607 US auto Gas gallons = 506 = Gallon UK Gas60 = 455 = 37940 = 304 = 25220 = 152 = 126----------------------1100 sqm = 11,840 sq ft800= 8,611200 = 2153
  • #16 If the world’s 7 Billion people lived in one city, this is how large that city would be if it were as dense as…
  • #17 Northeast Ohio has lost 7% of its population since 1970 (4.1 to 3.8 Million ppl). Instead of a shrinking footprint, the region has developed 250 sq miles, a 21% expansion.15,000 + abandoned houses in CLE, 5,000 abandoned houses and 20,000 vacant lots in Youngstown
  • #20 Too much density? - Not every place is an activity centerSmart Growth – land use around mass transit – Maximize travel options – 20 minute neighborhoodsReduce Energy consumption – Alternate types of energyIncrease Diversity of housing choices at various affordability levels