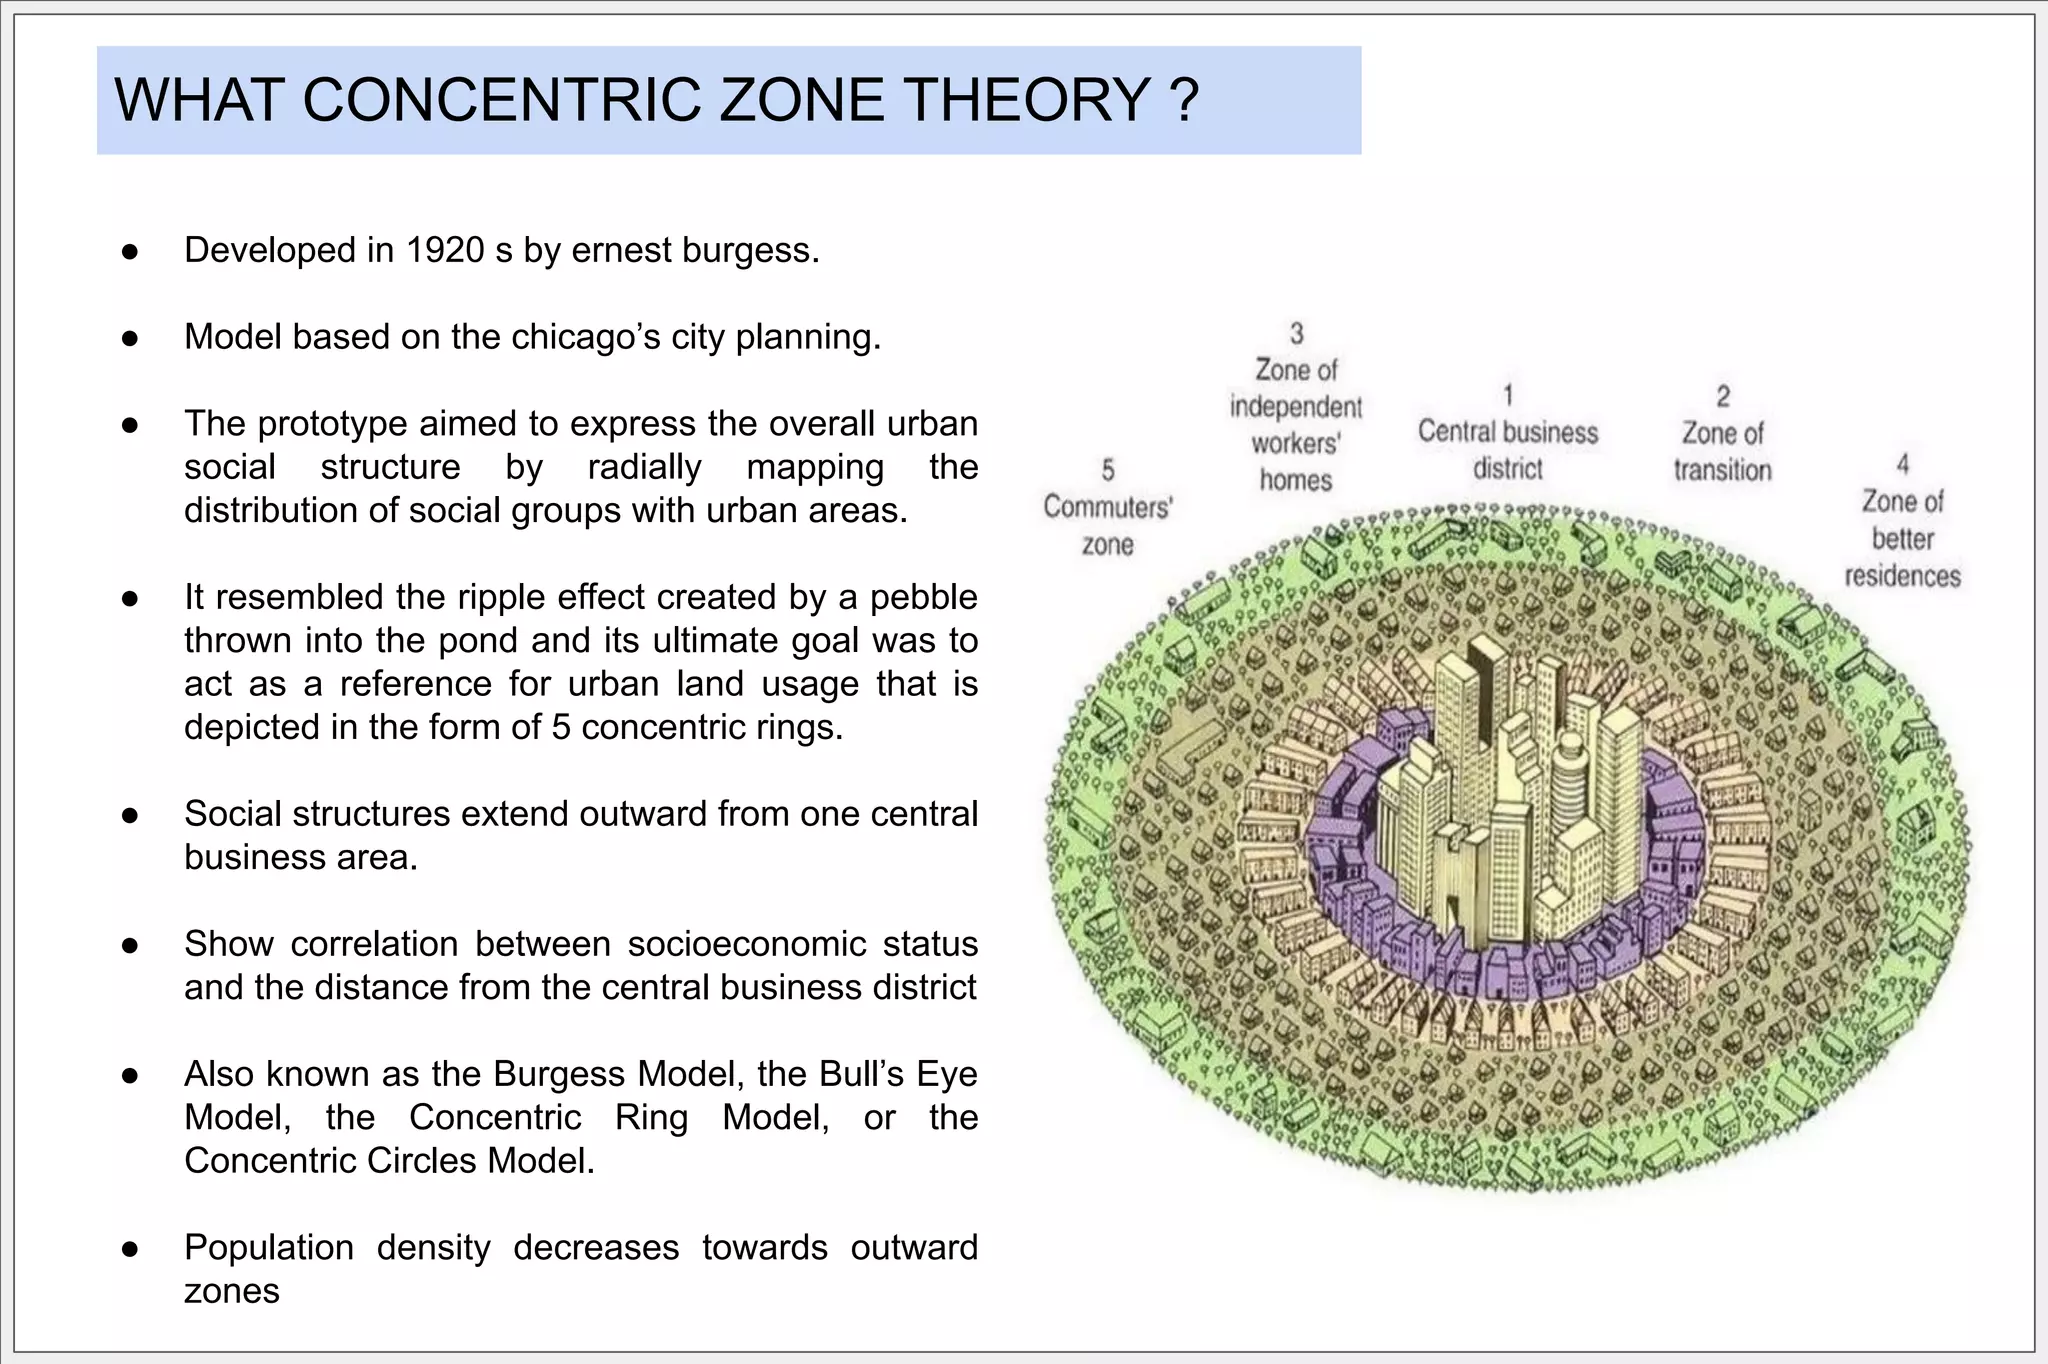
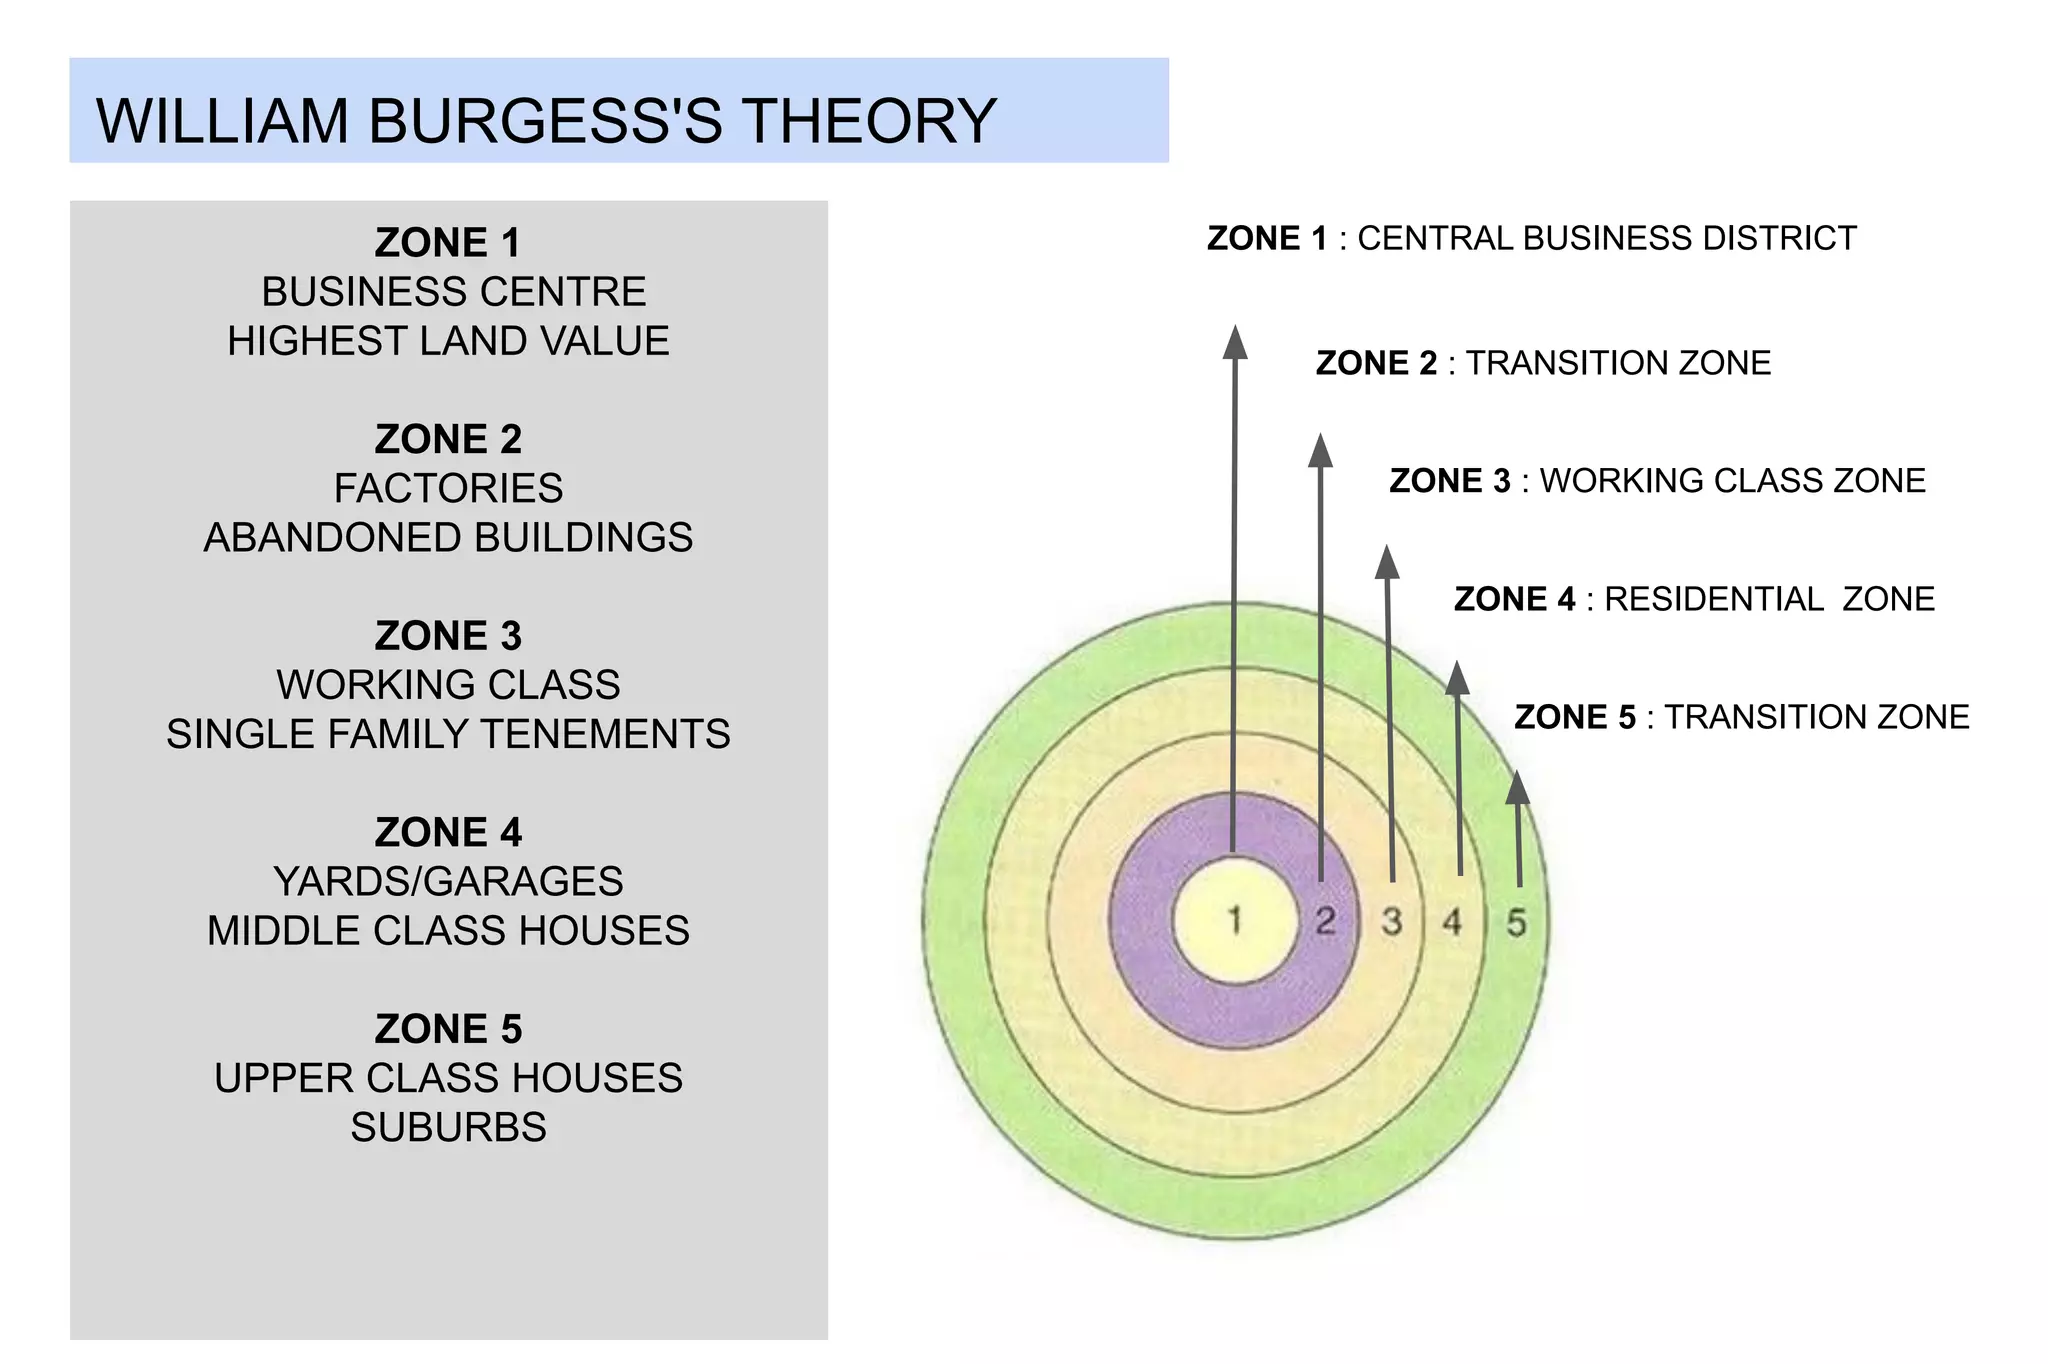
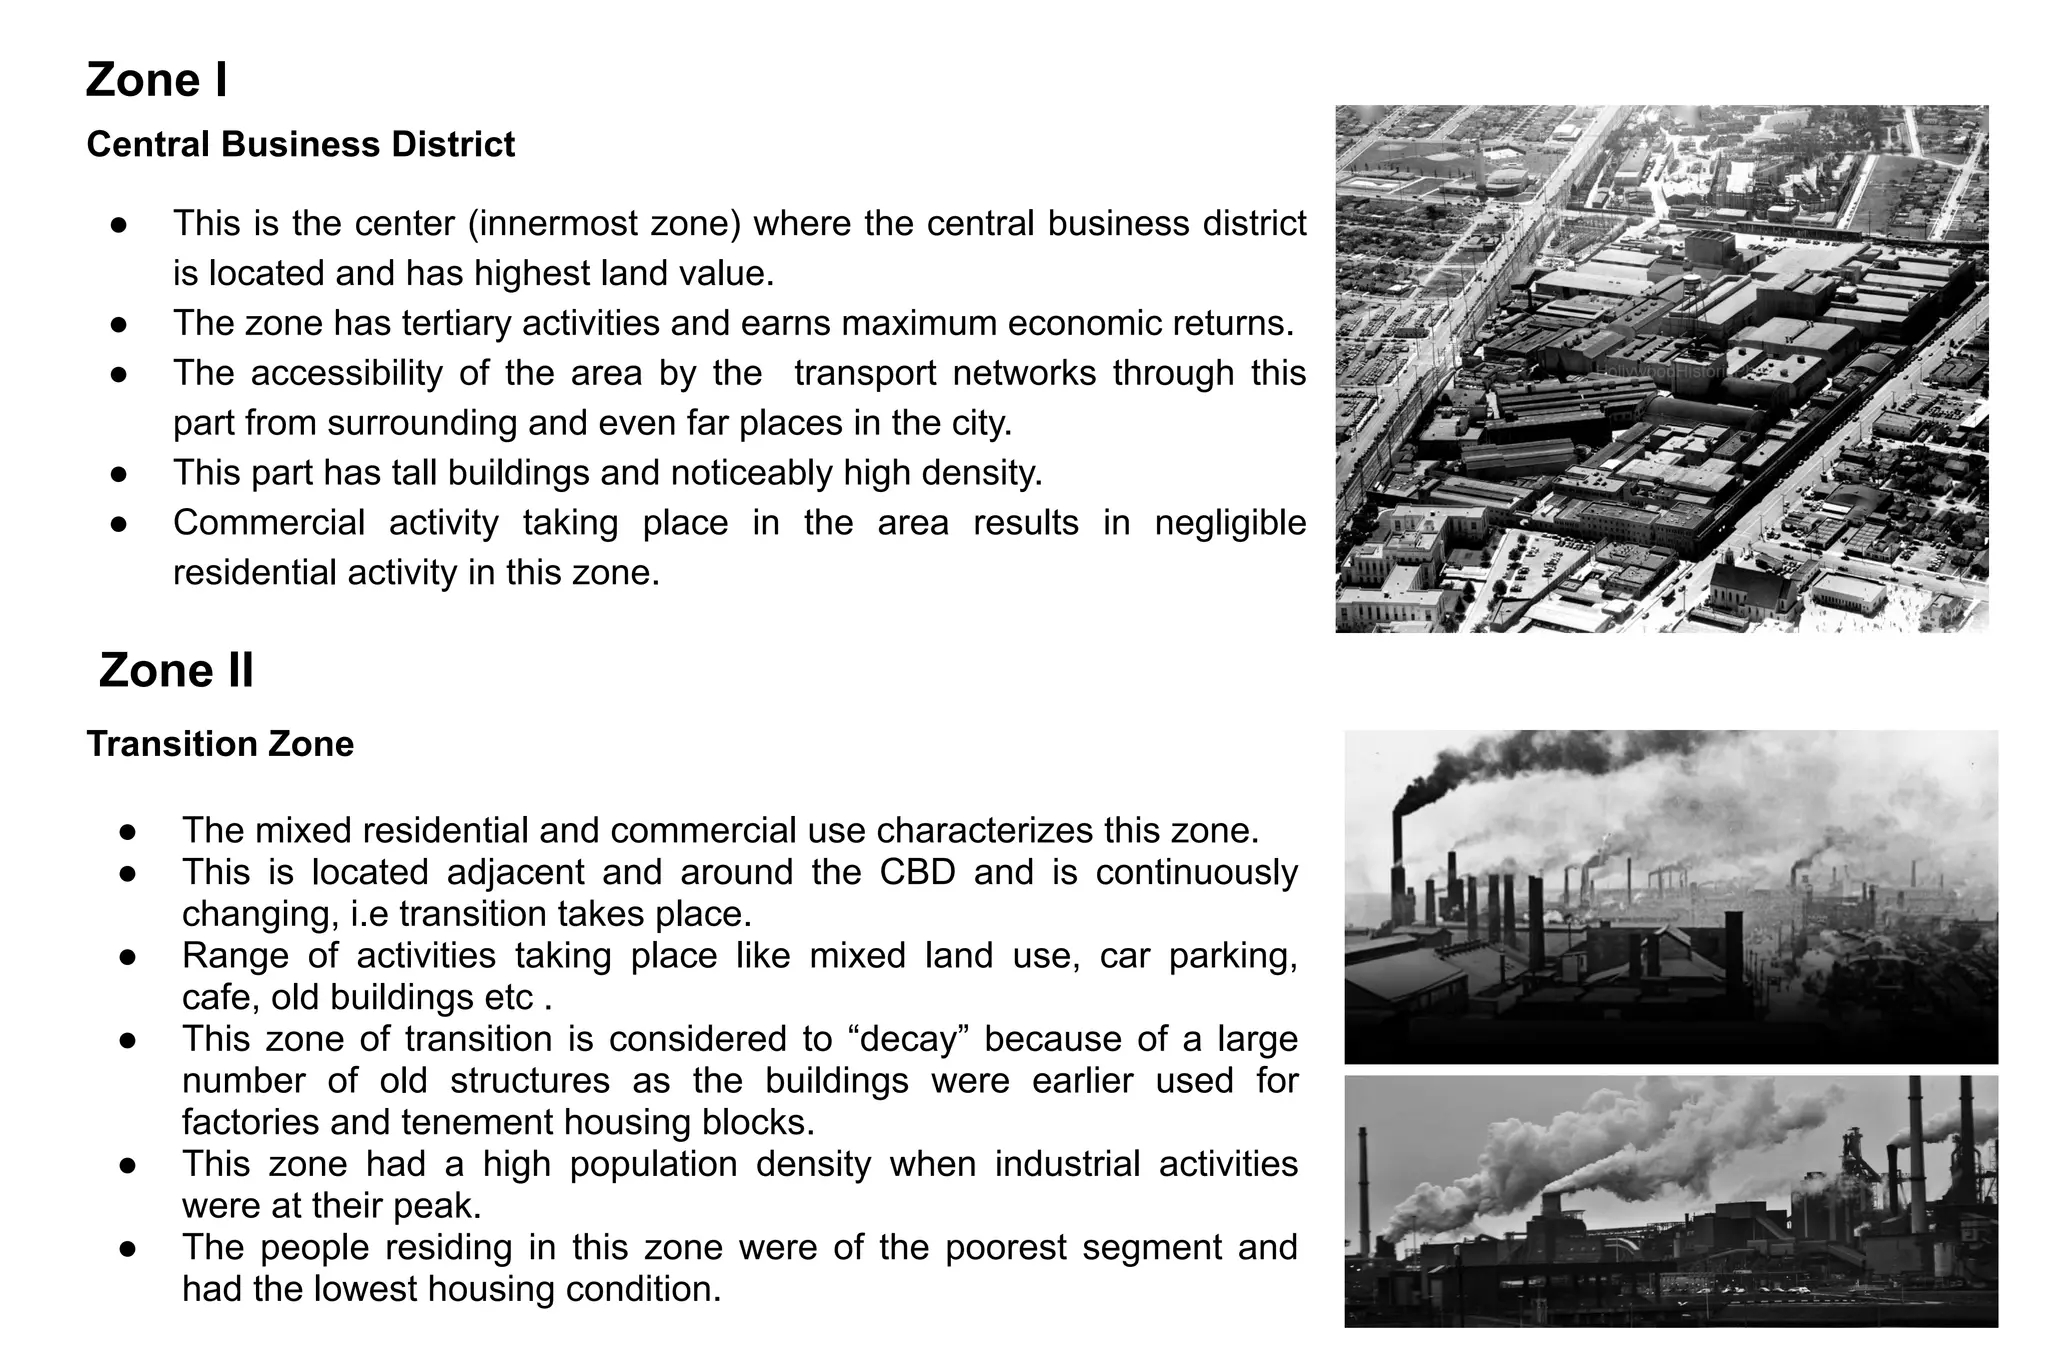
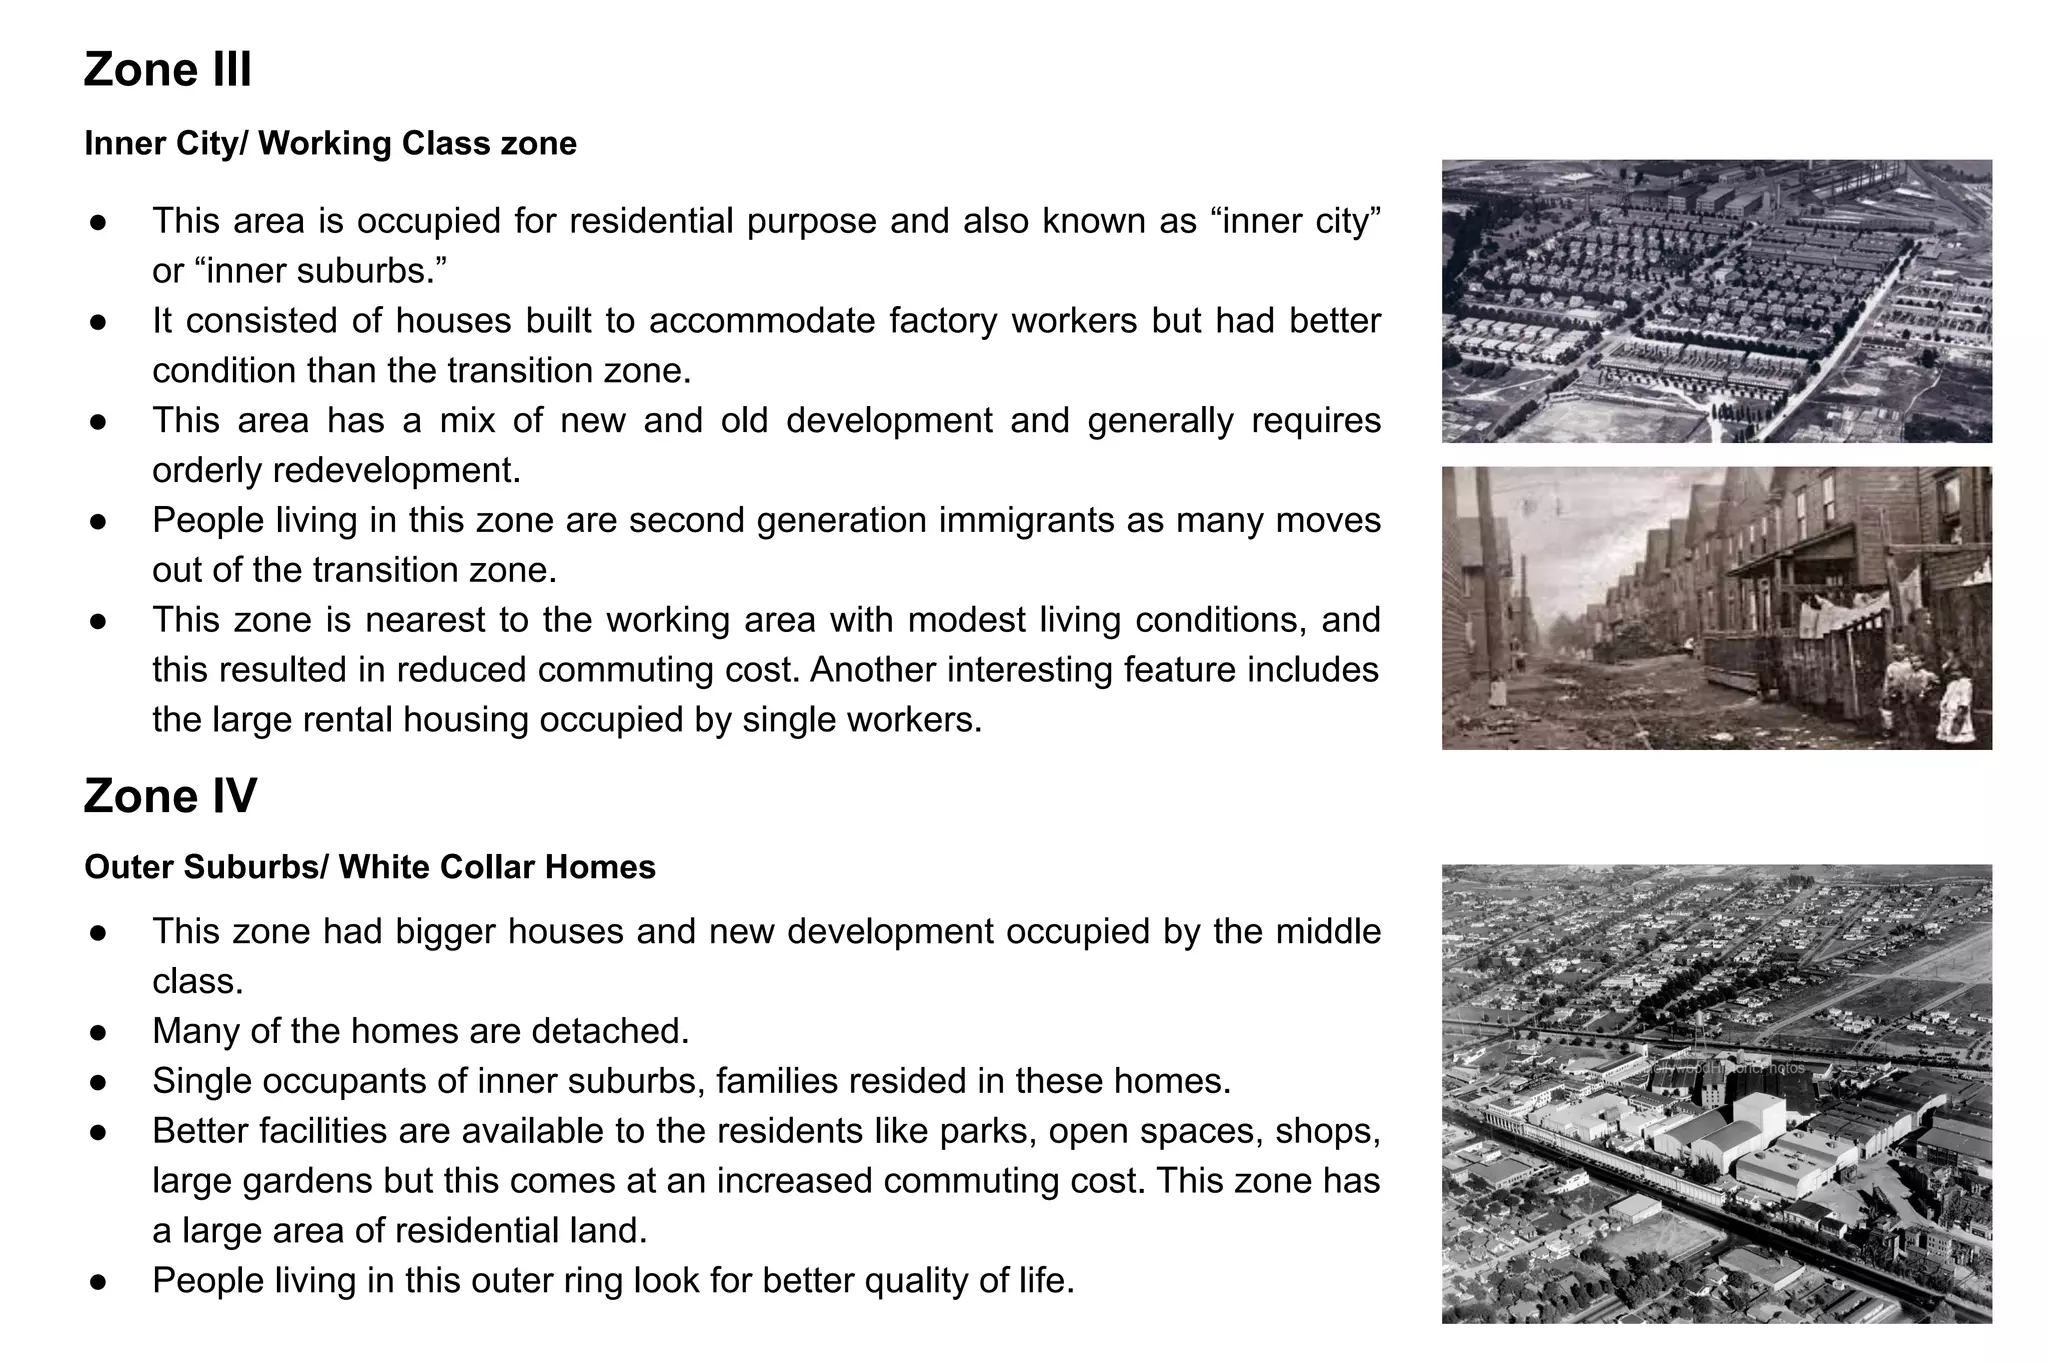
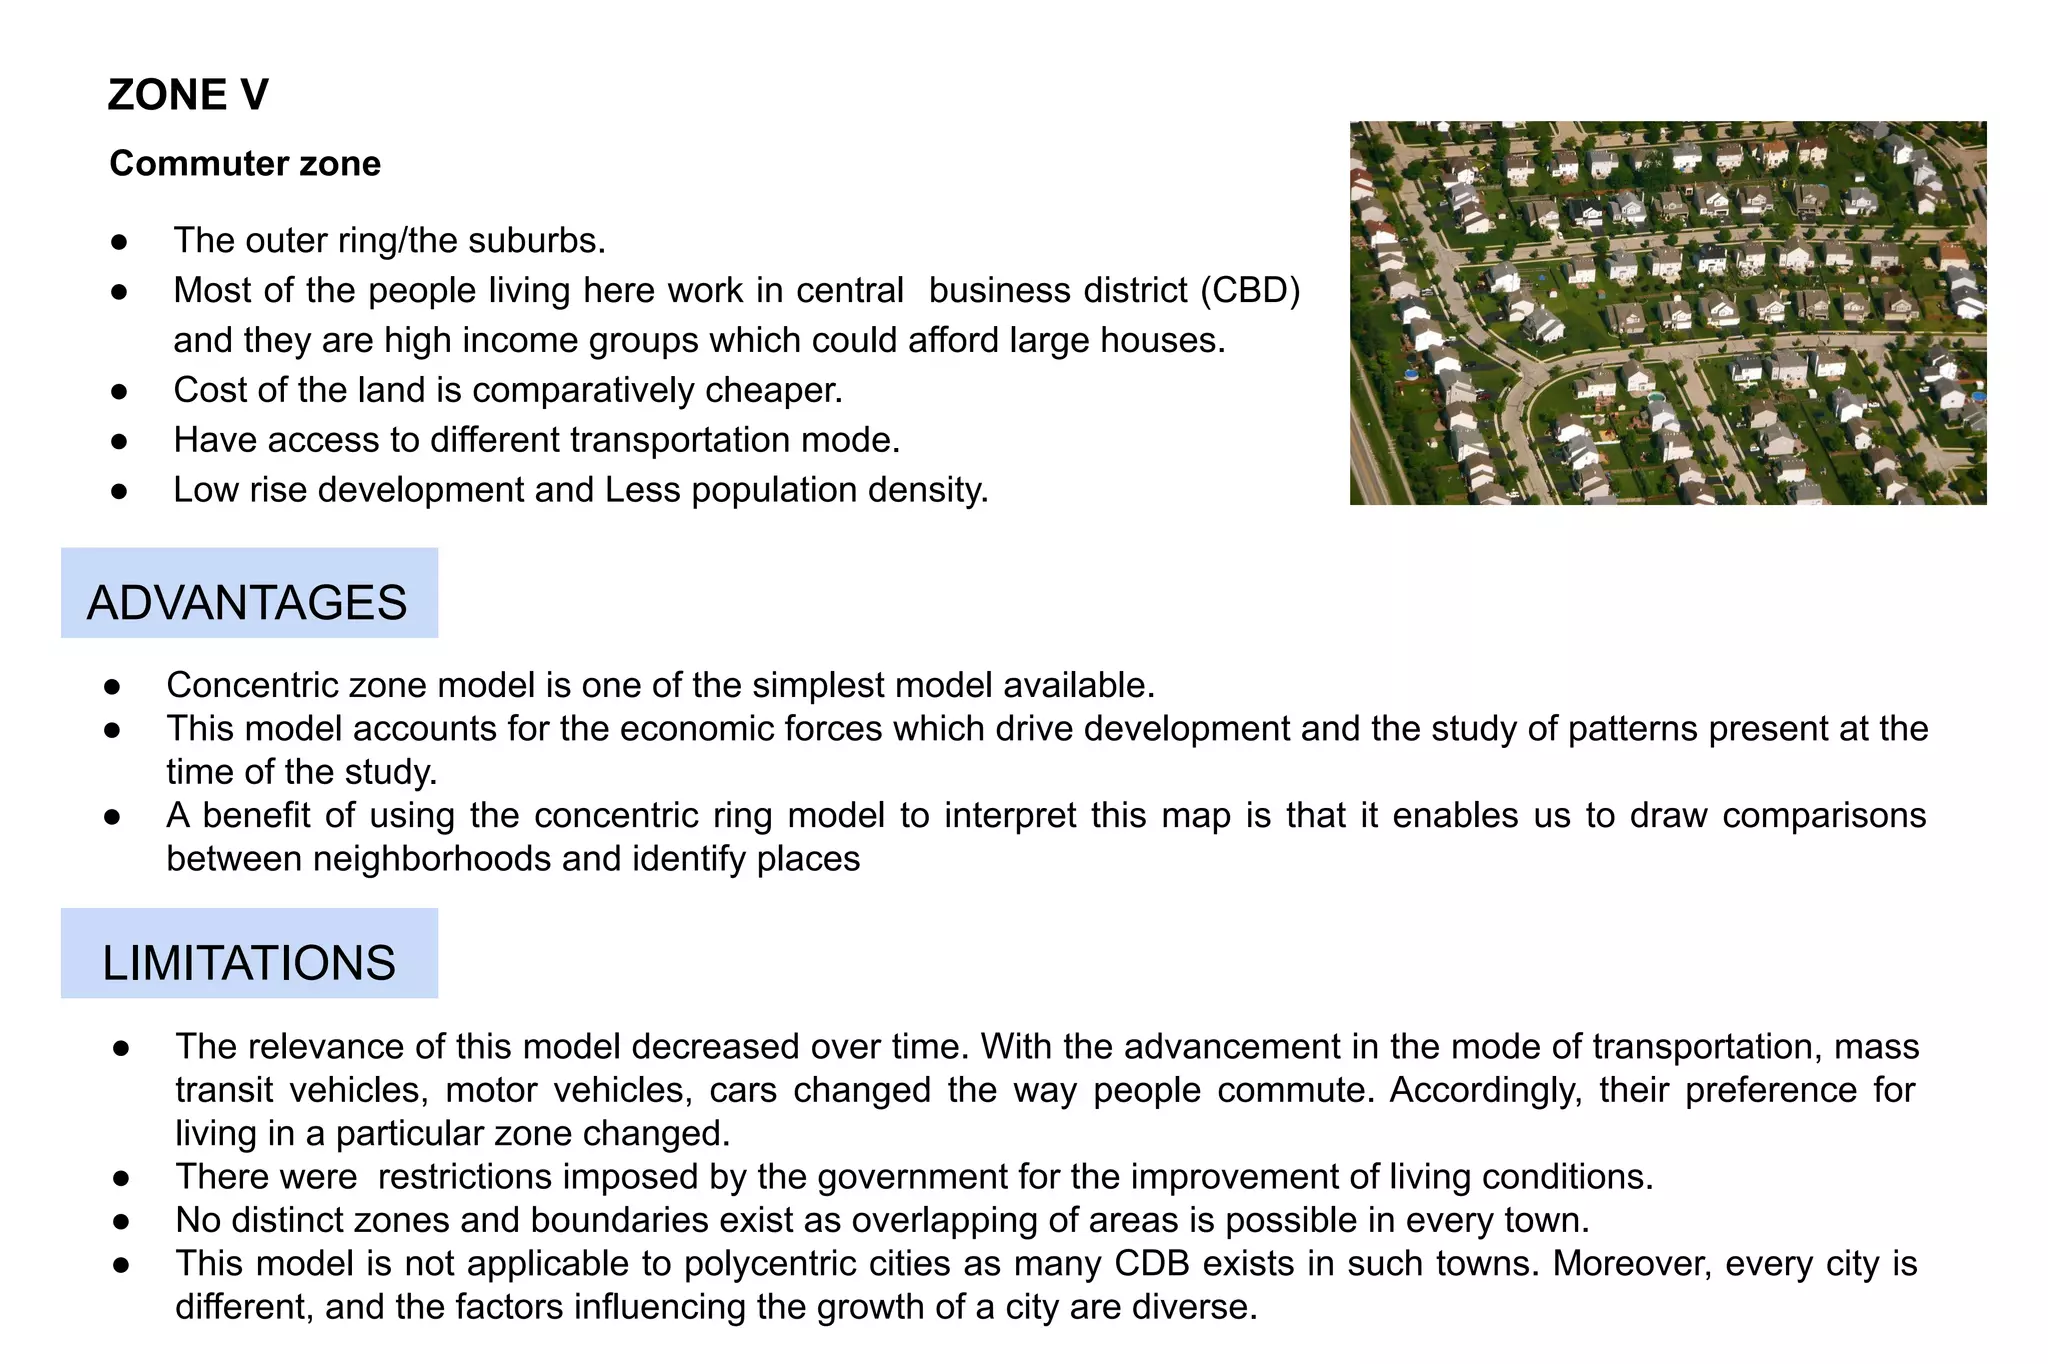
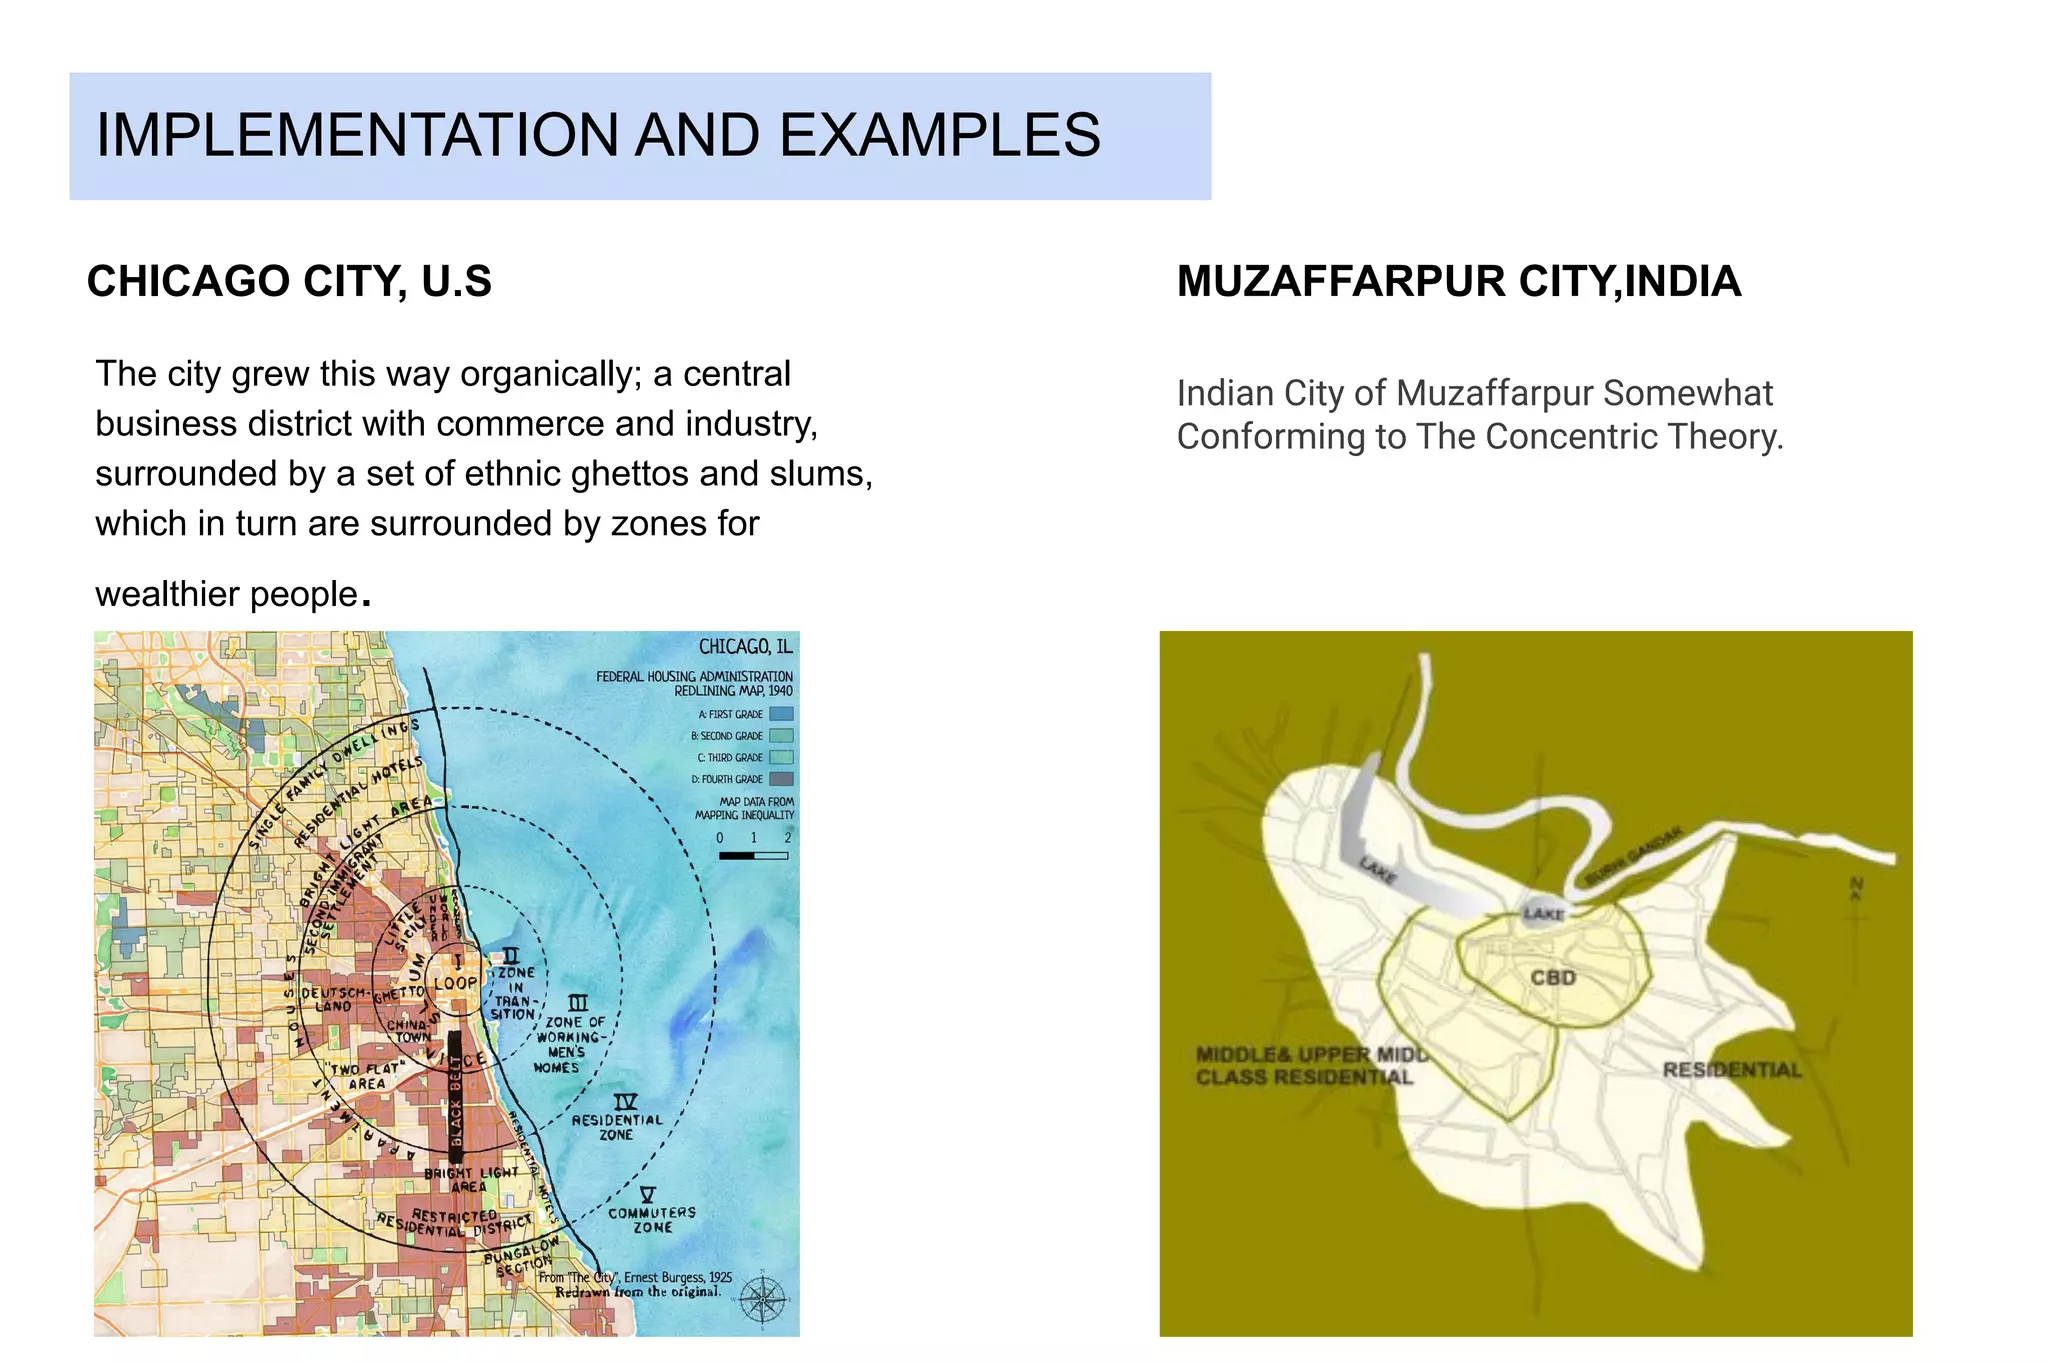
2. ● Developed in 1920 s by ernest burgess.
● Model based on the chicago’s city planning.
● The prototype aimed to express the overall urban
social structure by radially mapping the
distribution of social groups with urban areas.
● It resembled the ripple effect created by a pebble
thrown into the pond and its ultimate goal was to
act as a reference for urban land usage that is
depicted in the form of 5 concentric rings.
● Social structures extend outward from one central
business area.
● Show correlation between socioeconomic status
and the distance from the central business district
● Also known as the Burgess Model, the Bull’s Eye
Model, the Concentric Ring Model, or the
Concentric Circles Model.
● Population density decreases towards outward
zones
WHAT CONCENTRIC ZONE THEORY ?
3. WILLIAM BURGESS'S THEORY
ZONE 1
BUSINESS CENTRE
HIGHEST LAND VALUE
ZONE 2
FACTORIES
ABANDONED BUILDINGS
ZONE 3
WORKING CLASS
SINGLE FAMILY TENEMENTS
ZONE 4
YARDS/GARAGES
MIDDLE CLASS HOUSES
ZONE 5
UPPER CLASS HOUSES
SUBURBS
ZONE 1 : CENTRAL BUSINESS DISTRICT
ZONE 2 : TRANSITION ZONE
ZONE 3 : WORKING CLASS ZONE
ZONE 4 : RESIDENTIAL ZONE
ZONE 5 : TRANSITION ZONE
4. ● The mixed residential and commercial use characterizes this zone.
● This is located adjacent and around the CBD and is continuously
changing, i.e transition takes place.
● Range of activities taking place like mixed land use, car parking,
cafe, old buildings etc .
● This zone of transition is considered to “decay” because of a large
number of old structures as the buildings were earlier used for
factories and tenement housing blocks.
● This zone had a high population density when industrial activities
were at their peak.
● The people residing in this zone were of the poorest segment and
had the lowest housing condition.
● This is the center (innermost zone) where the central business district
is located and has highest land value.
● The zone has tertiary activities and earns maximum economic returns.
● The accessibility of the area by the transport networks through this
part from surrounding and even far places in the city.
● This part has tall buildings and noticeably high density.
● Commercial activity taking place in the area results in negligible
residential activity in this zone.
Zone I
Central Business District
Zone II
Transition Zone
5. Zone III
● This zone had bigger houses and new development occupied by the middle
class.
● Many of the homes are detached.
● Single occupants of inner suburbs, families resided in these homes.
● Better facilities are available to the residents like parks, open spaces, shops,
large gardens but this comes at an increased commuting cost. This zone has
a large area of residential land.
● People living in this outer ring look for better quality of life.
● This area is occupied for residential purpose and also known as “inner city”
or “inner suburbs.”
● It consisted of houses built to accommodate factory workers but had better
condition than the transition zone.
● This area has a mix of new and old development and generally requires
orderly redevelopment.
● People living in this zone are second generation immigrants as many moves
out of the transition zone.
● This zone is nearest to the working area with modest living conditions, and
this resulted in reduced commuting cost. Another interesting feature includes
the large rental housing occupied by single workers.
Zone IV
Inner City/ Working Class zone
Outer Suburbs/ White Collar Homes
6. ZONE V
● The outer ring/the suburbs.
● Most of the people living here work in central business district (CBD)
and they are high income groups which could afford large houses.
● Cost of the land is comparatively cheaper.
● Have access to different transportation mode.
● Low rise development and Less population density.
LIMITATIONS
● Concentric zone model is one of the simplest model available.
● This model accounts for the economic forces which drive development and the study of patterns present at the
time of the study.
● A benefit of using the concentric ring model to interpret this map is that it enables us to draw comparisons
between neighborhoods and identify places
ADVANTAGES
● The relevance of this model decreased over time. With the advancement in the mode of transportation, mass
transit vehicles, motor vehicles, cars changed the way people commute. Accordingly, their preference for
living in a particular zone changed.
● There were restrictions imposed by the government for the improvement of living conditions.
● No distinct zones and boundaries exist as overlapping of areas is possible in every town.
● This model is not applicable to polycentric cities as many CDB exists in such towns. Moreover, every city is
different, and the factors influencing the growth of a city are diverse.
Commuter zone
7. IMPLEMENTATION AND EXAMPLES
The city grew this way organically; a central
business district with commerce and industry,
surrounded by a set of ethnic ghettos and slums,
which in turn are surrounded by zones for
wealthier people.
CHICAGO CITY, U.S MUZAFFARPUR CITY,INDIA
Indian City of Muzaffarpur Somewhat
Conforming to The Concentric Theory.
8. GREEN ZONE ARE FRESHLY BUILT STRUCTURES
WHICH CONSTITUTED THE OUTER-LYING MIDDLE
CLASS NEIGHBOURHOOD
BLUE ZONE CONSIST OF OLDER STRUCTURES
AND CONSTITUTED THE POORER, WORKING
CLASS AND IMMIGRANT GROUP.
Though the city’s population peaked in the 1930s,
new homes continued to be built in successive
rings up until the 1970s when it appears that the
orange ring on the map pushed beyond the city
limits.
Over this period, for variety of reasons not
adequately explained by concentric zone theory, the
areas seen in green were largely abandoned by the
middle class and are now some of the more
impoverished parts of the city – Lawndale,
Humboldt Park, Garfield Park, Englewood.
Since the 1980s, real estate development in Chicago
has occurred within already established neighborhoods,
and most new structures built in city of Chicago over
the last 30 years are located downtown in the Loop,
Near North Side, South Loop or West Loop areas.