Download as PDF, PPTX

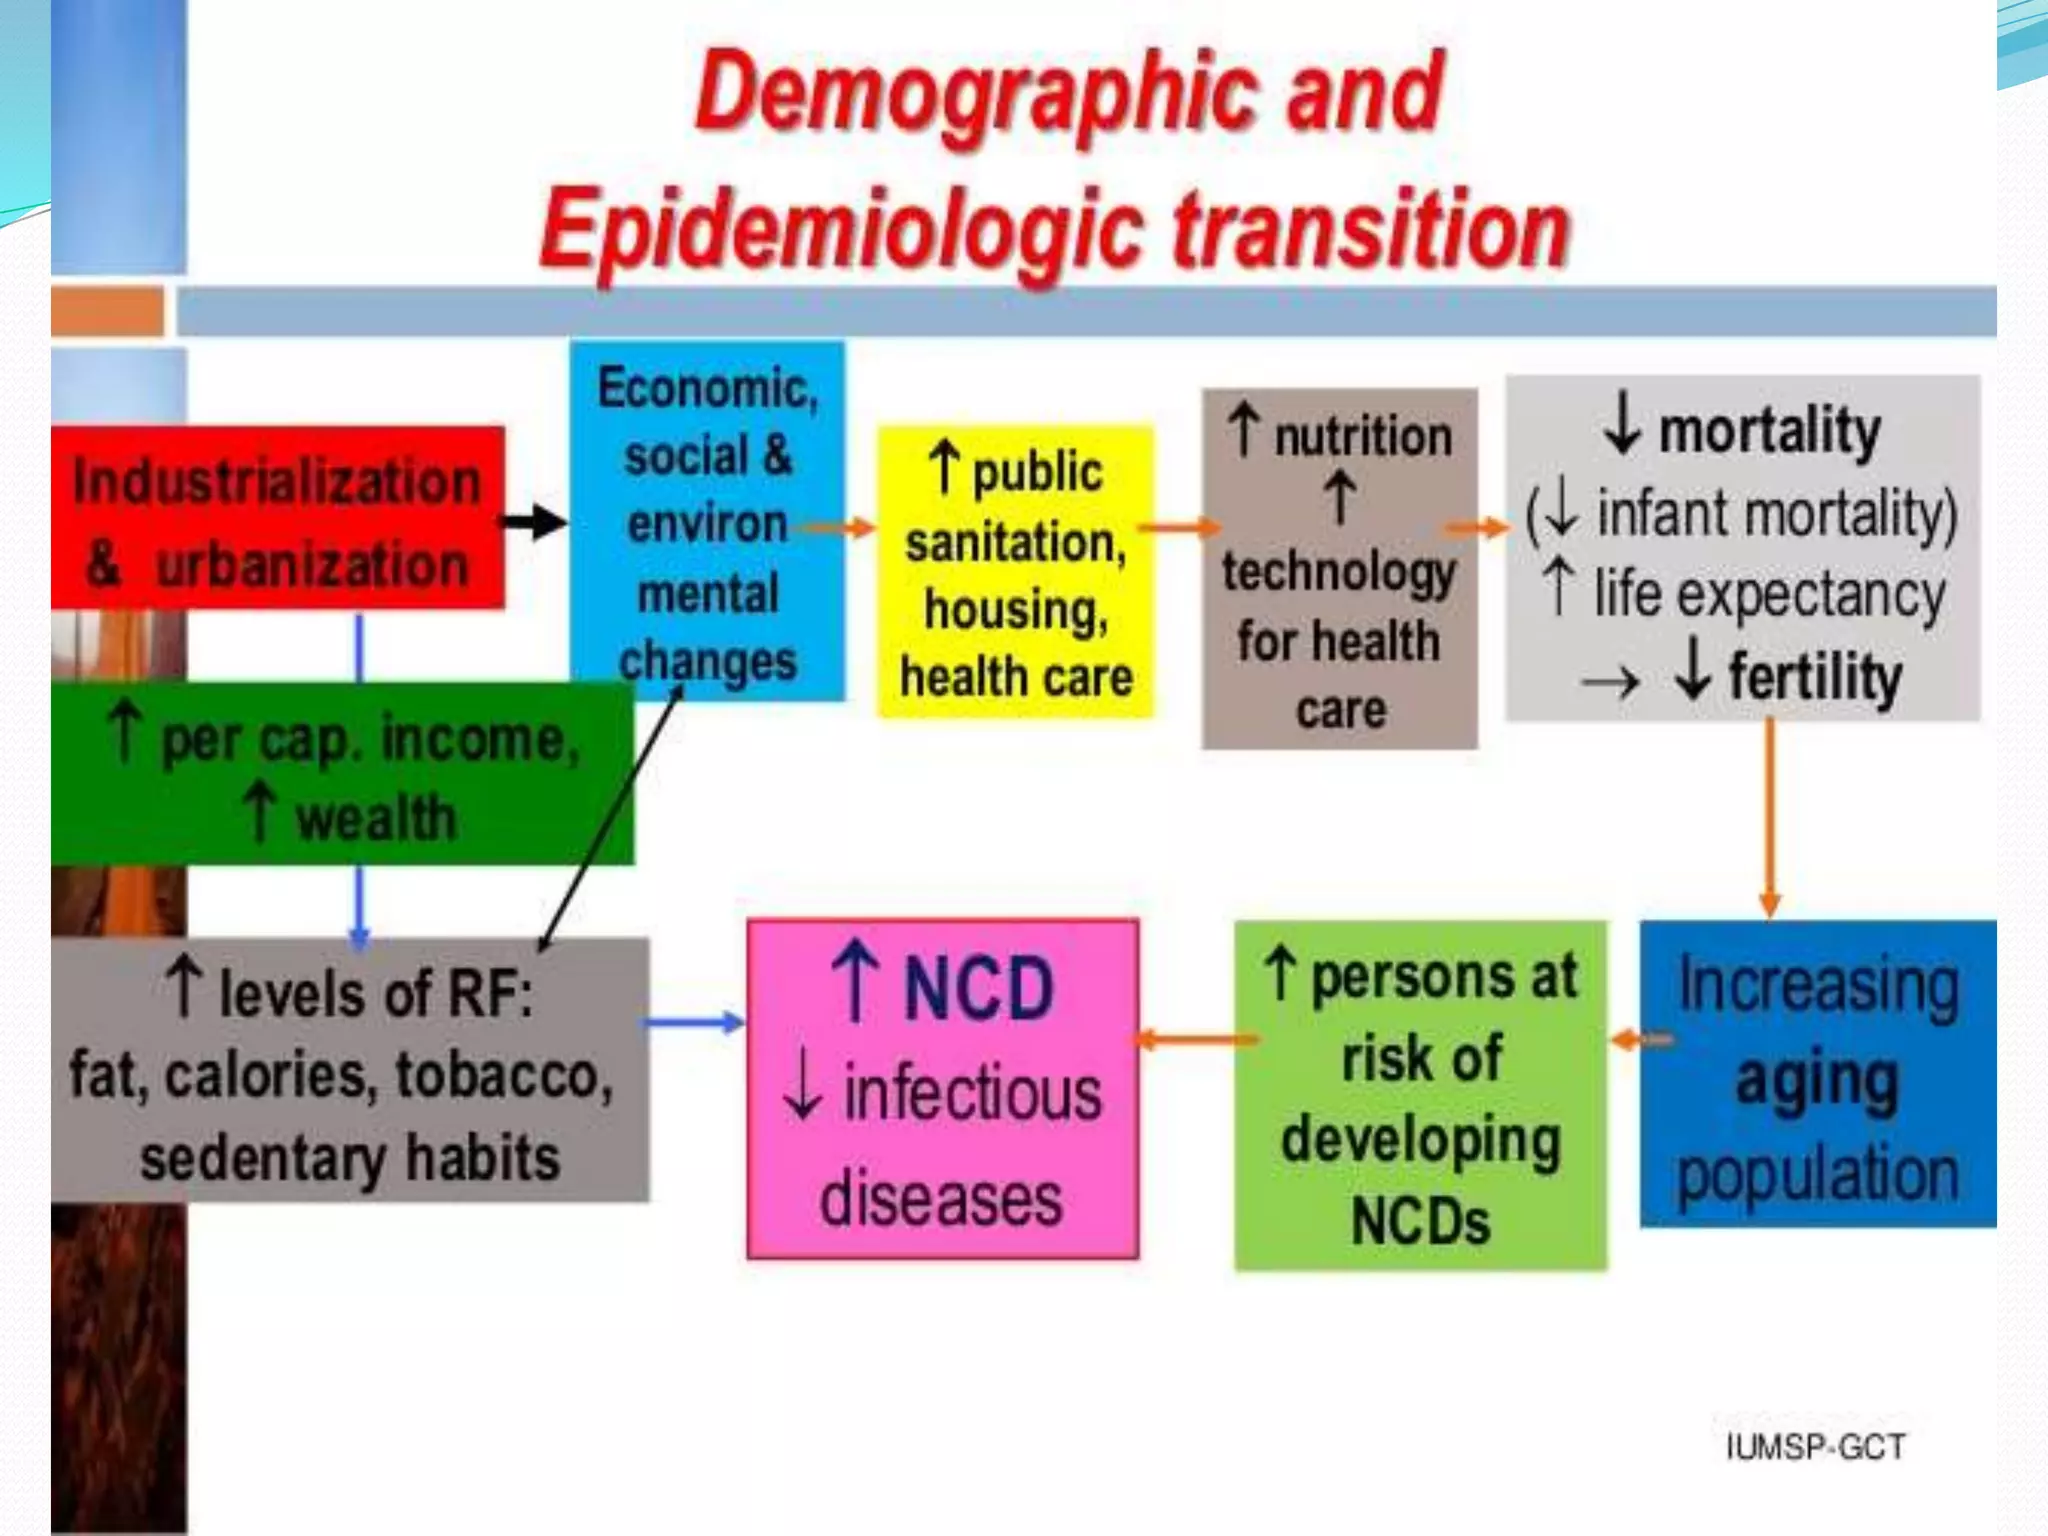
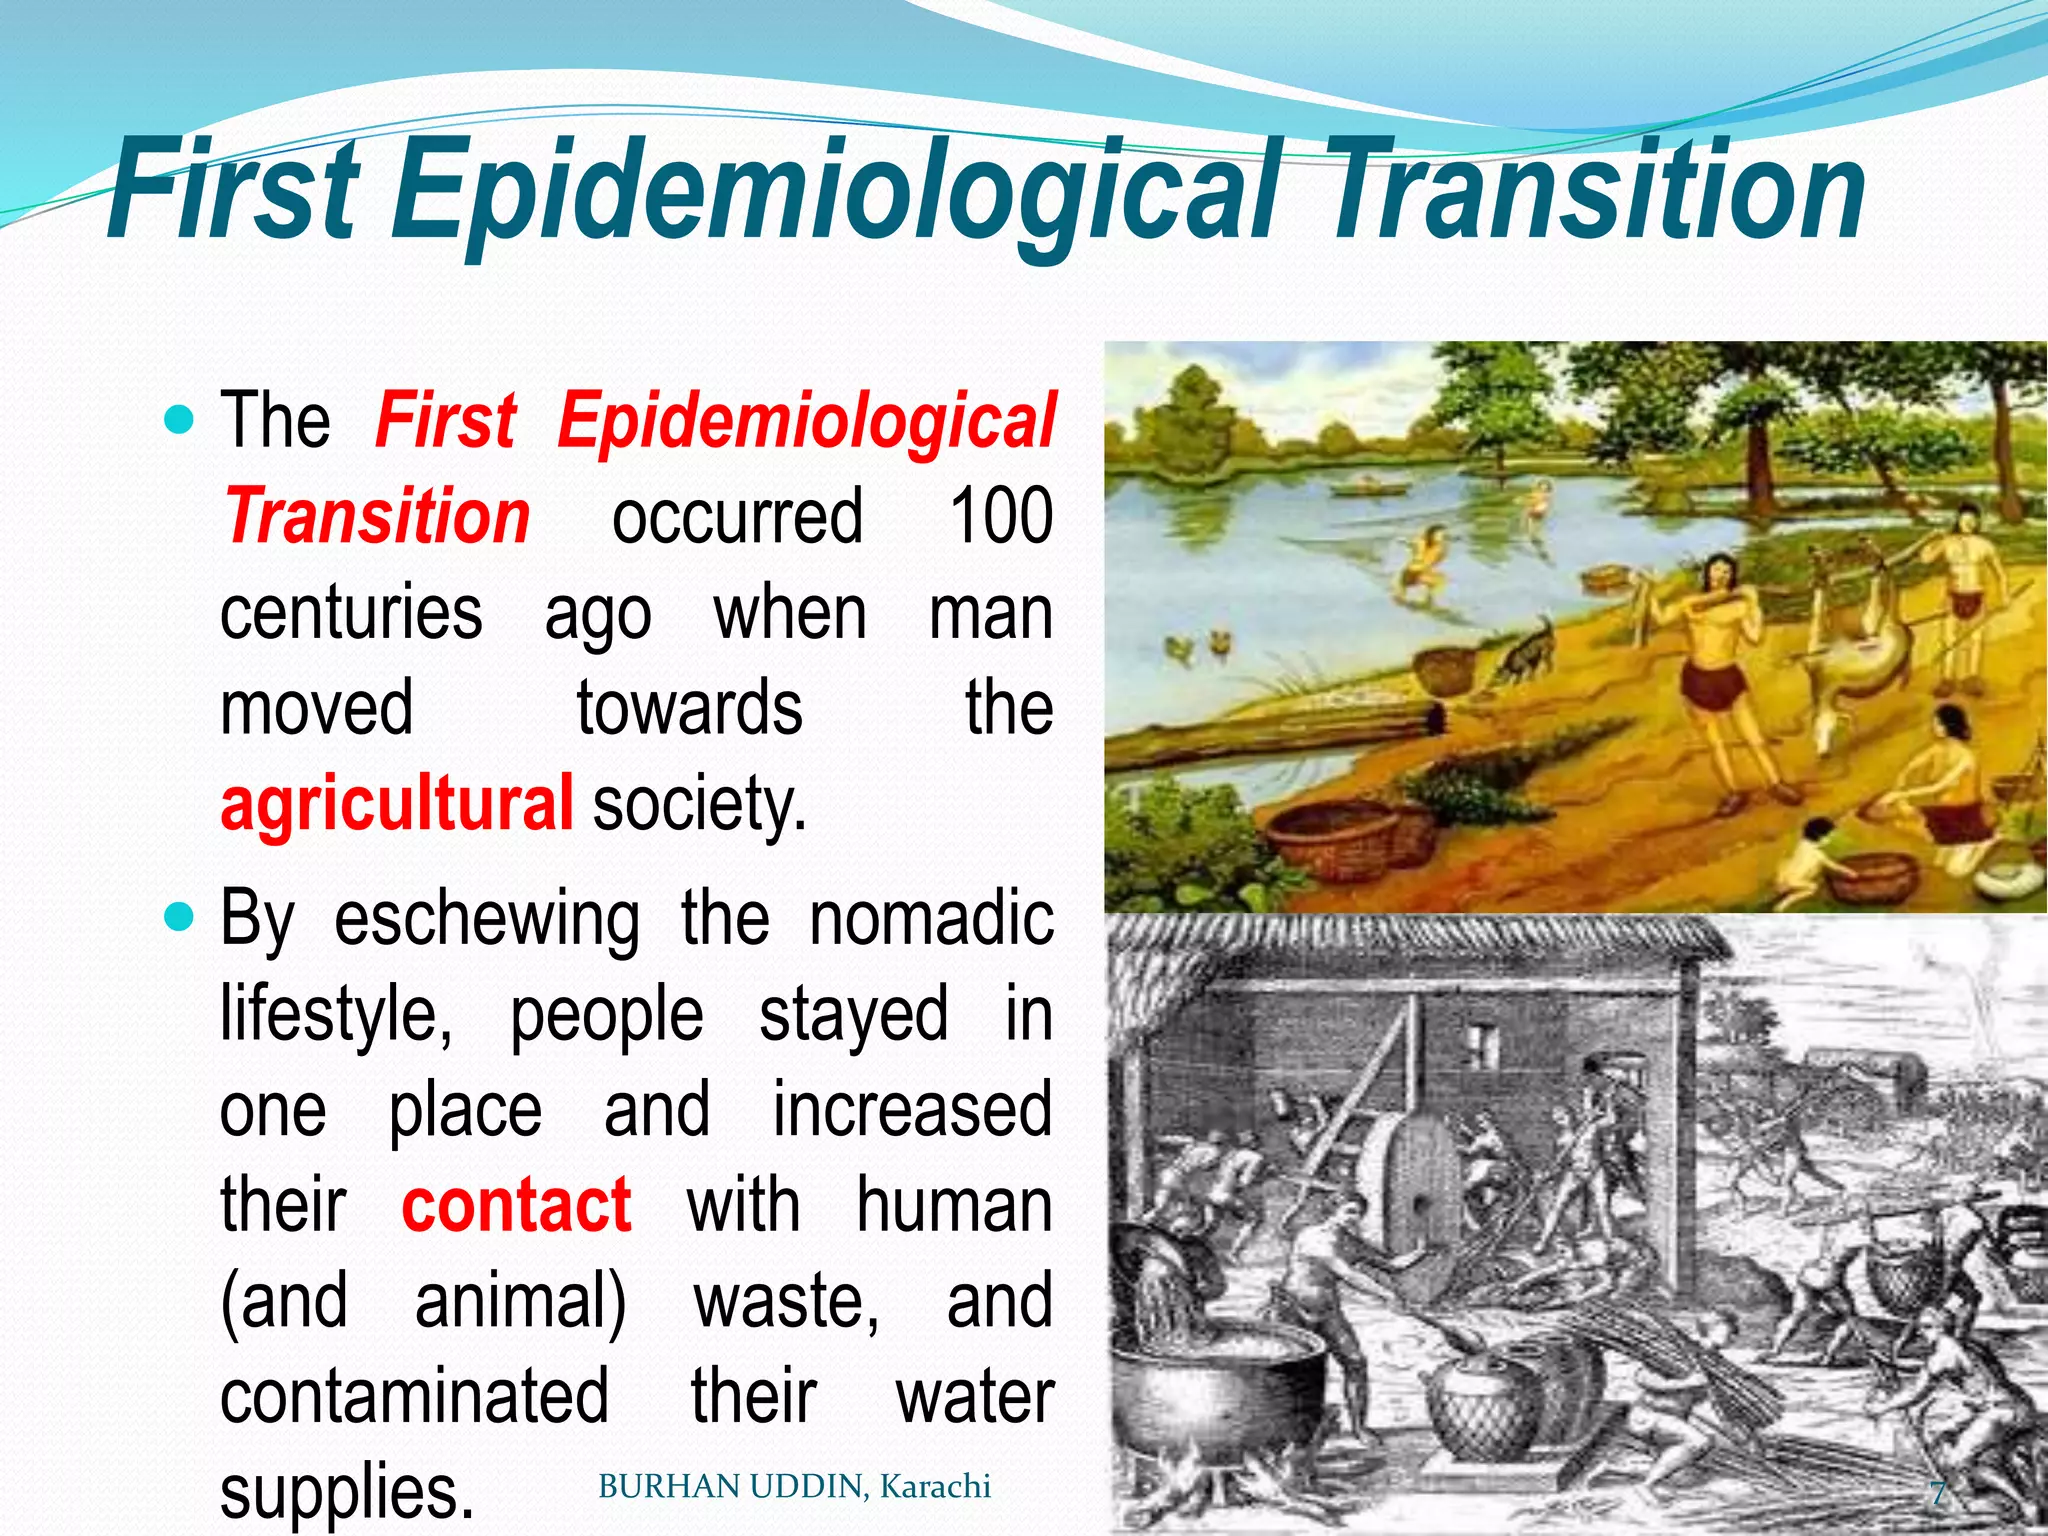
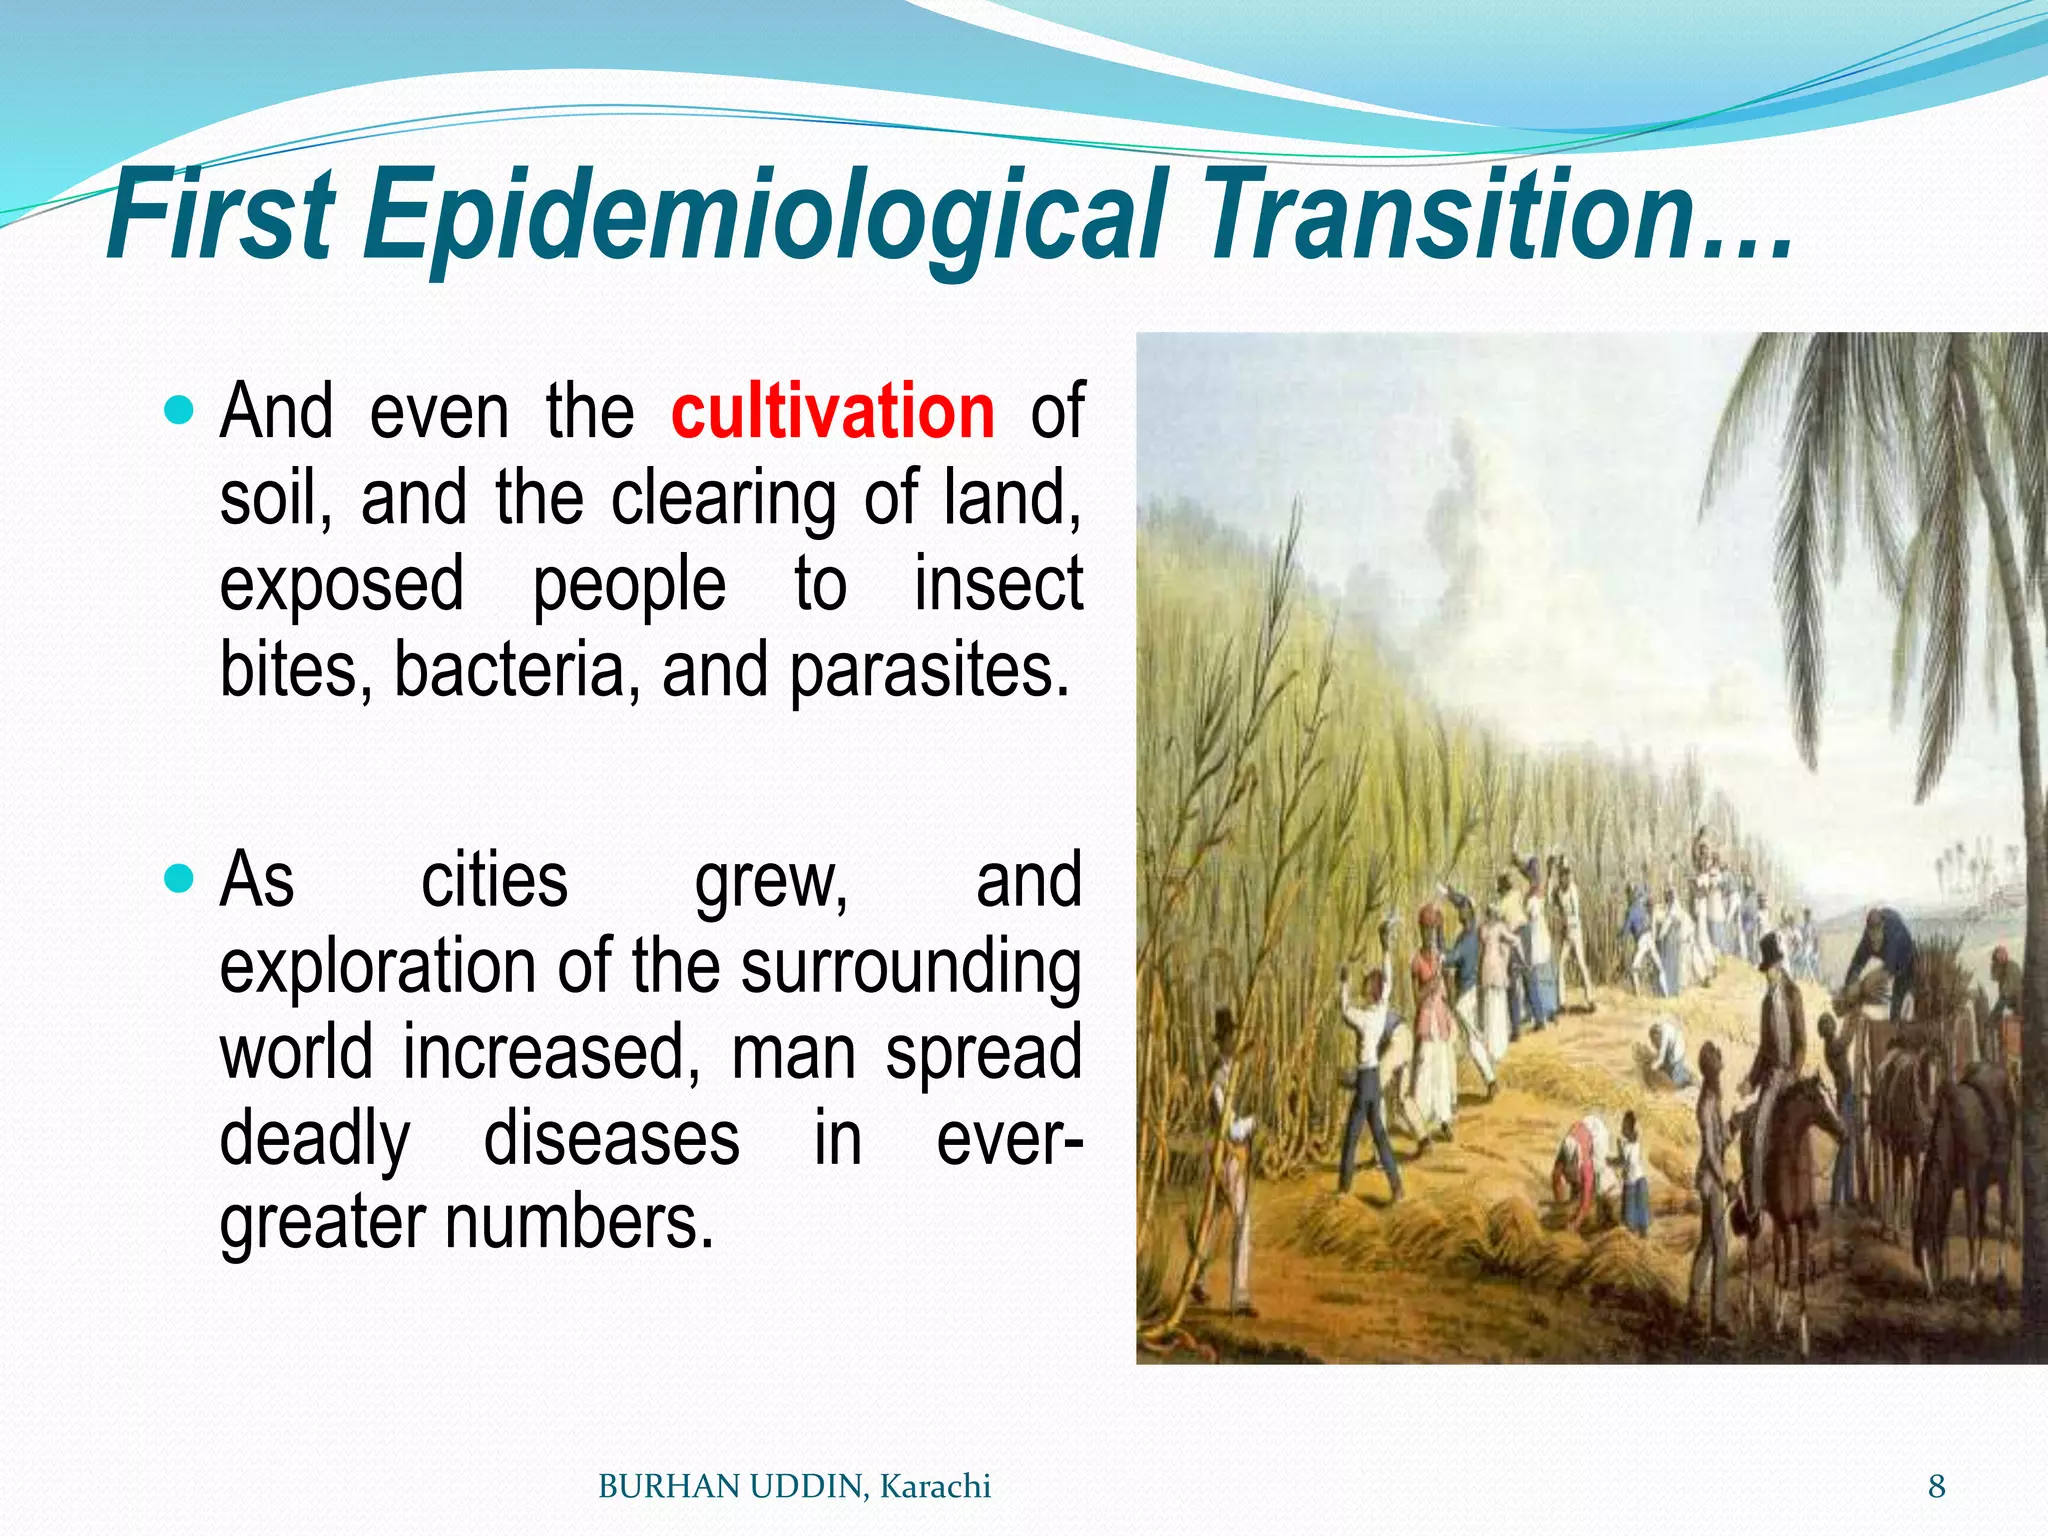
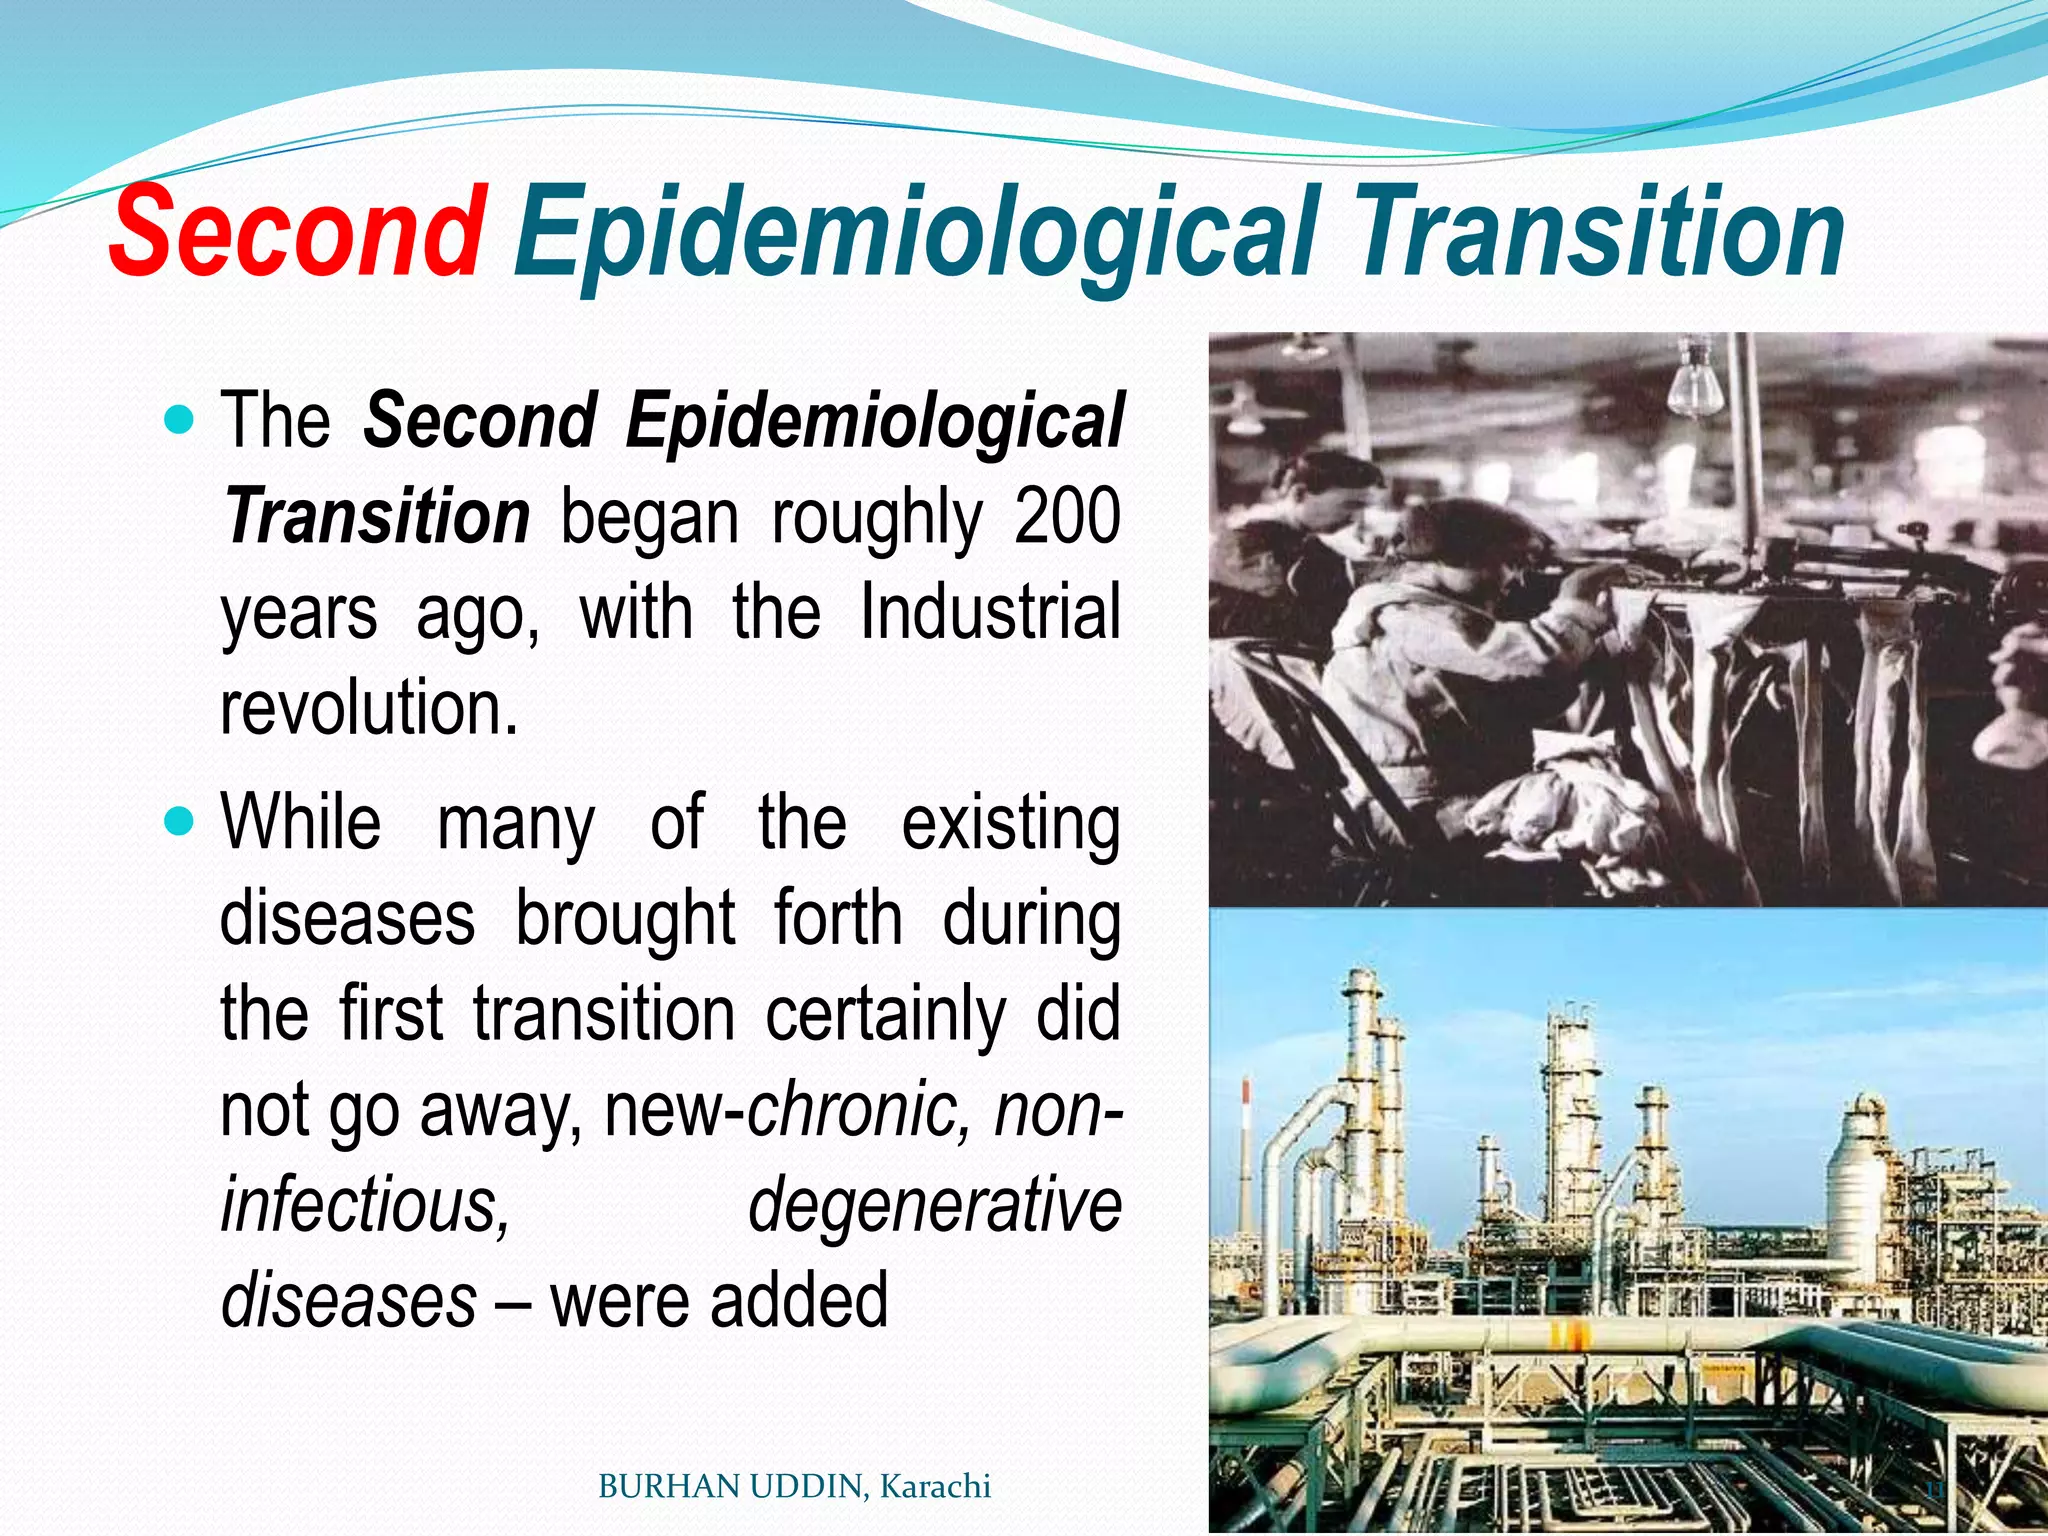
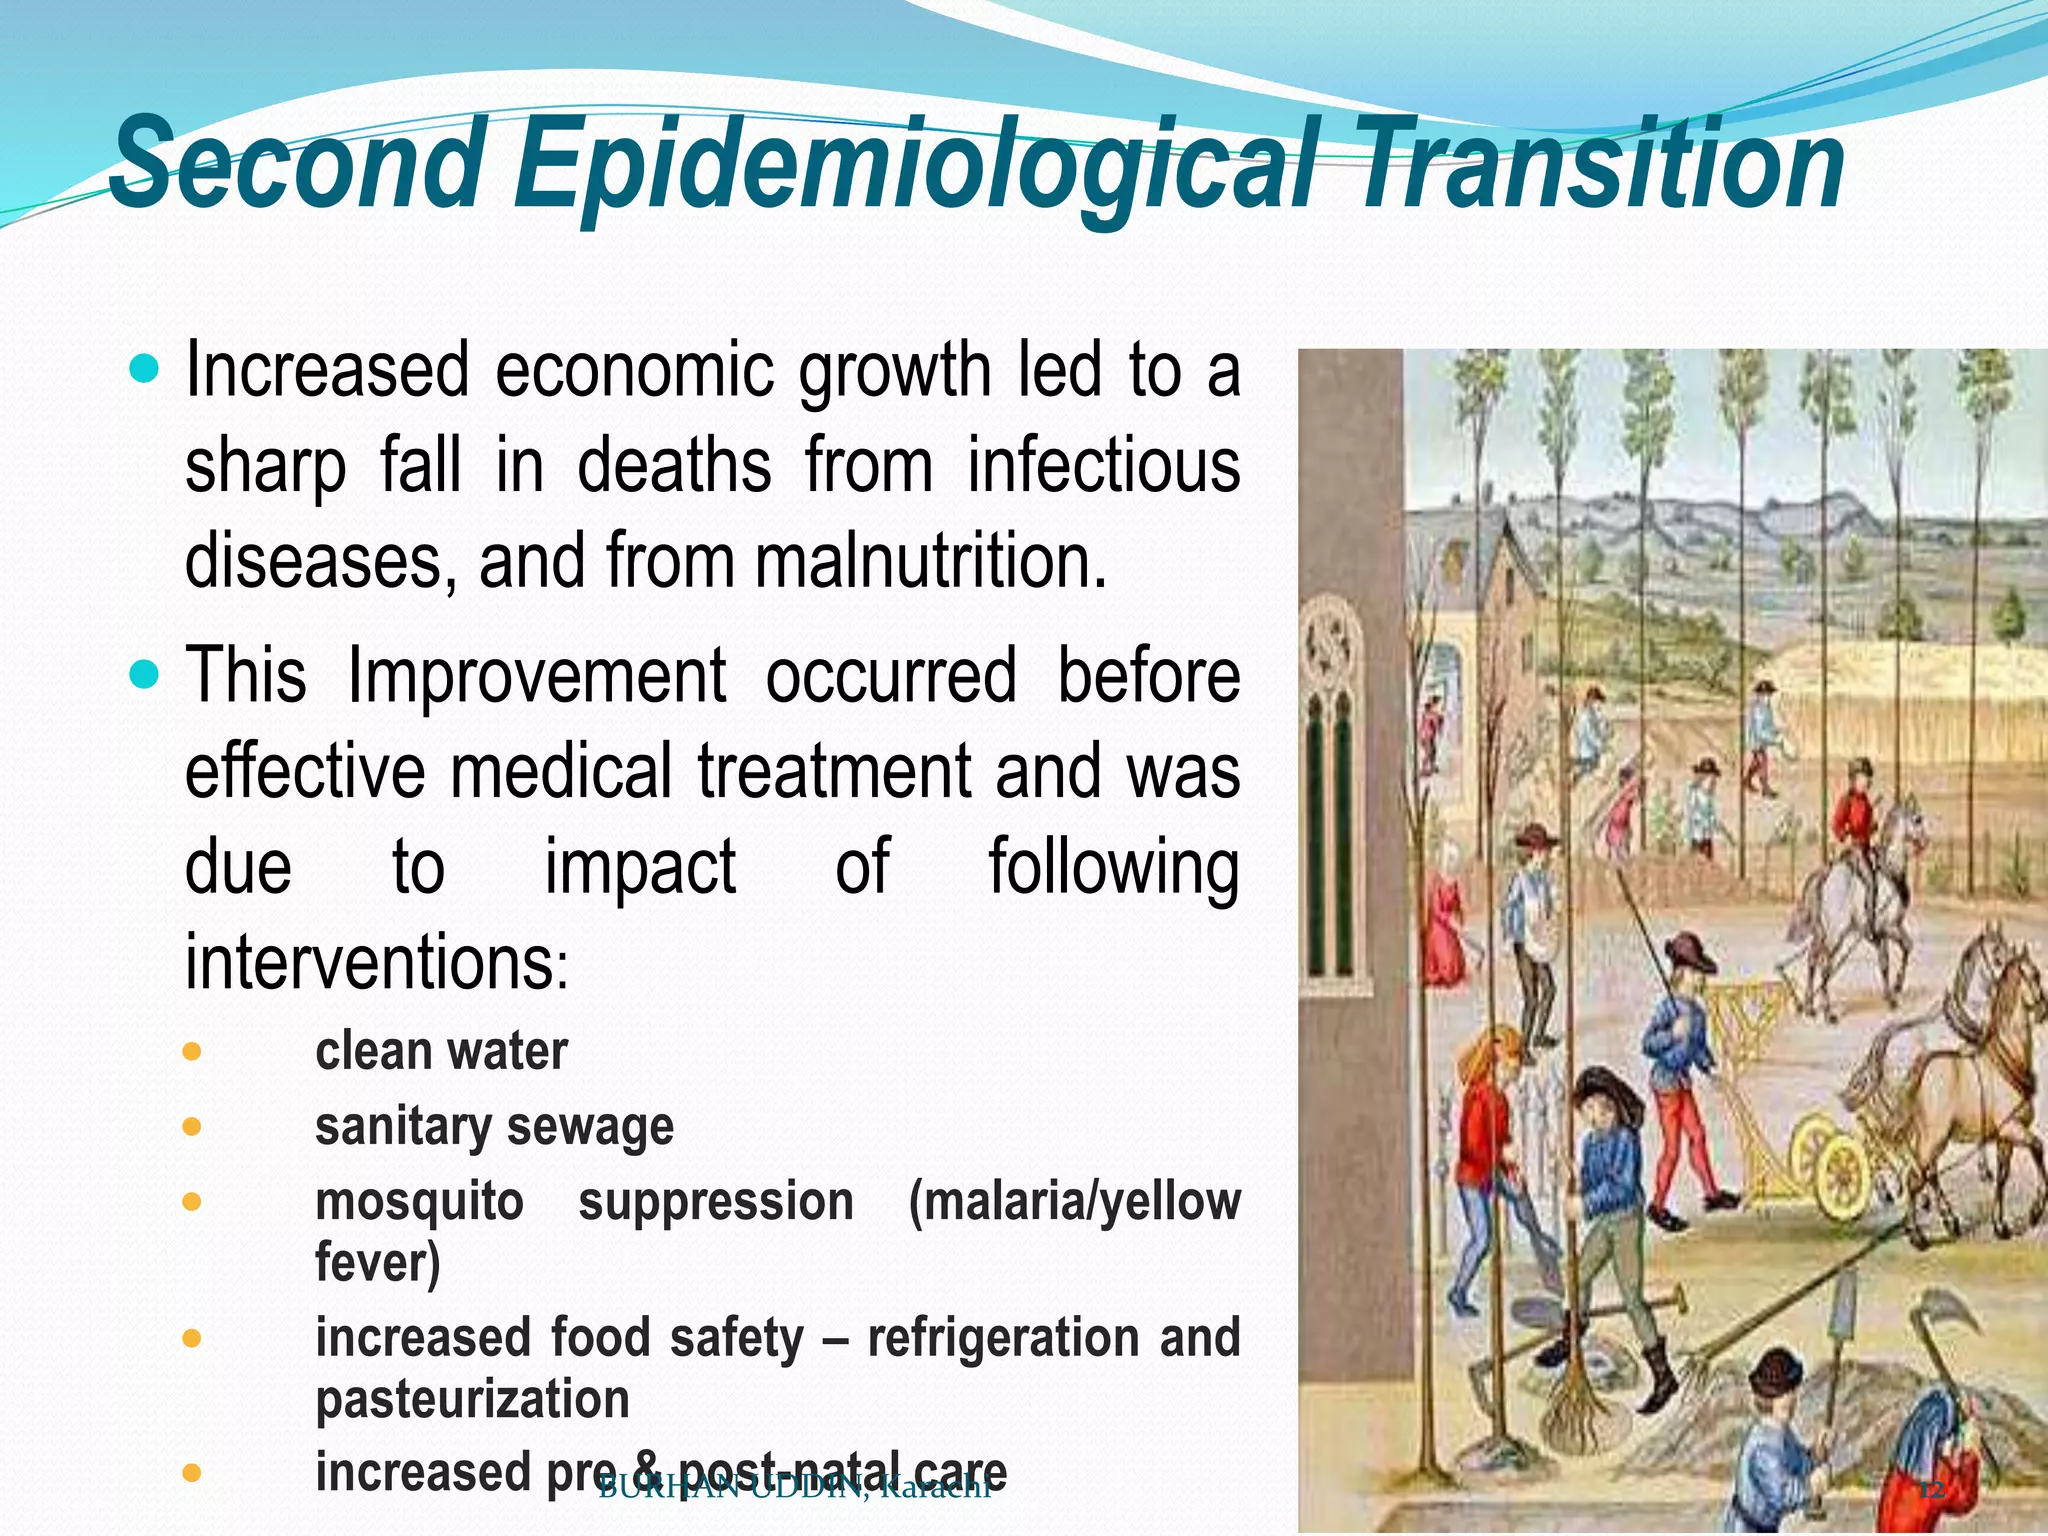
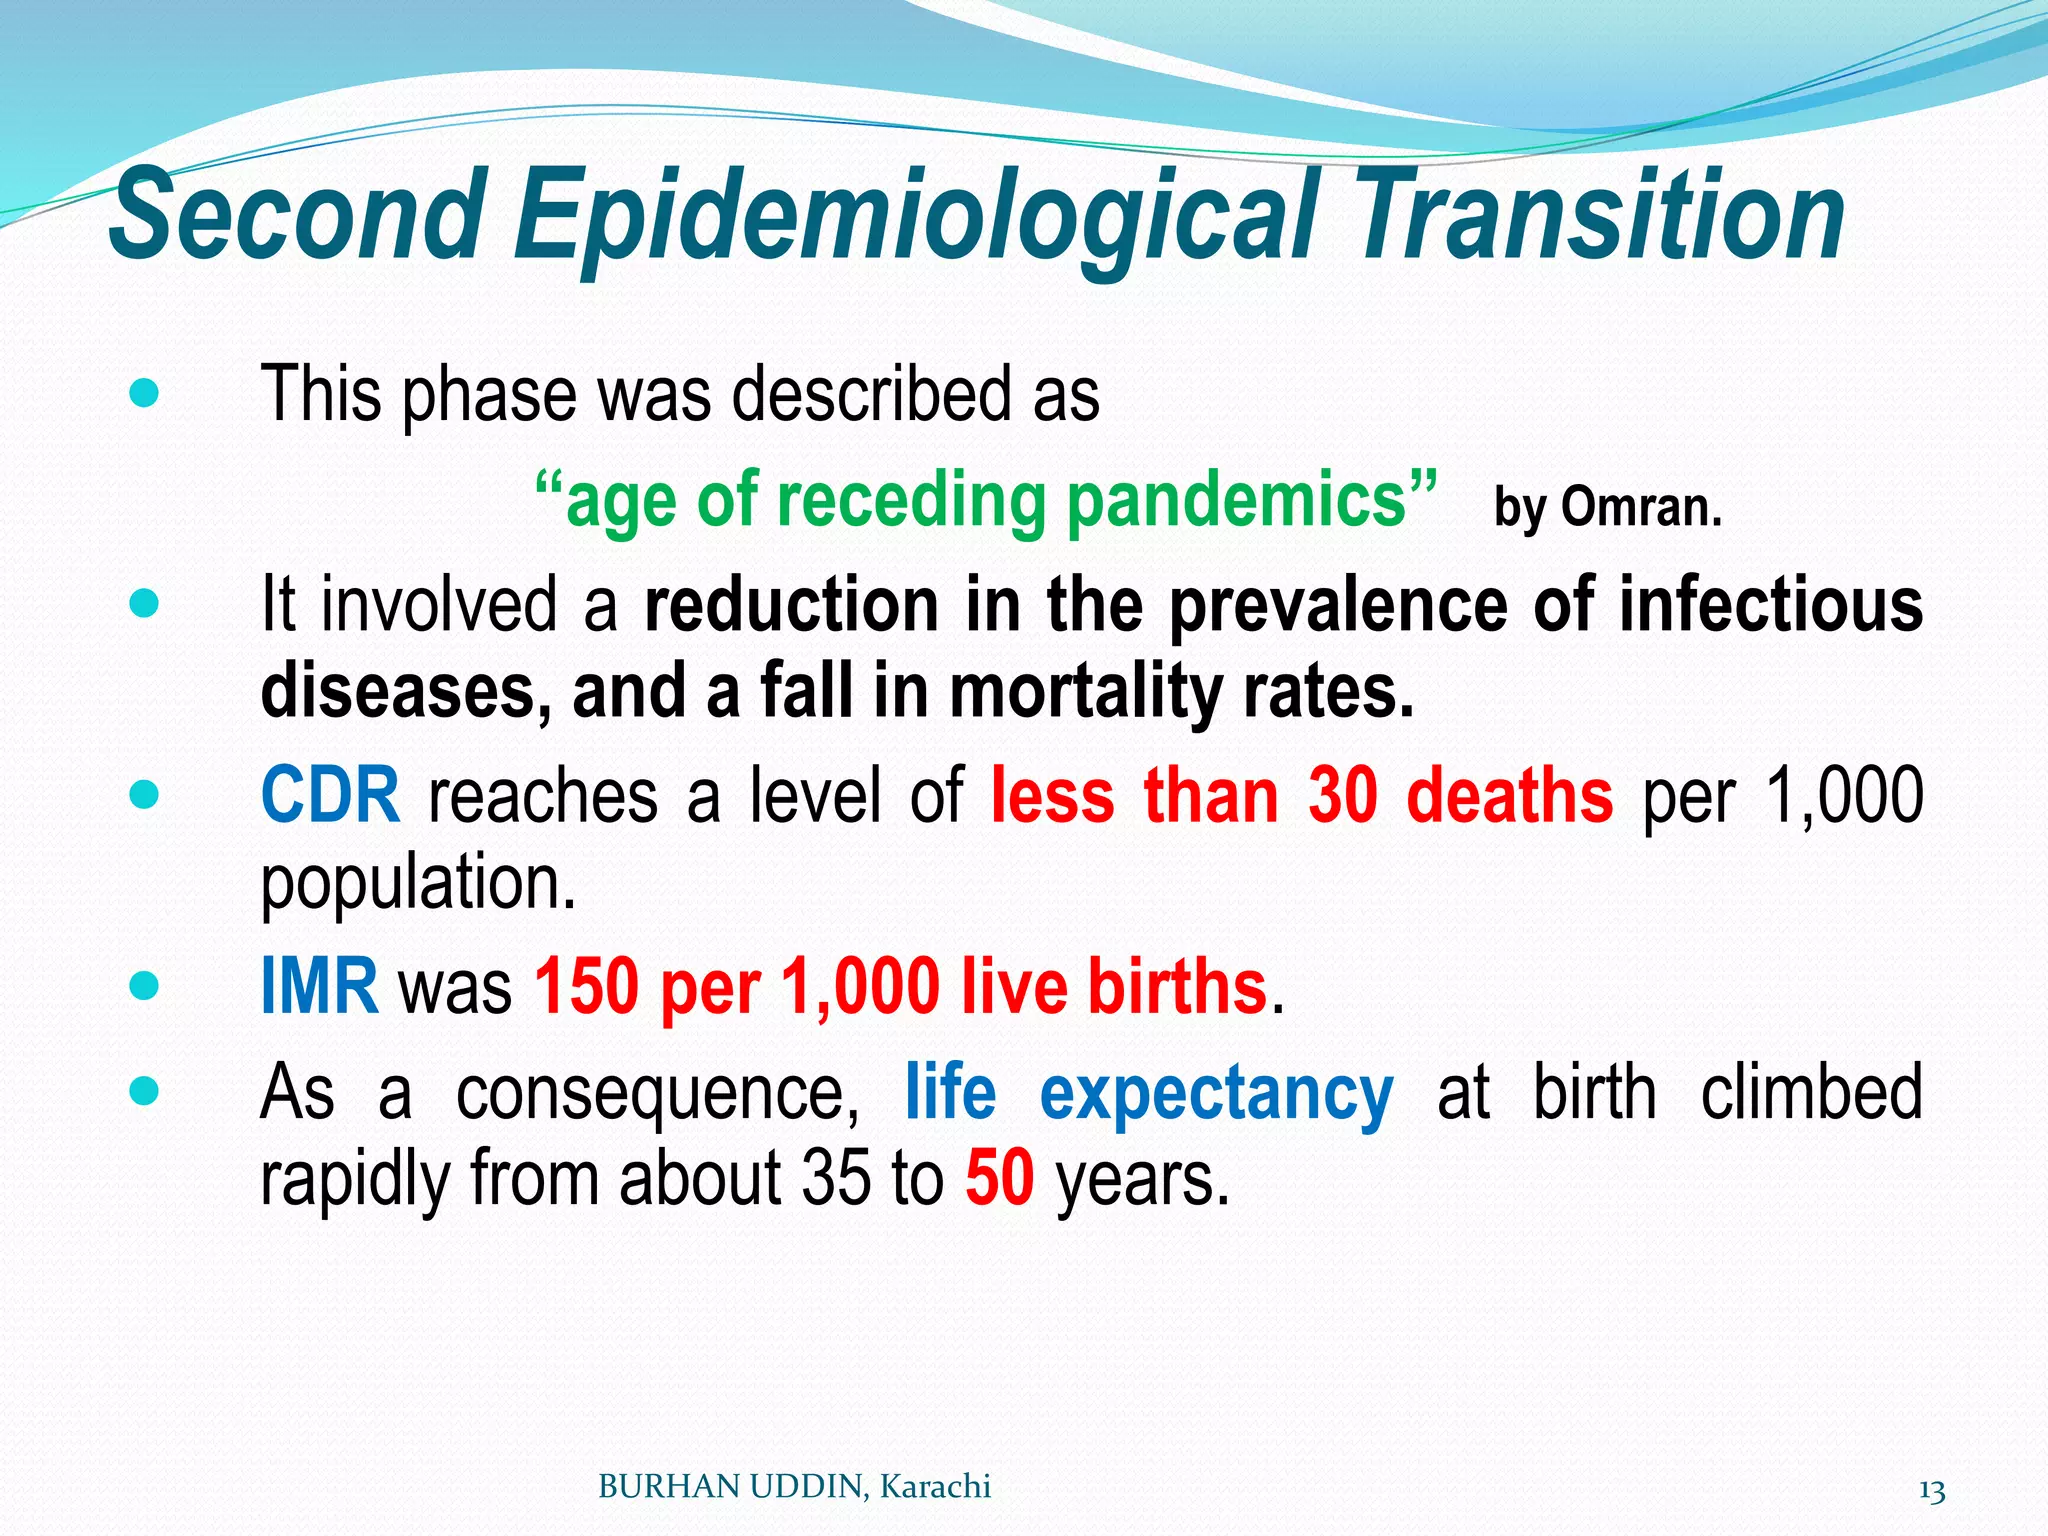

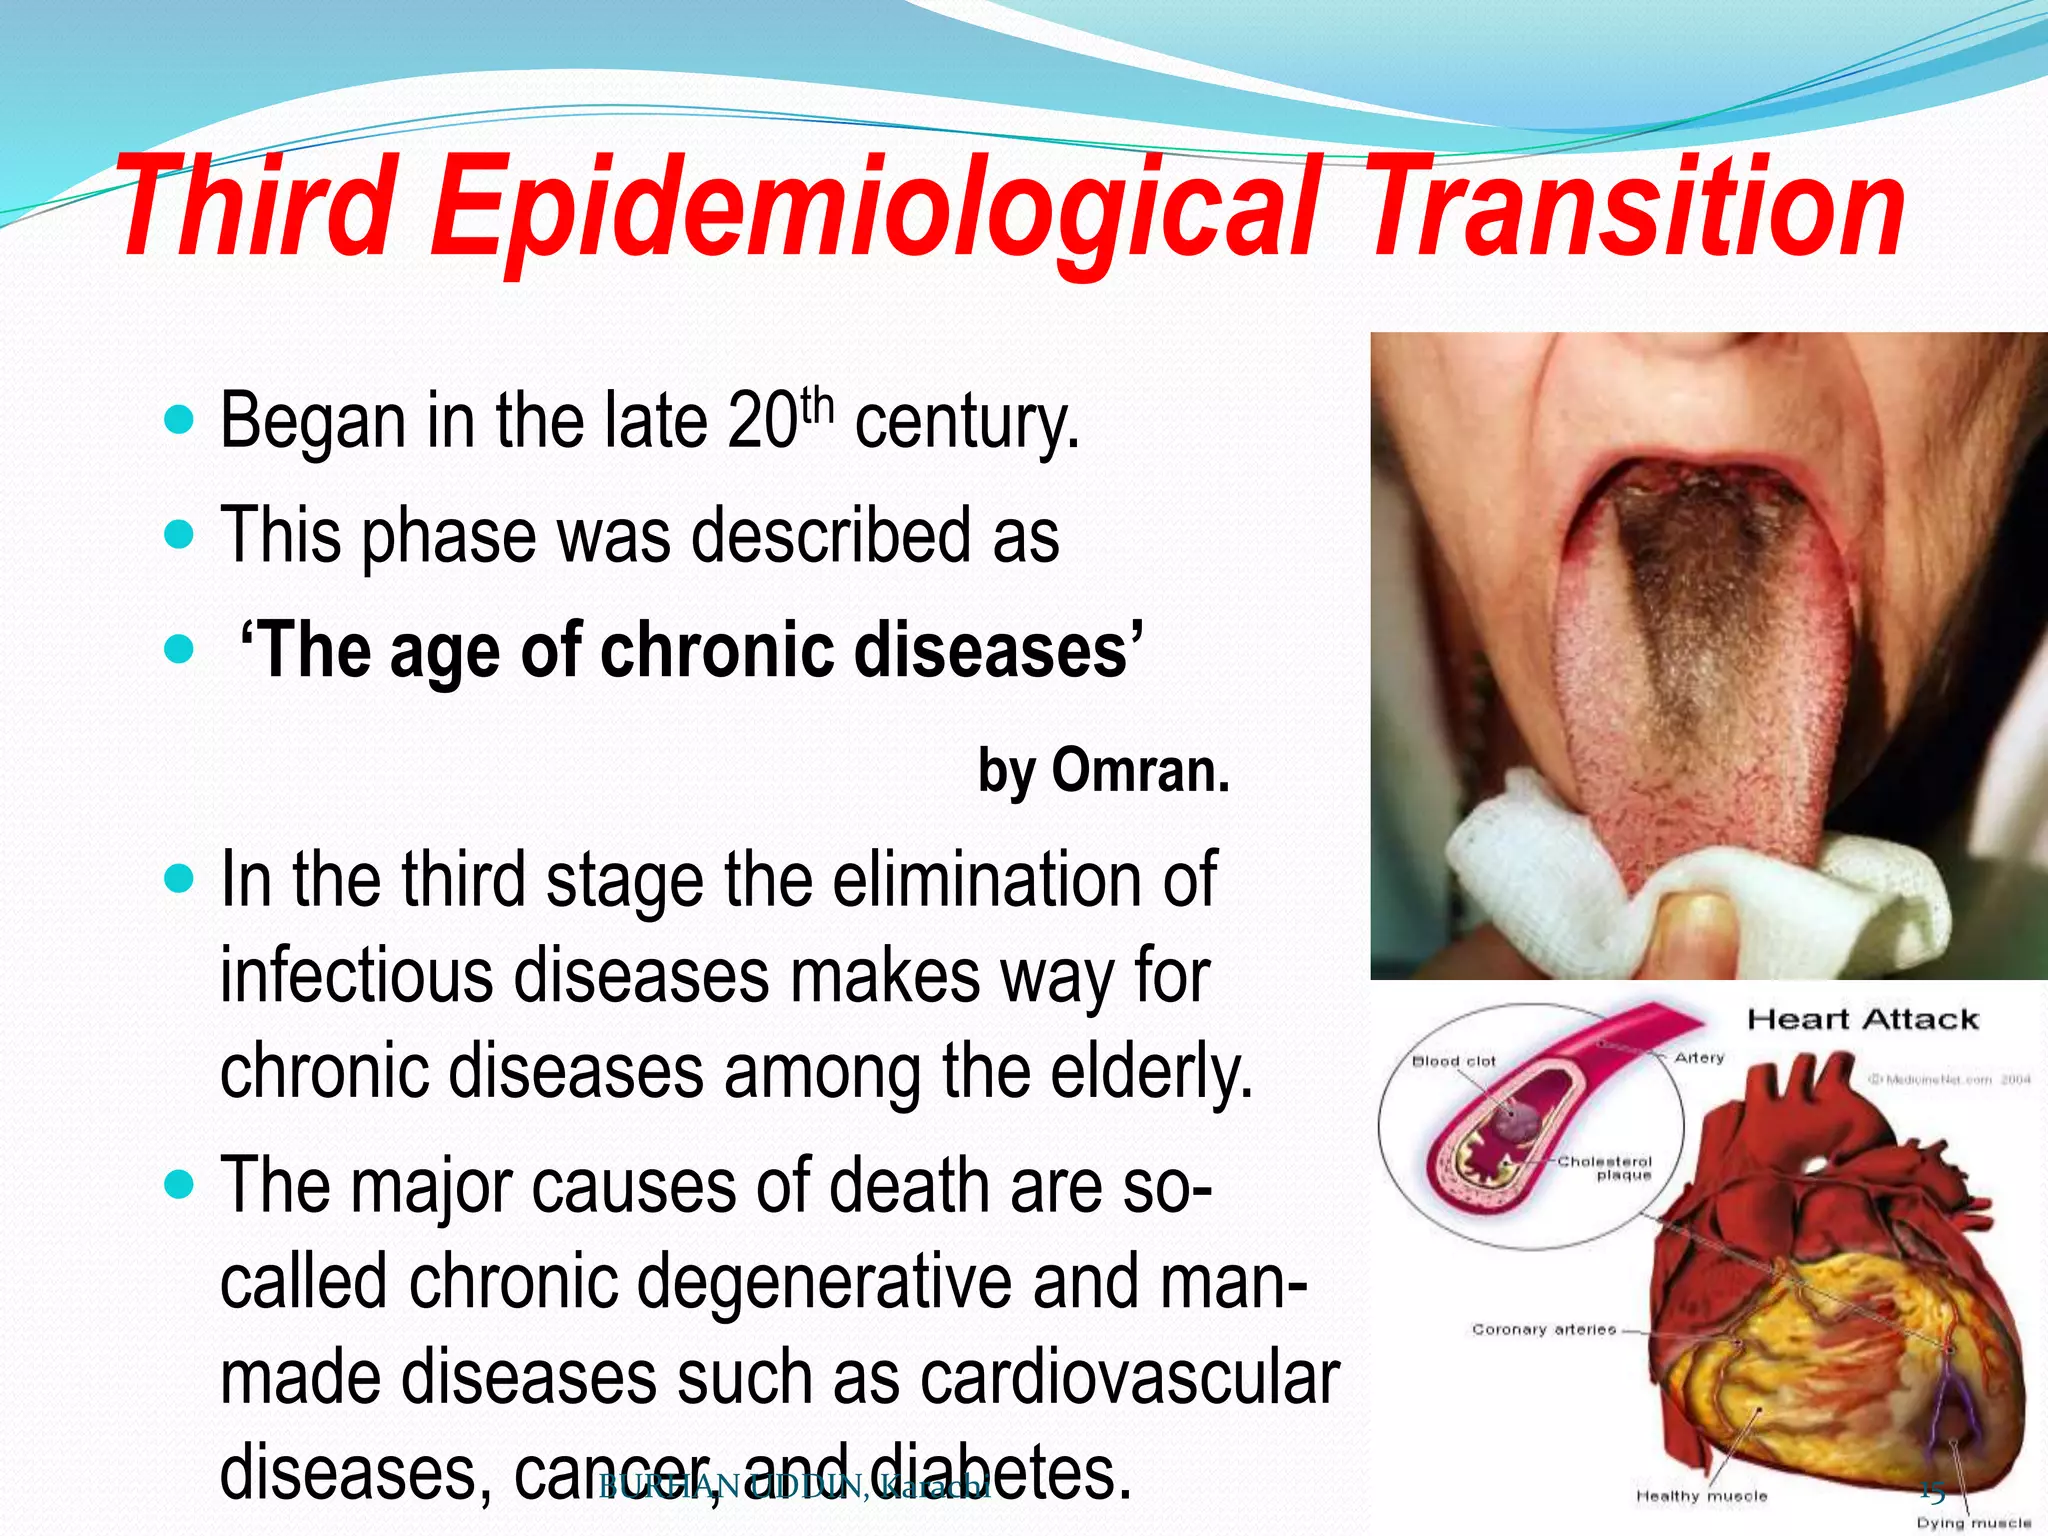
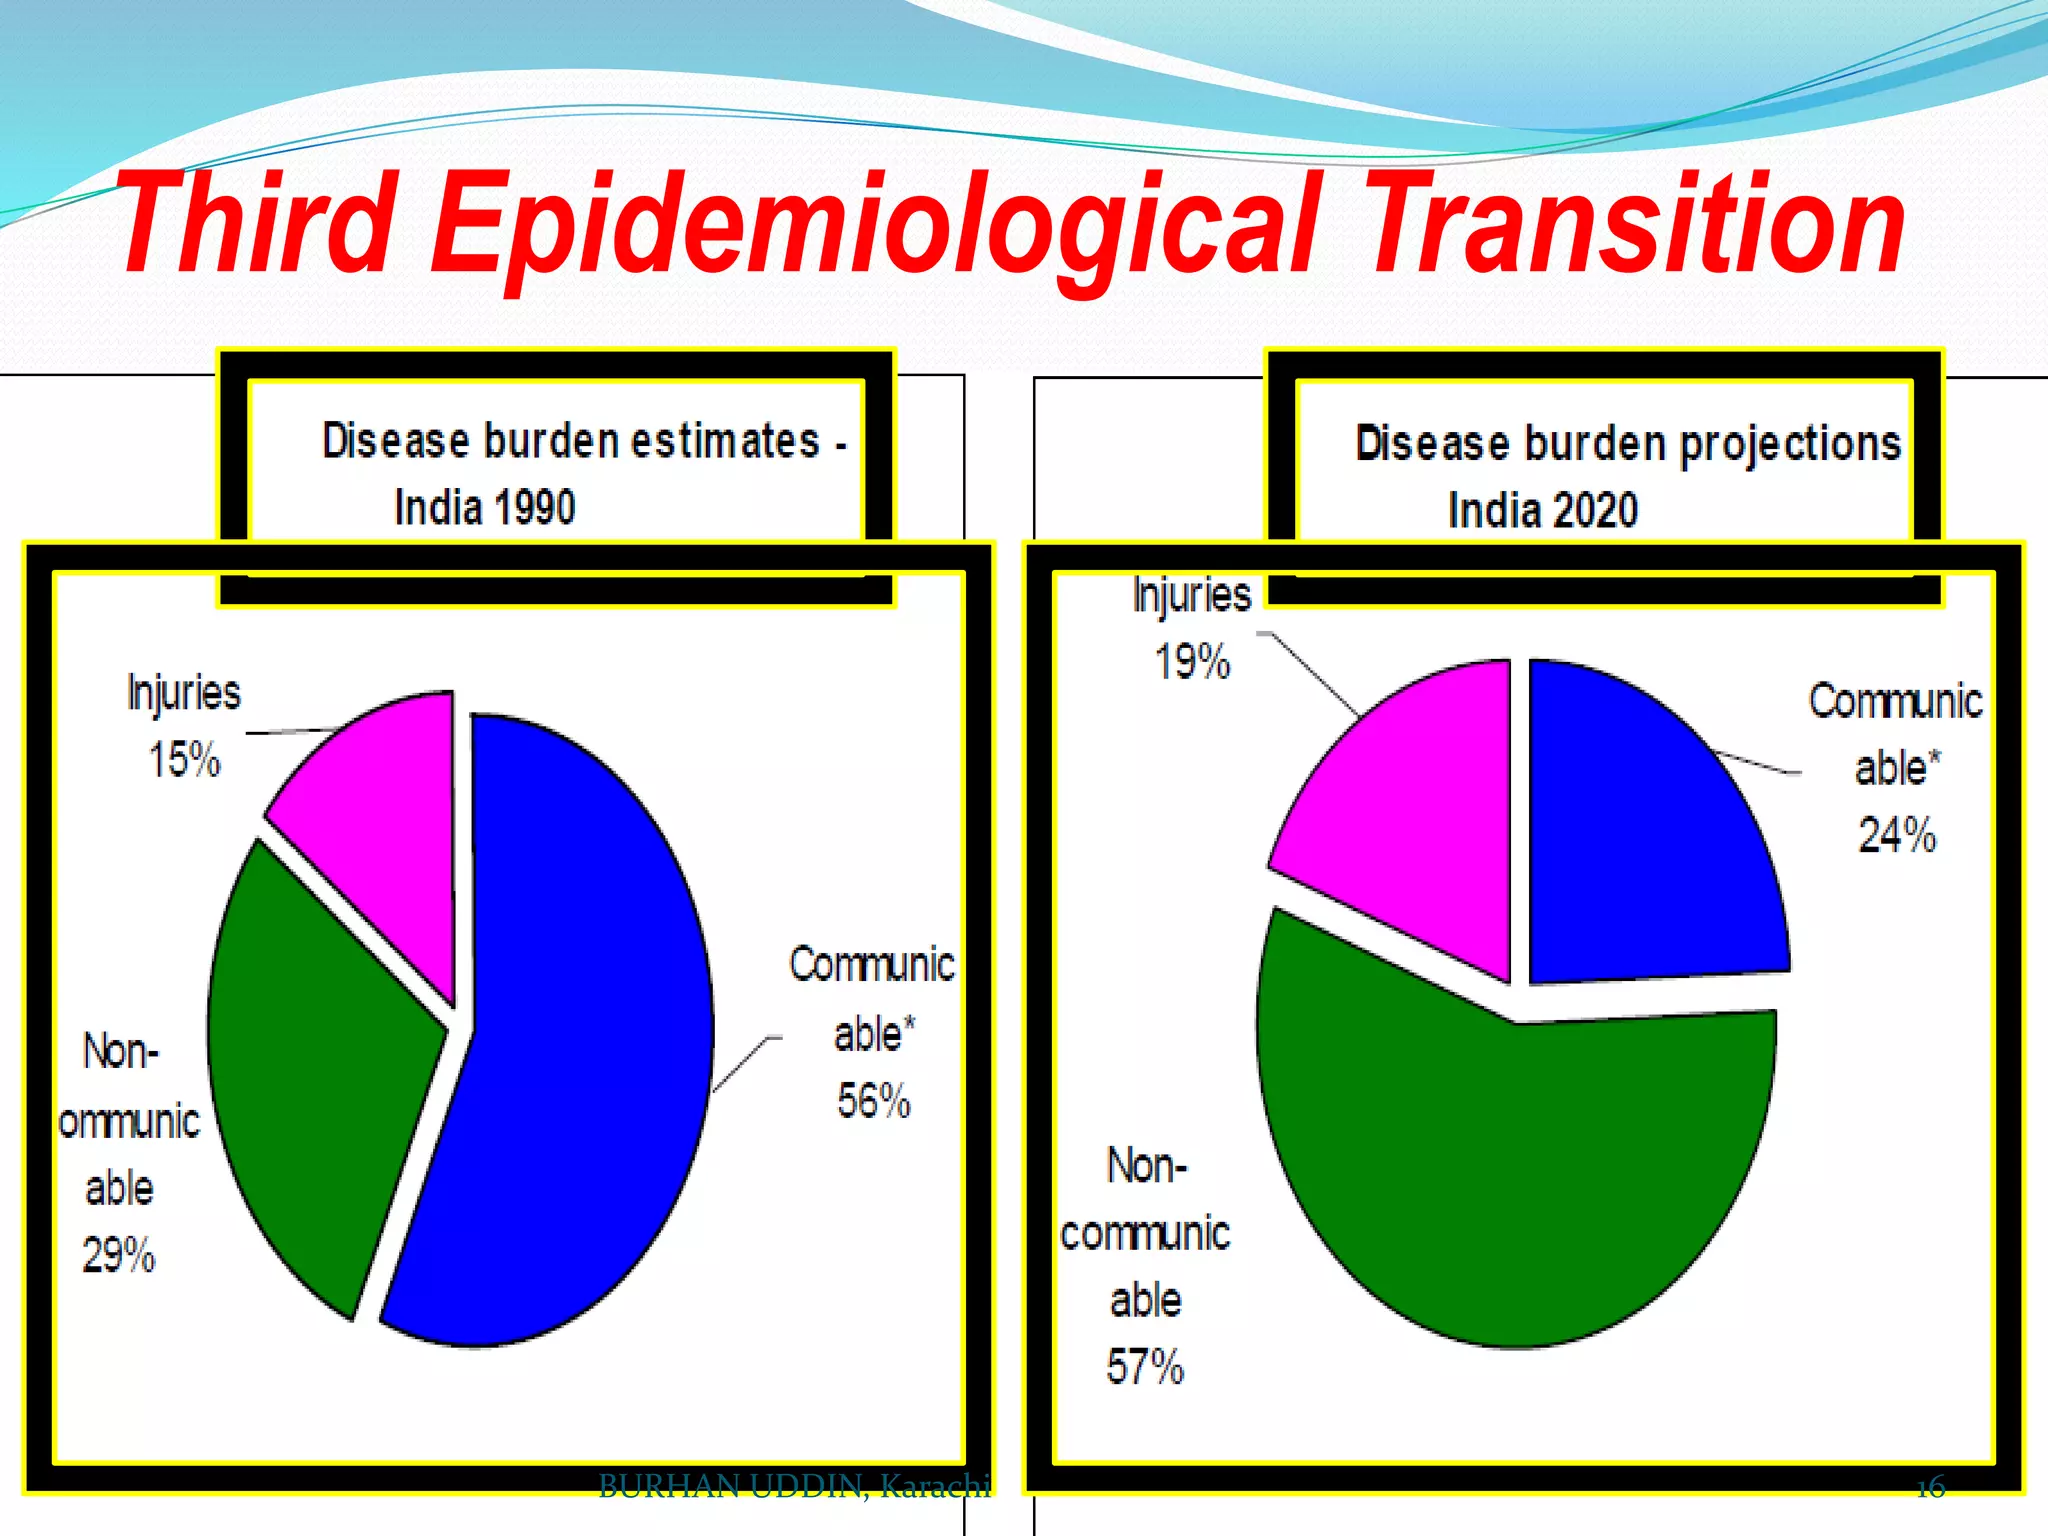
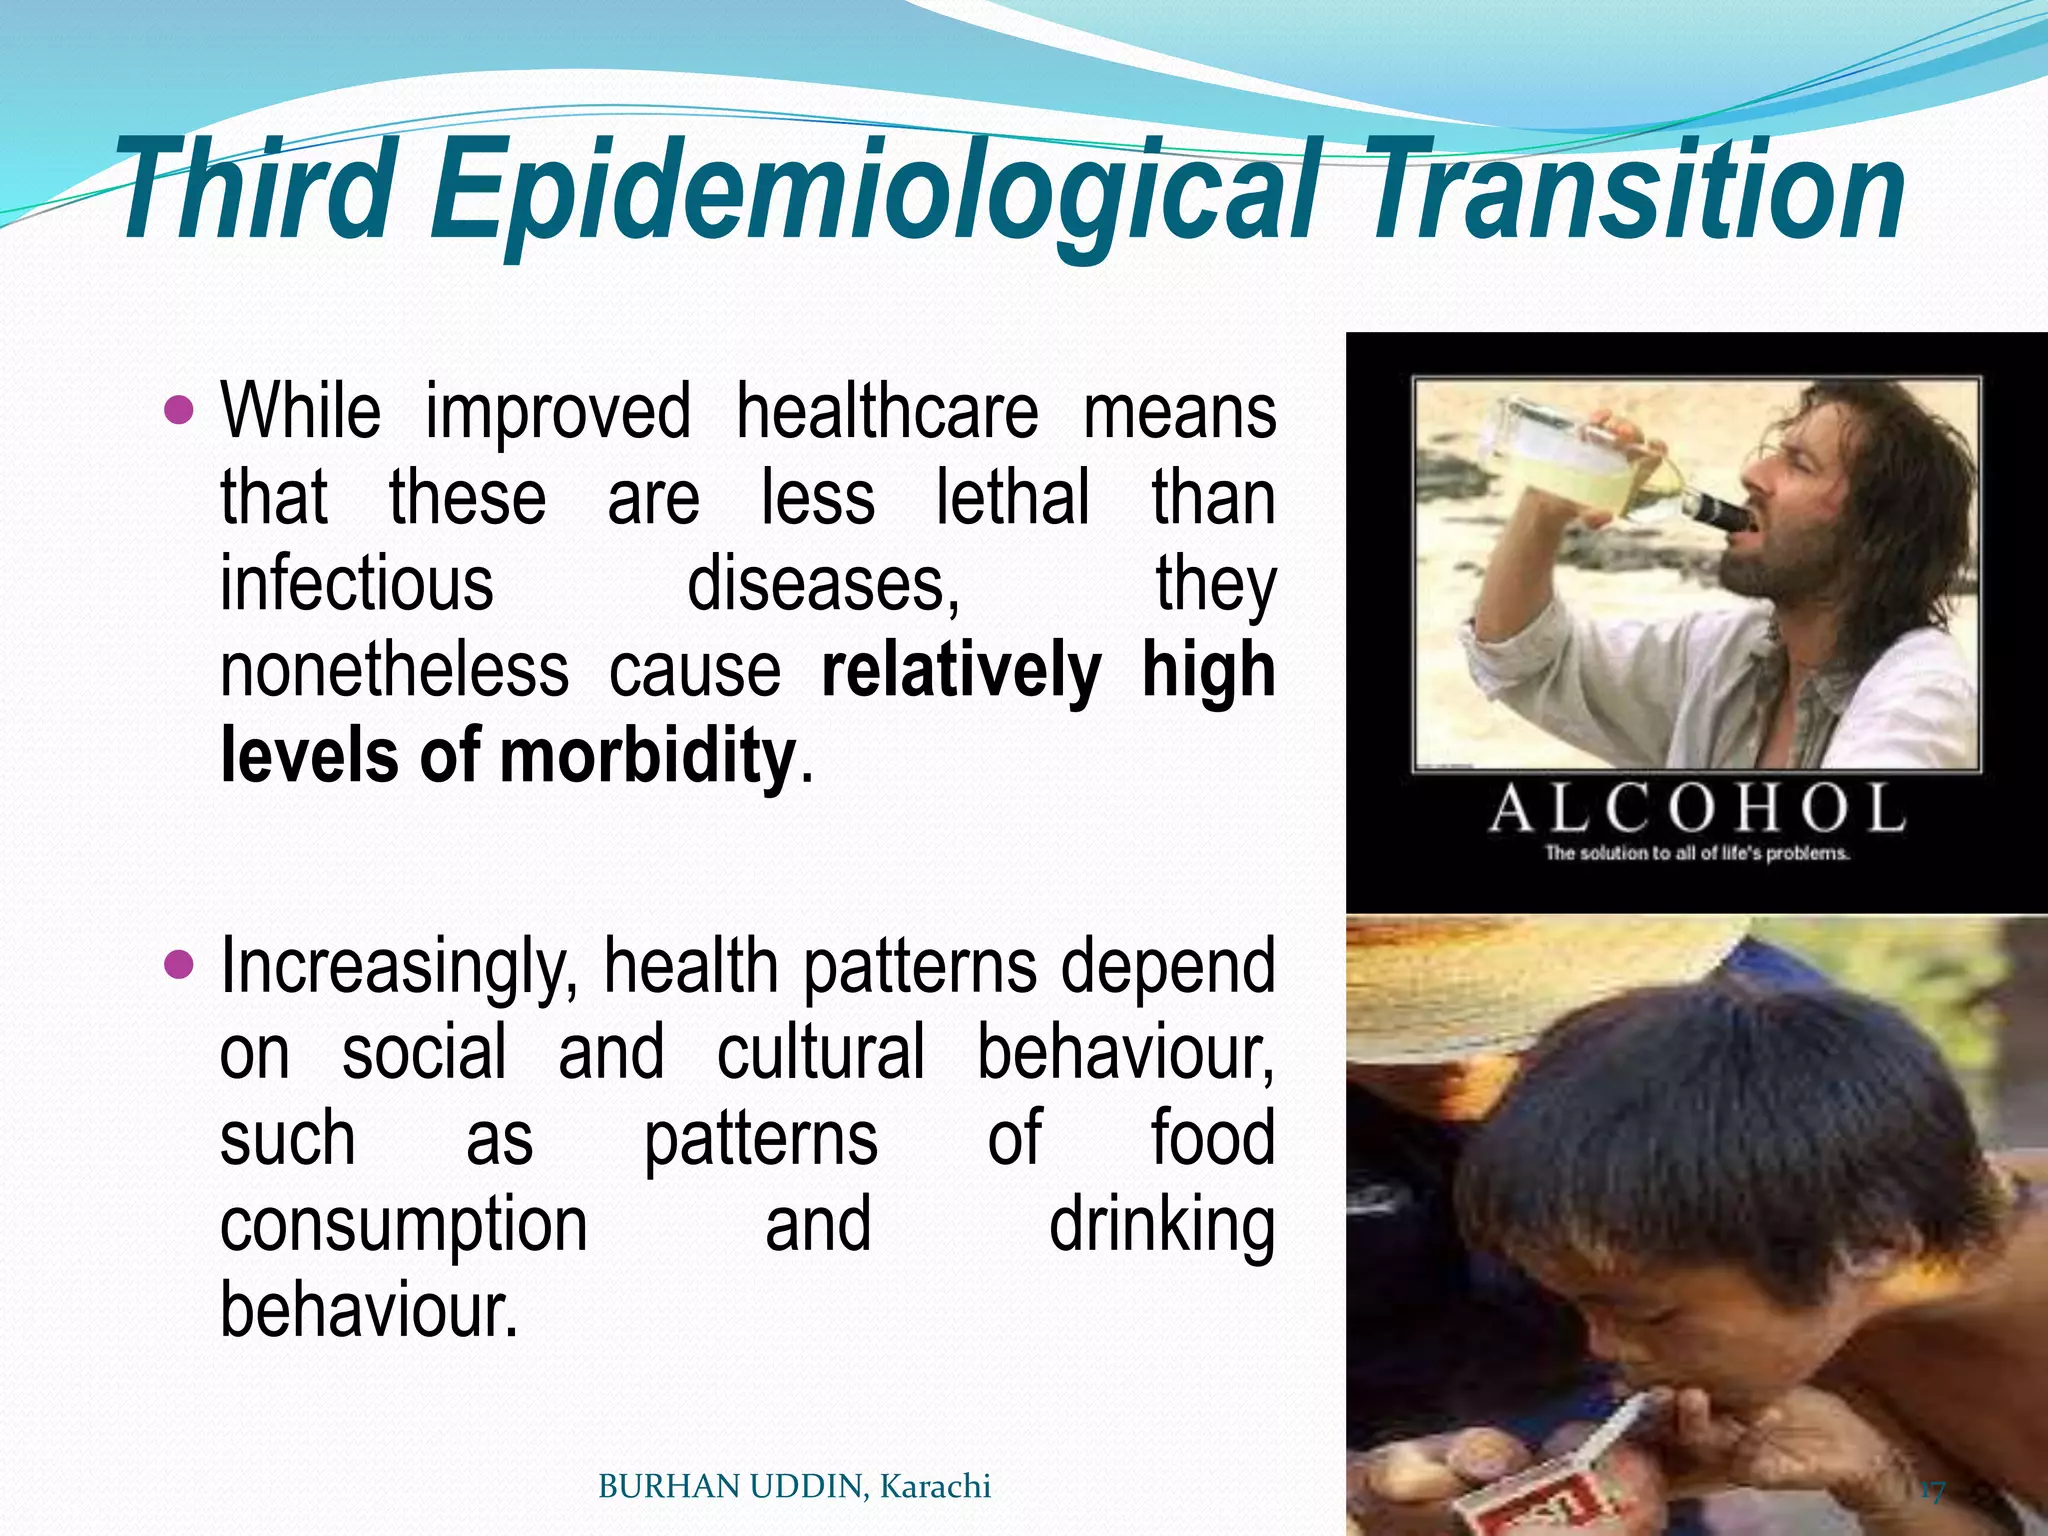
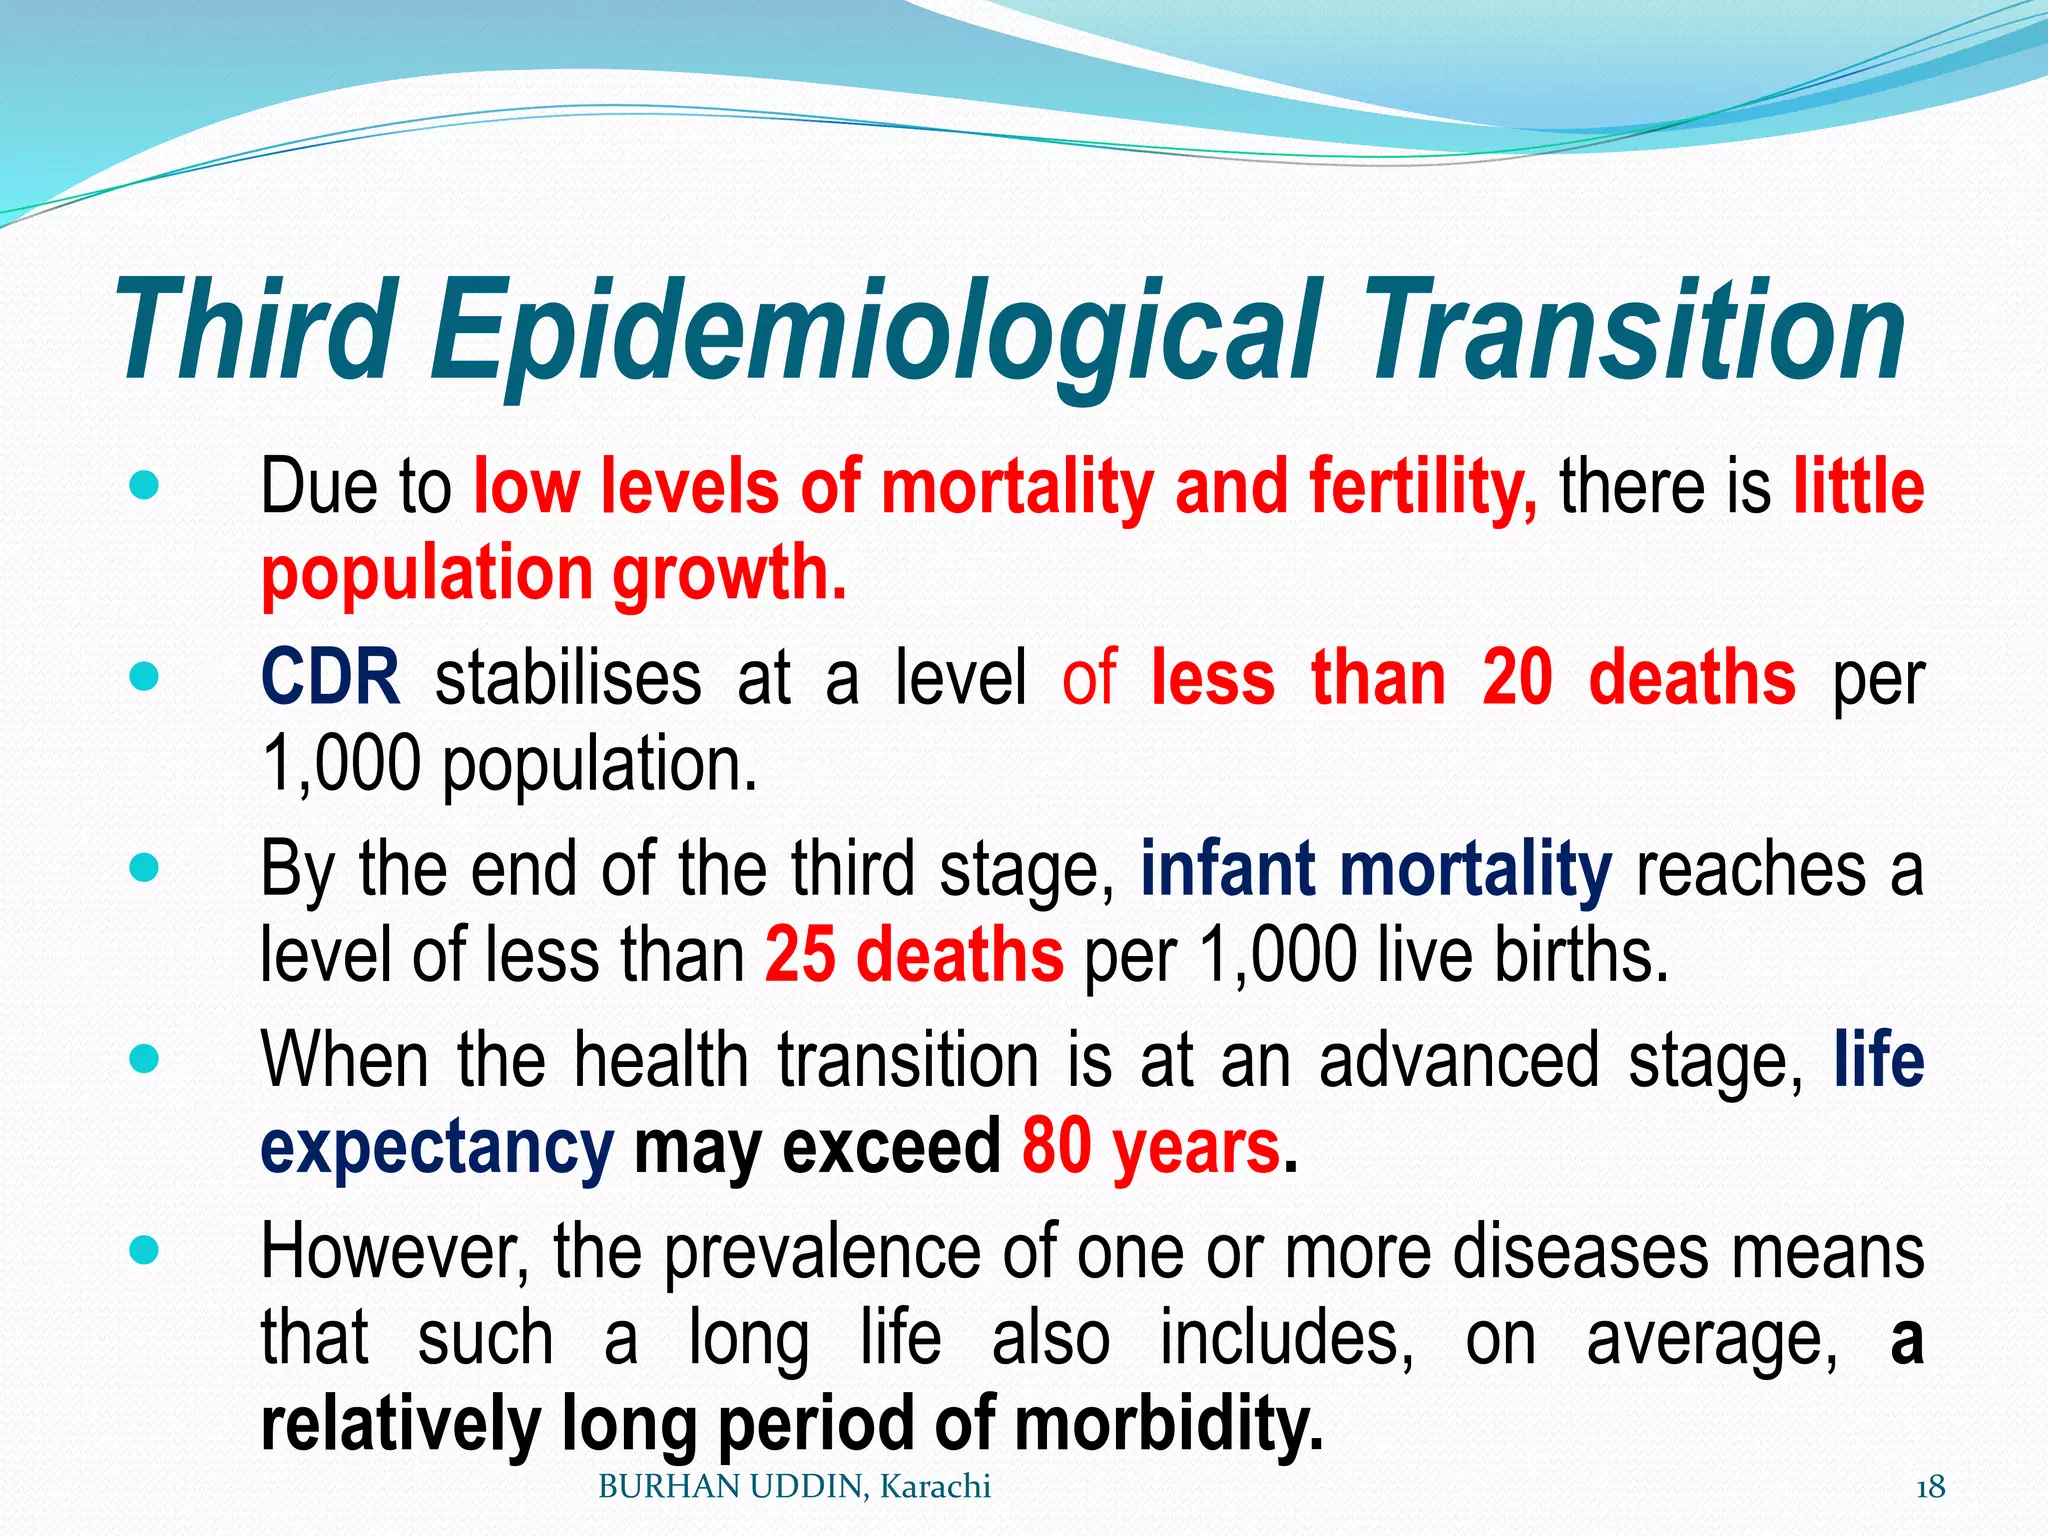

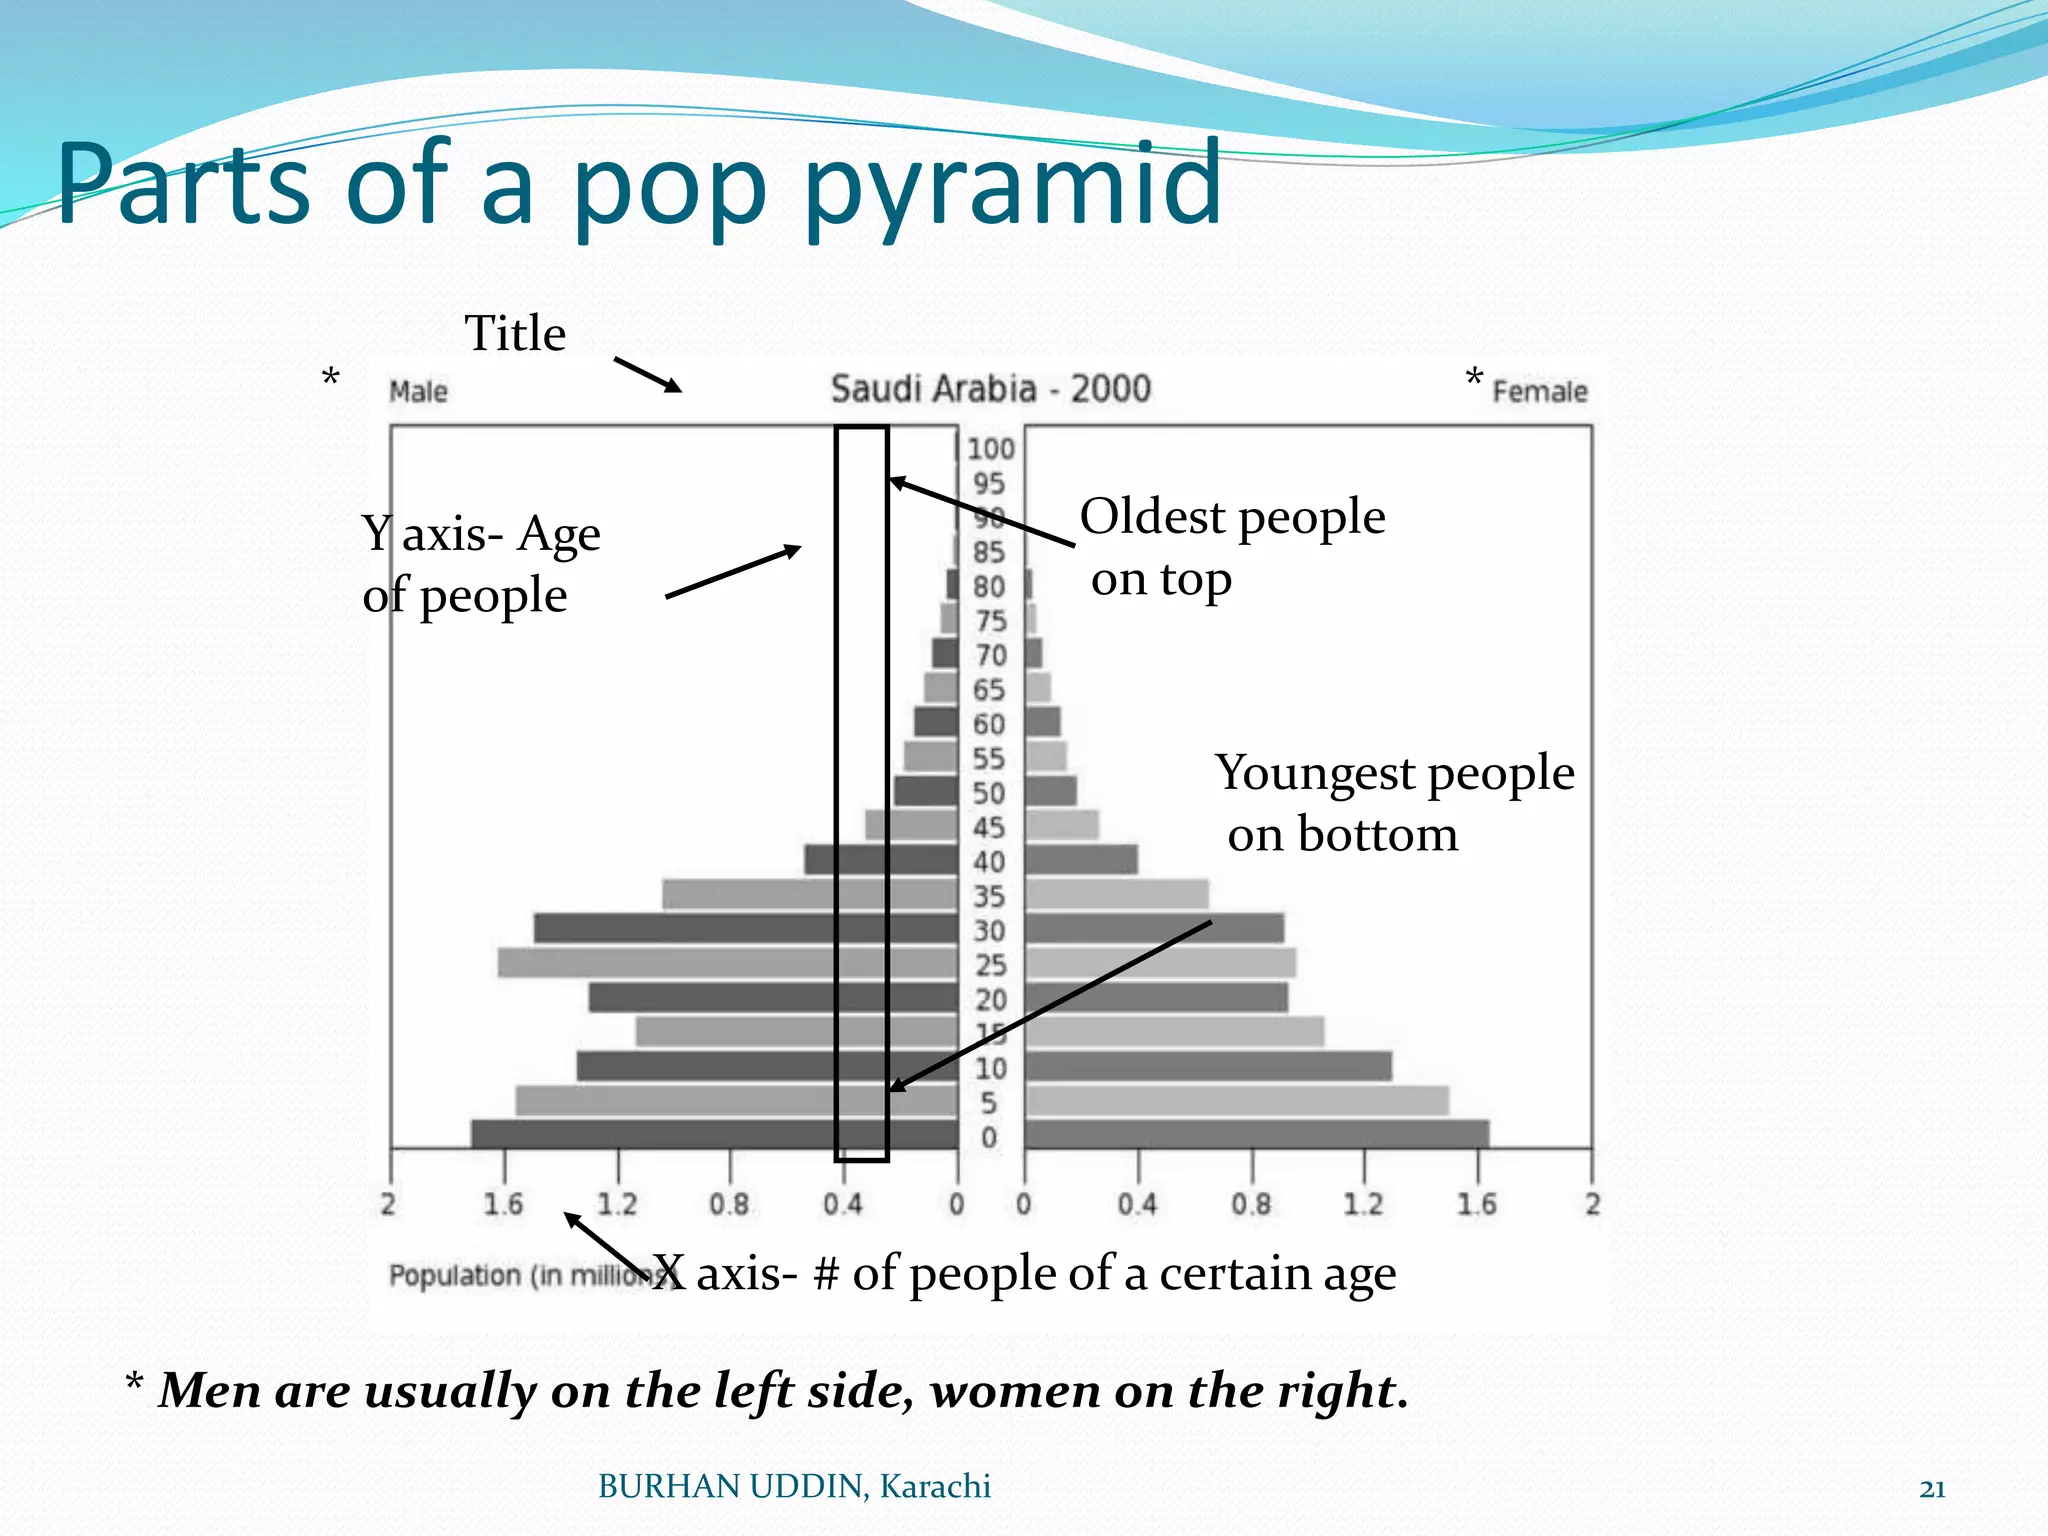
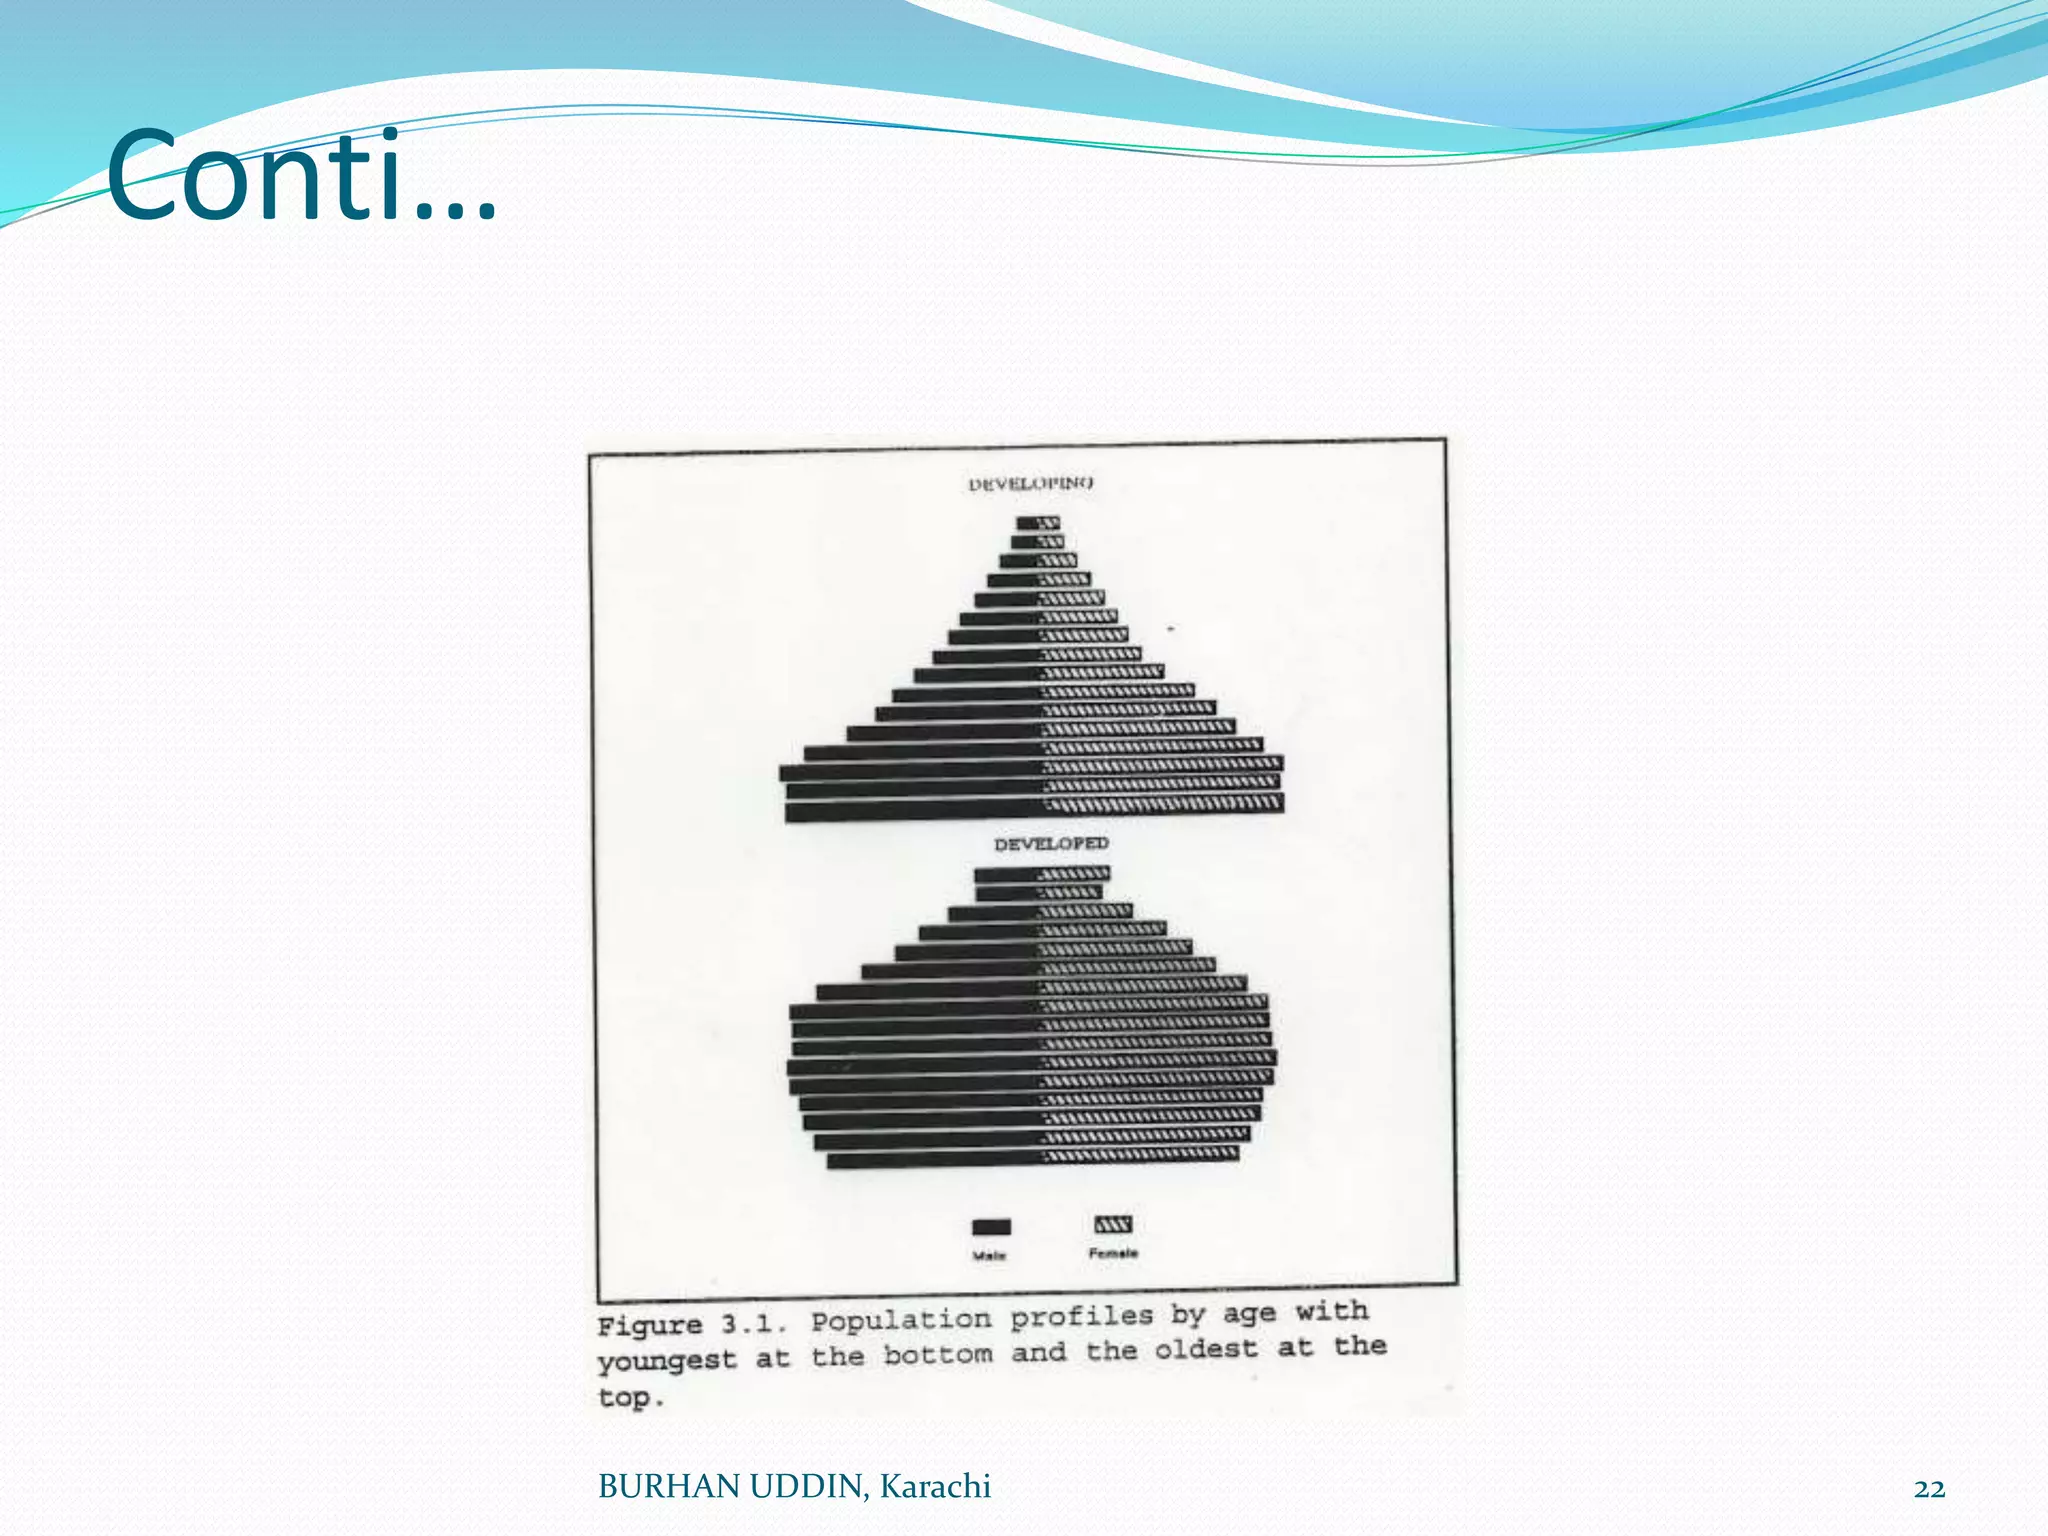
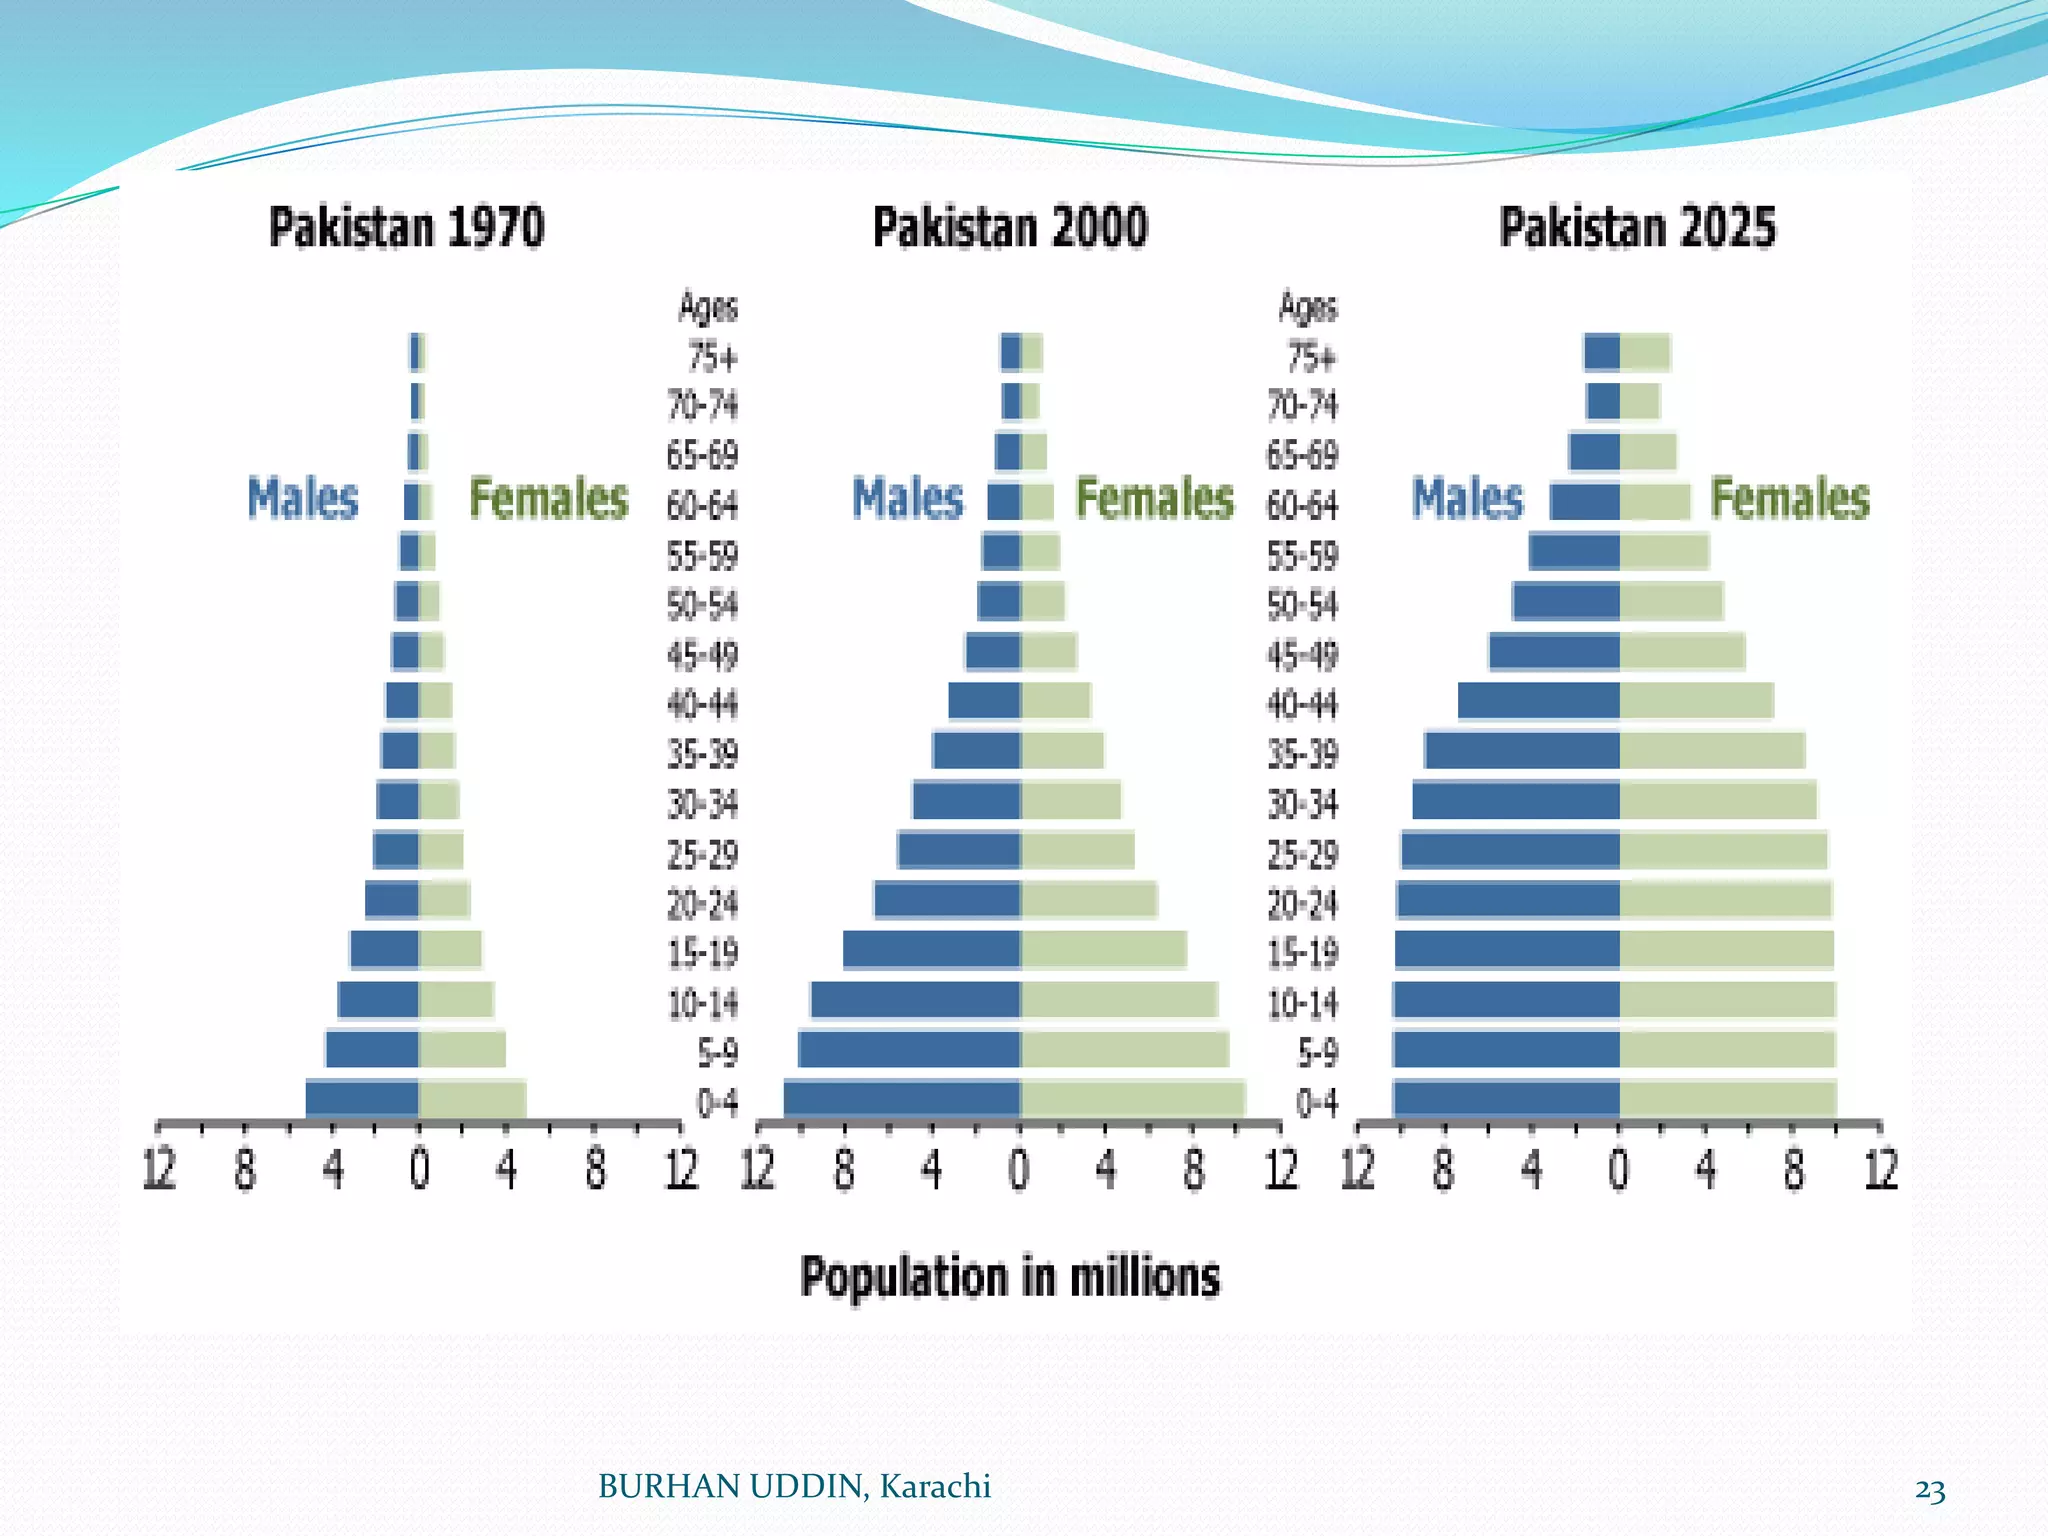
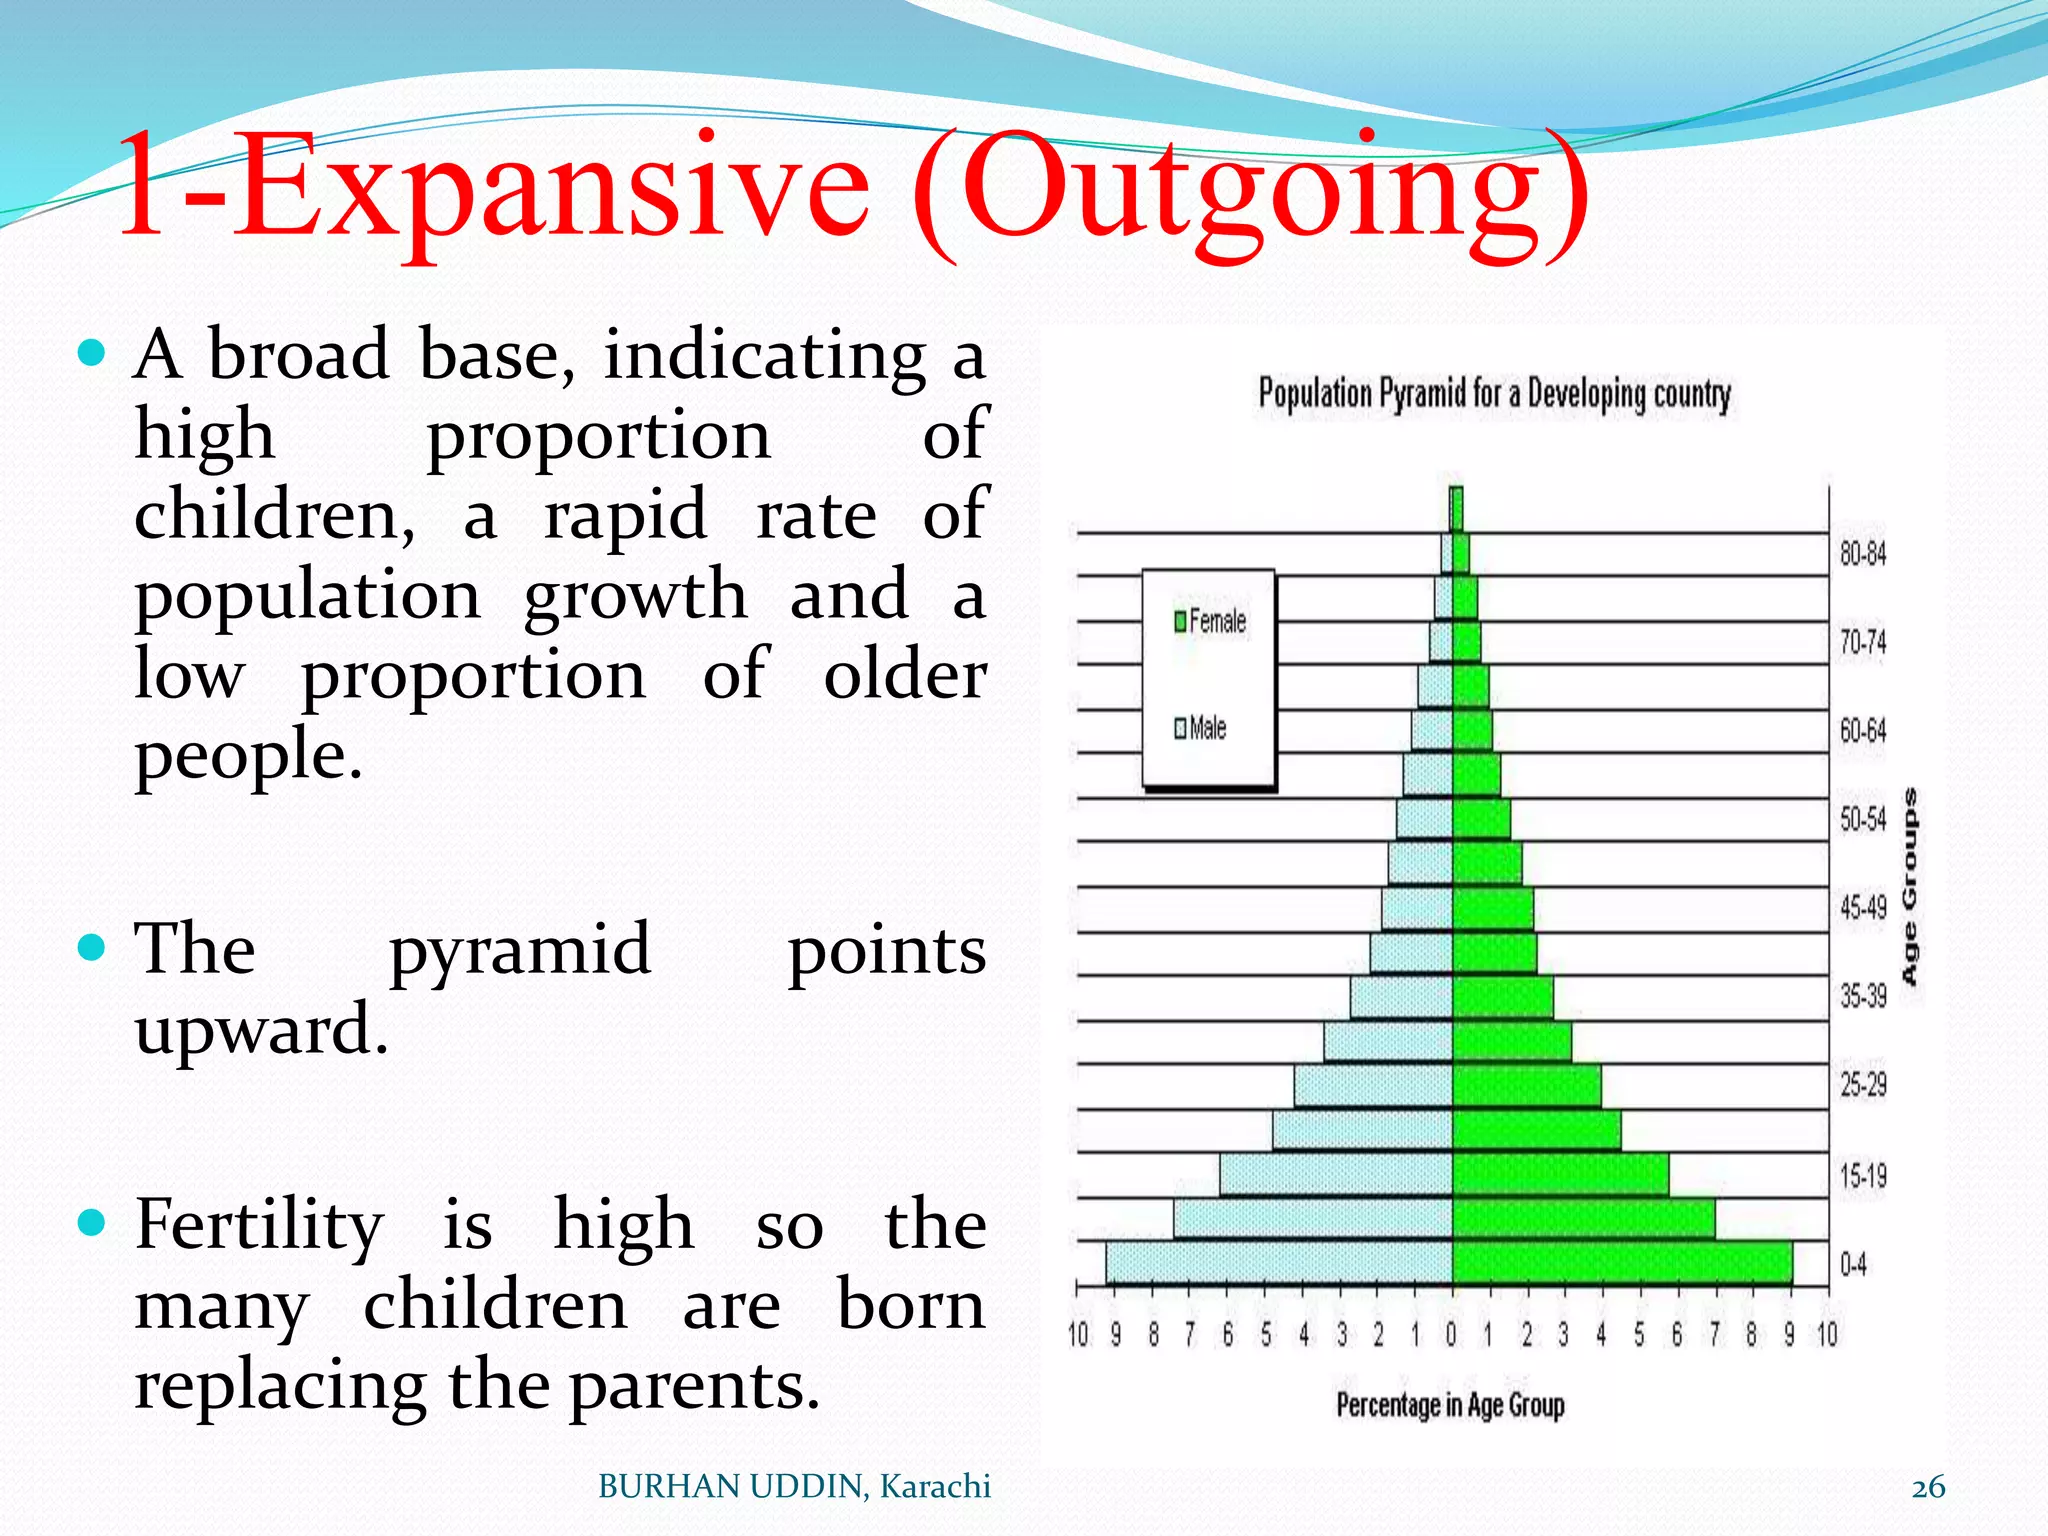
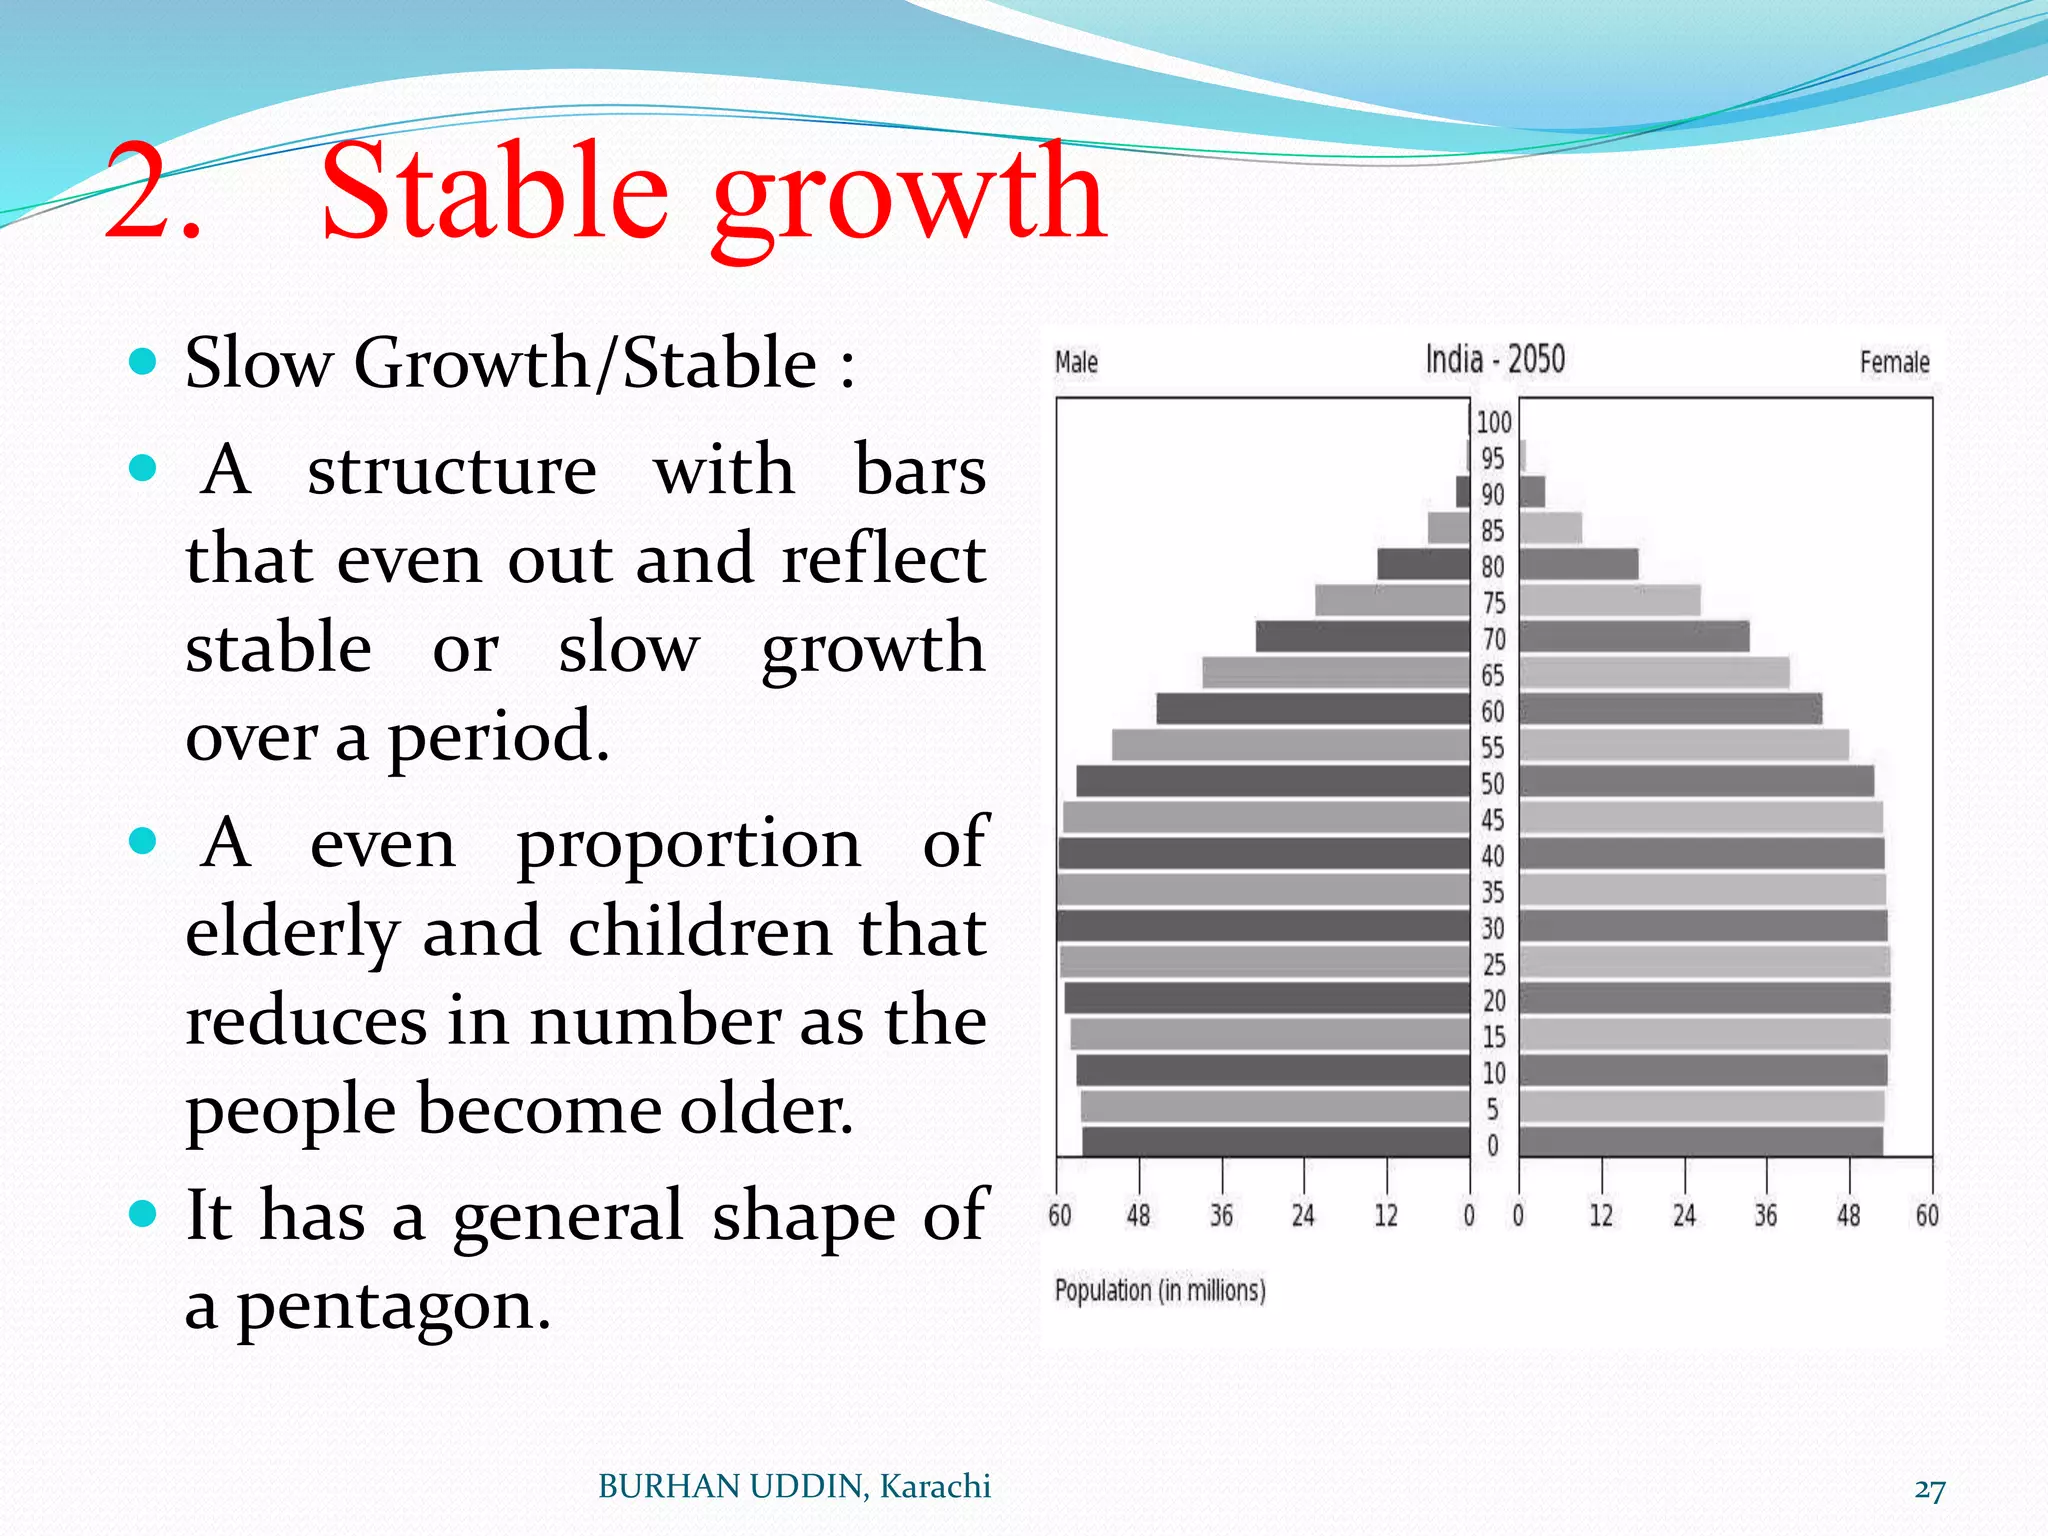
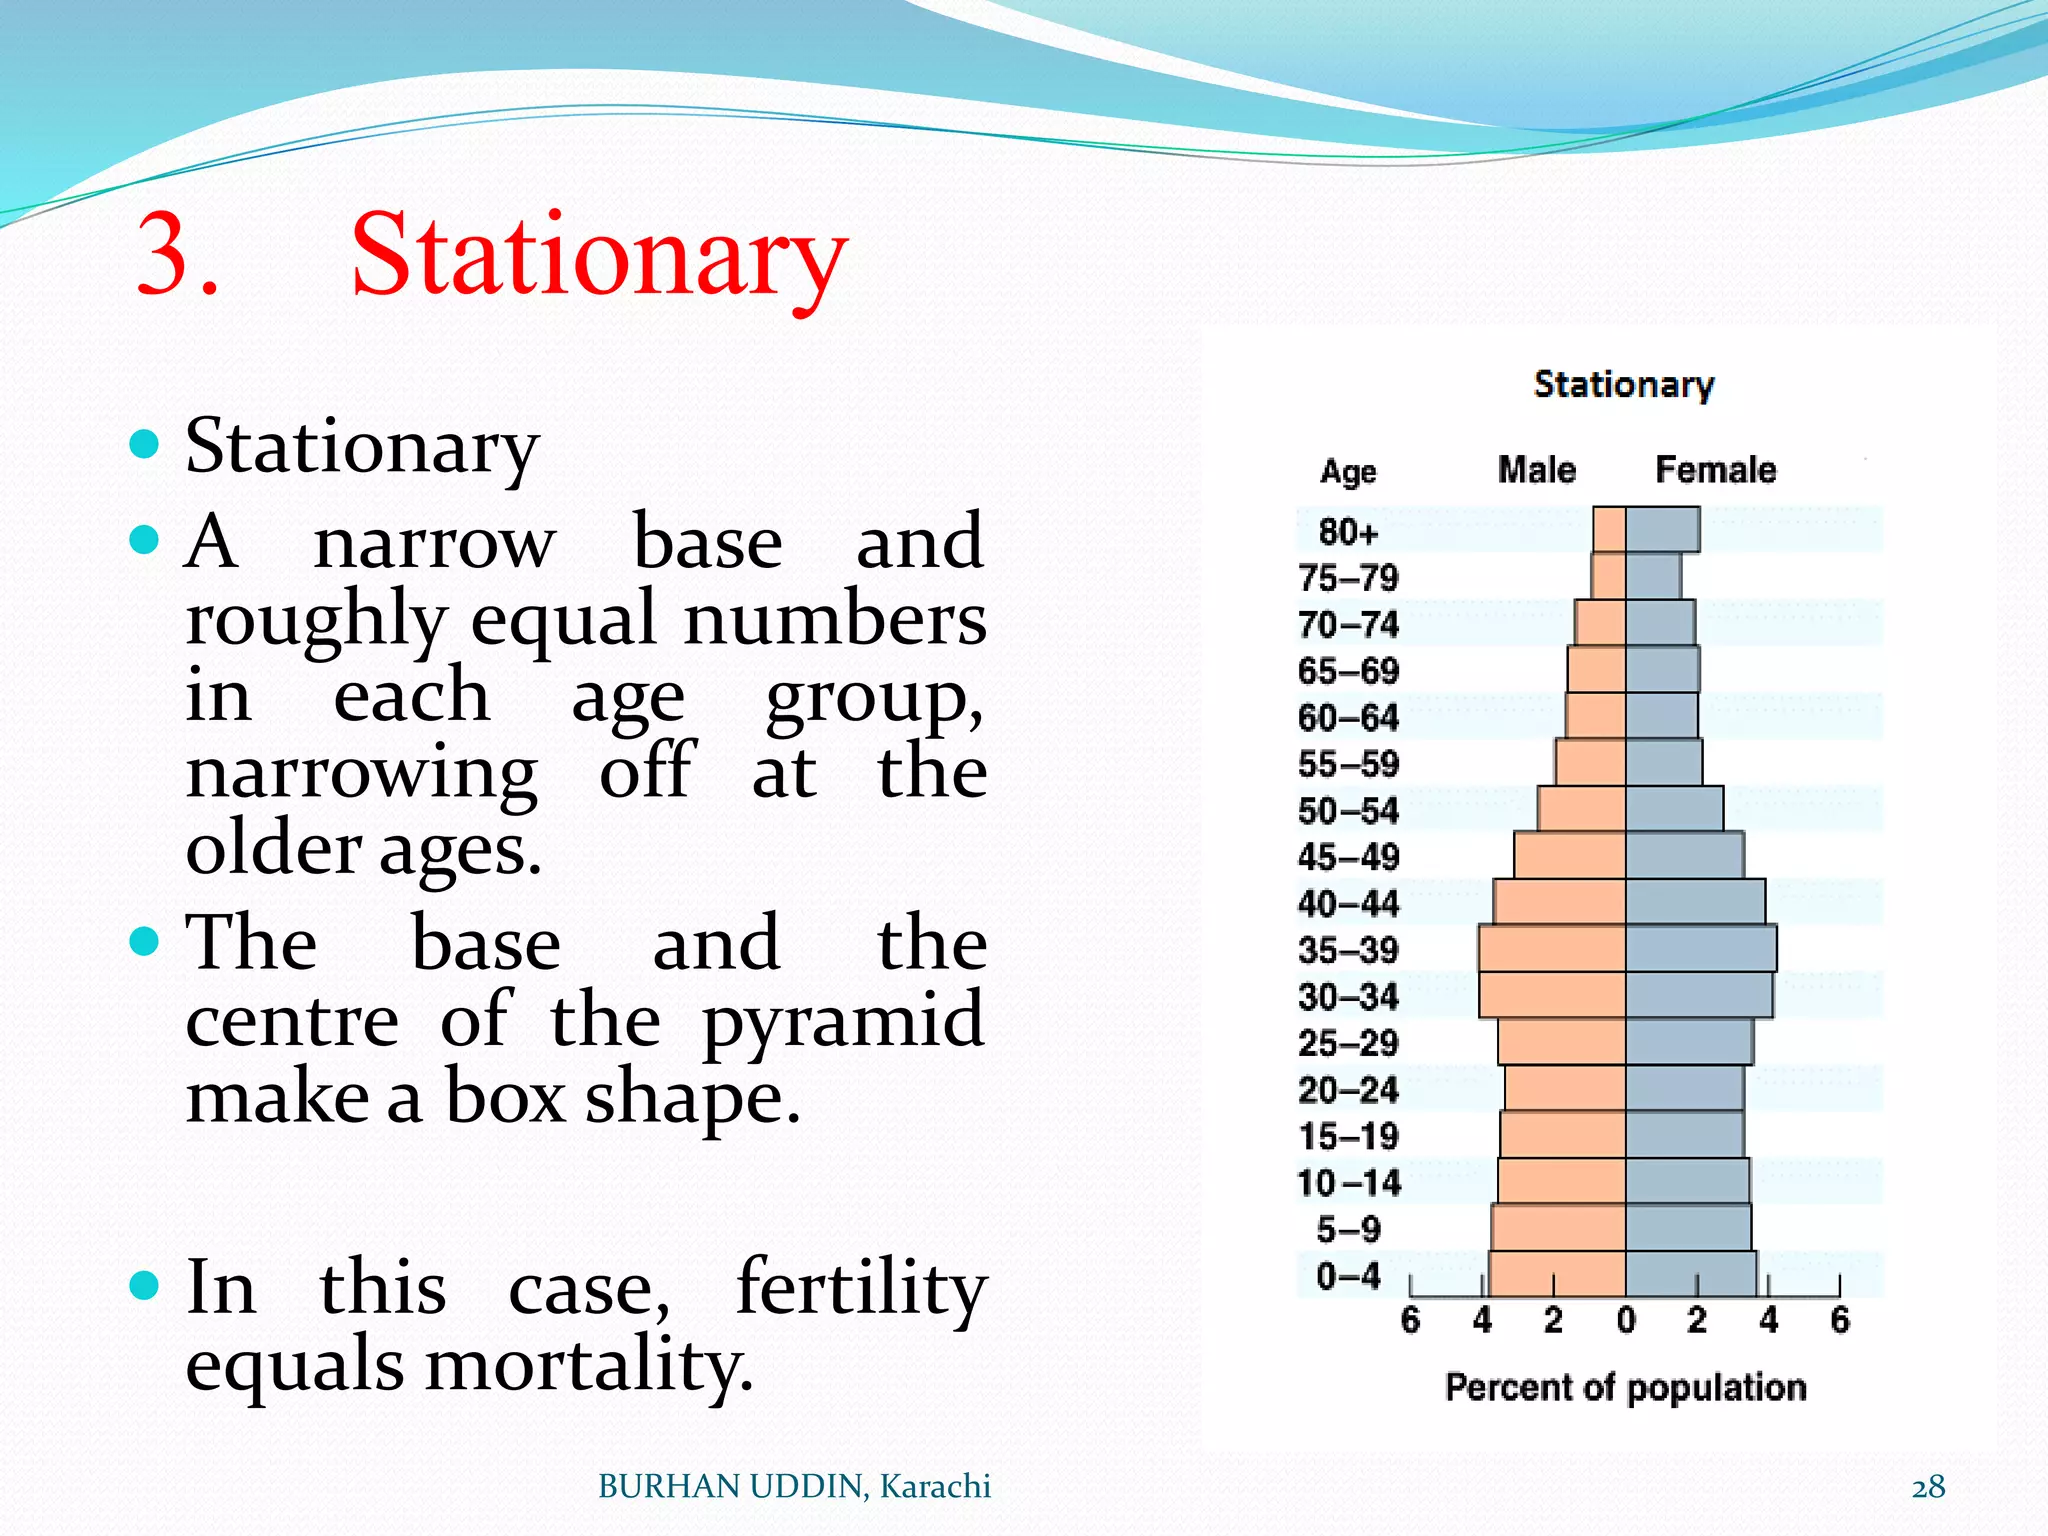
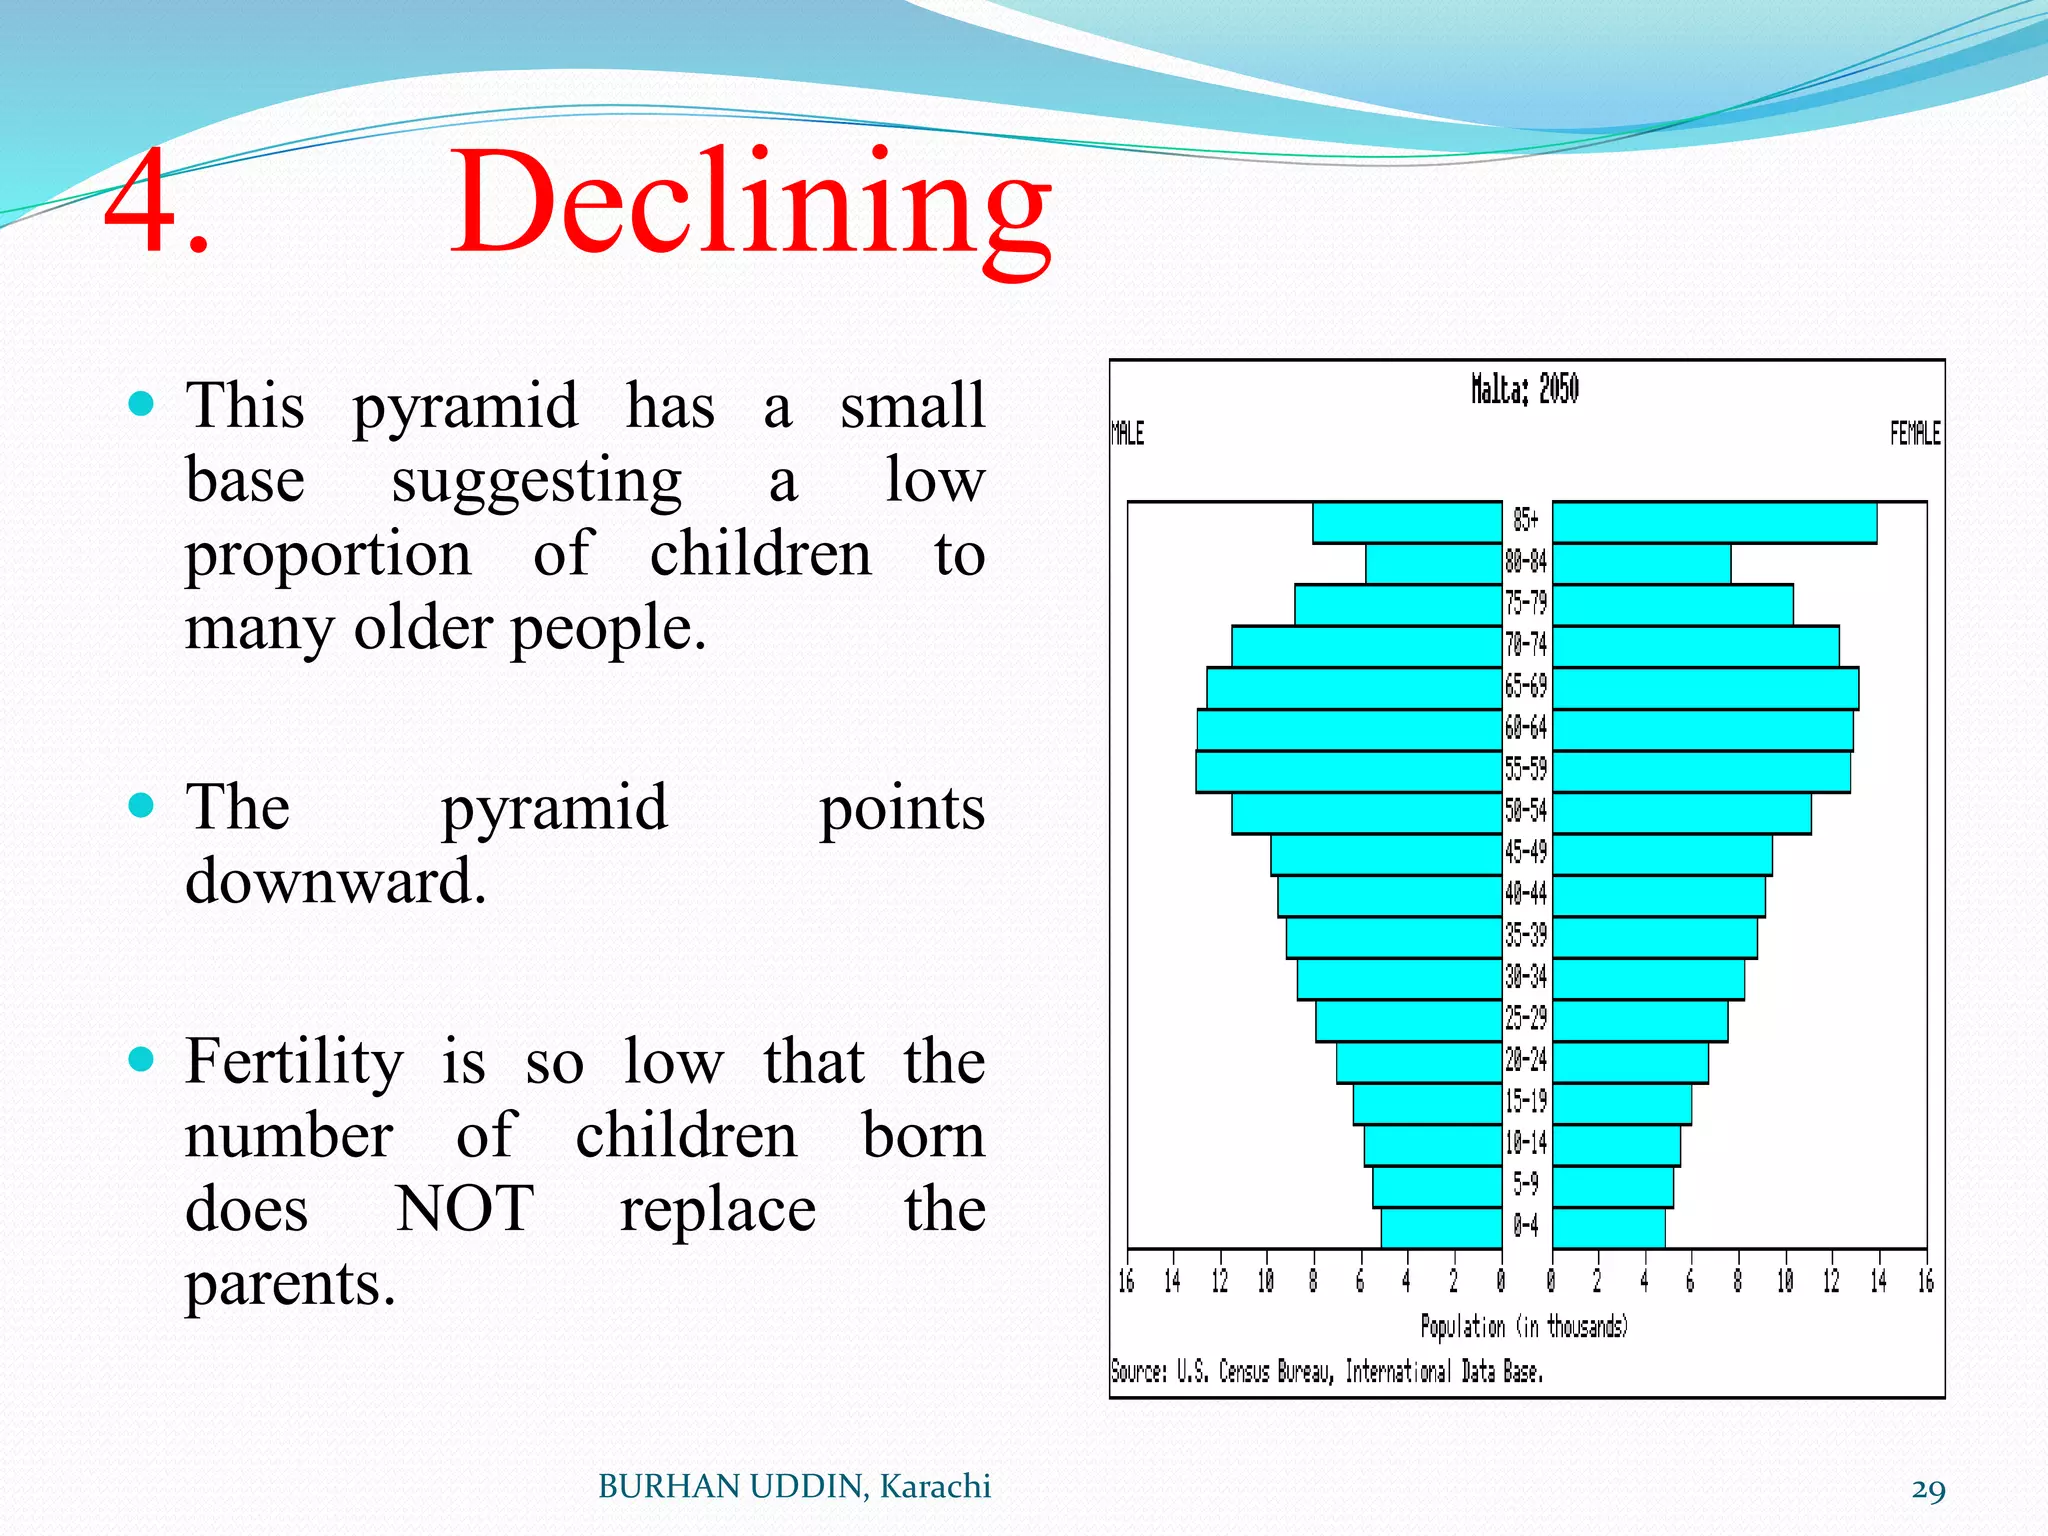
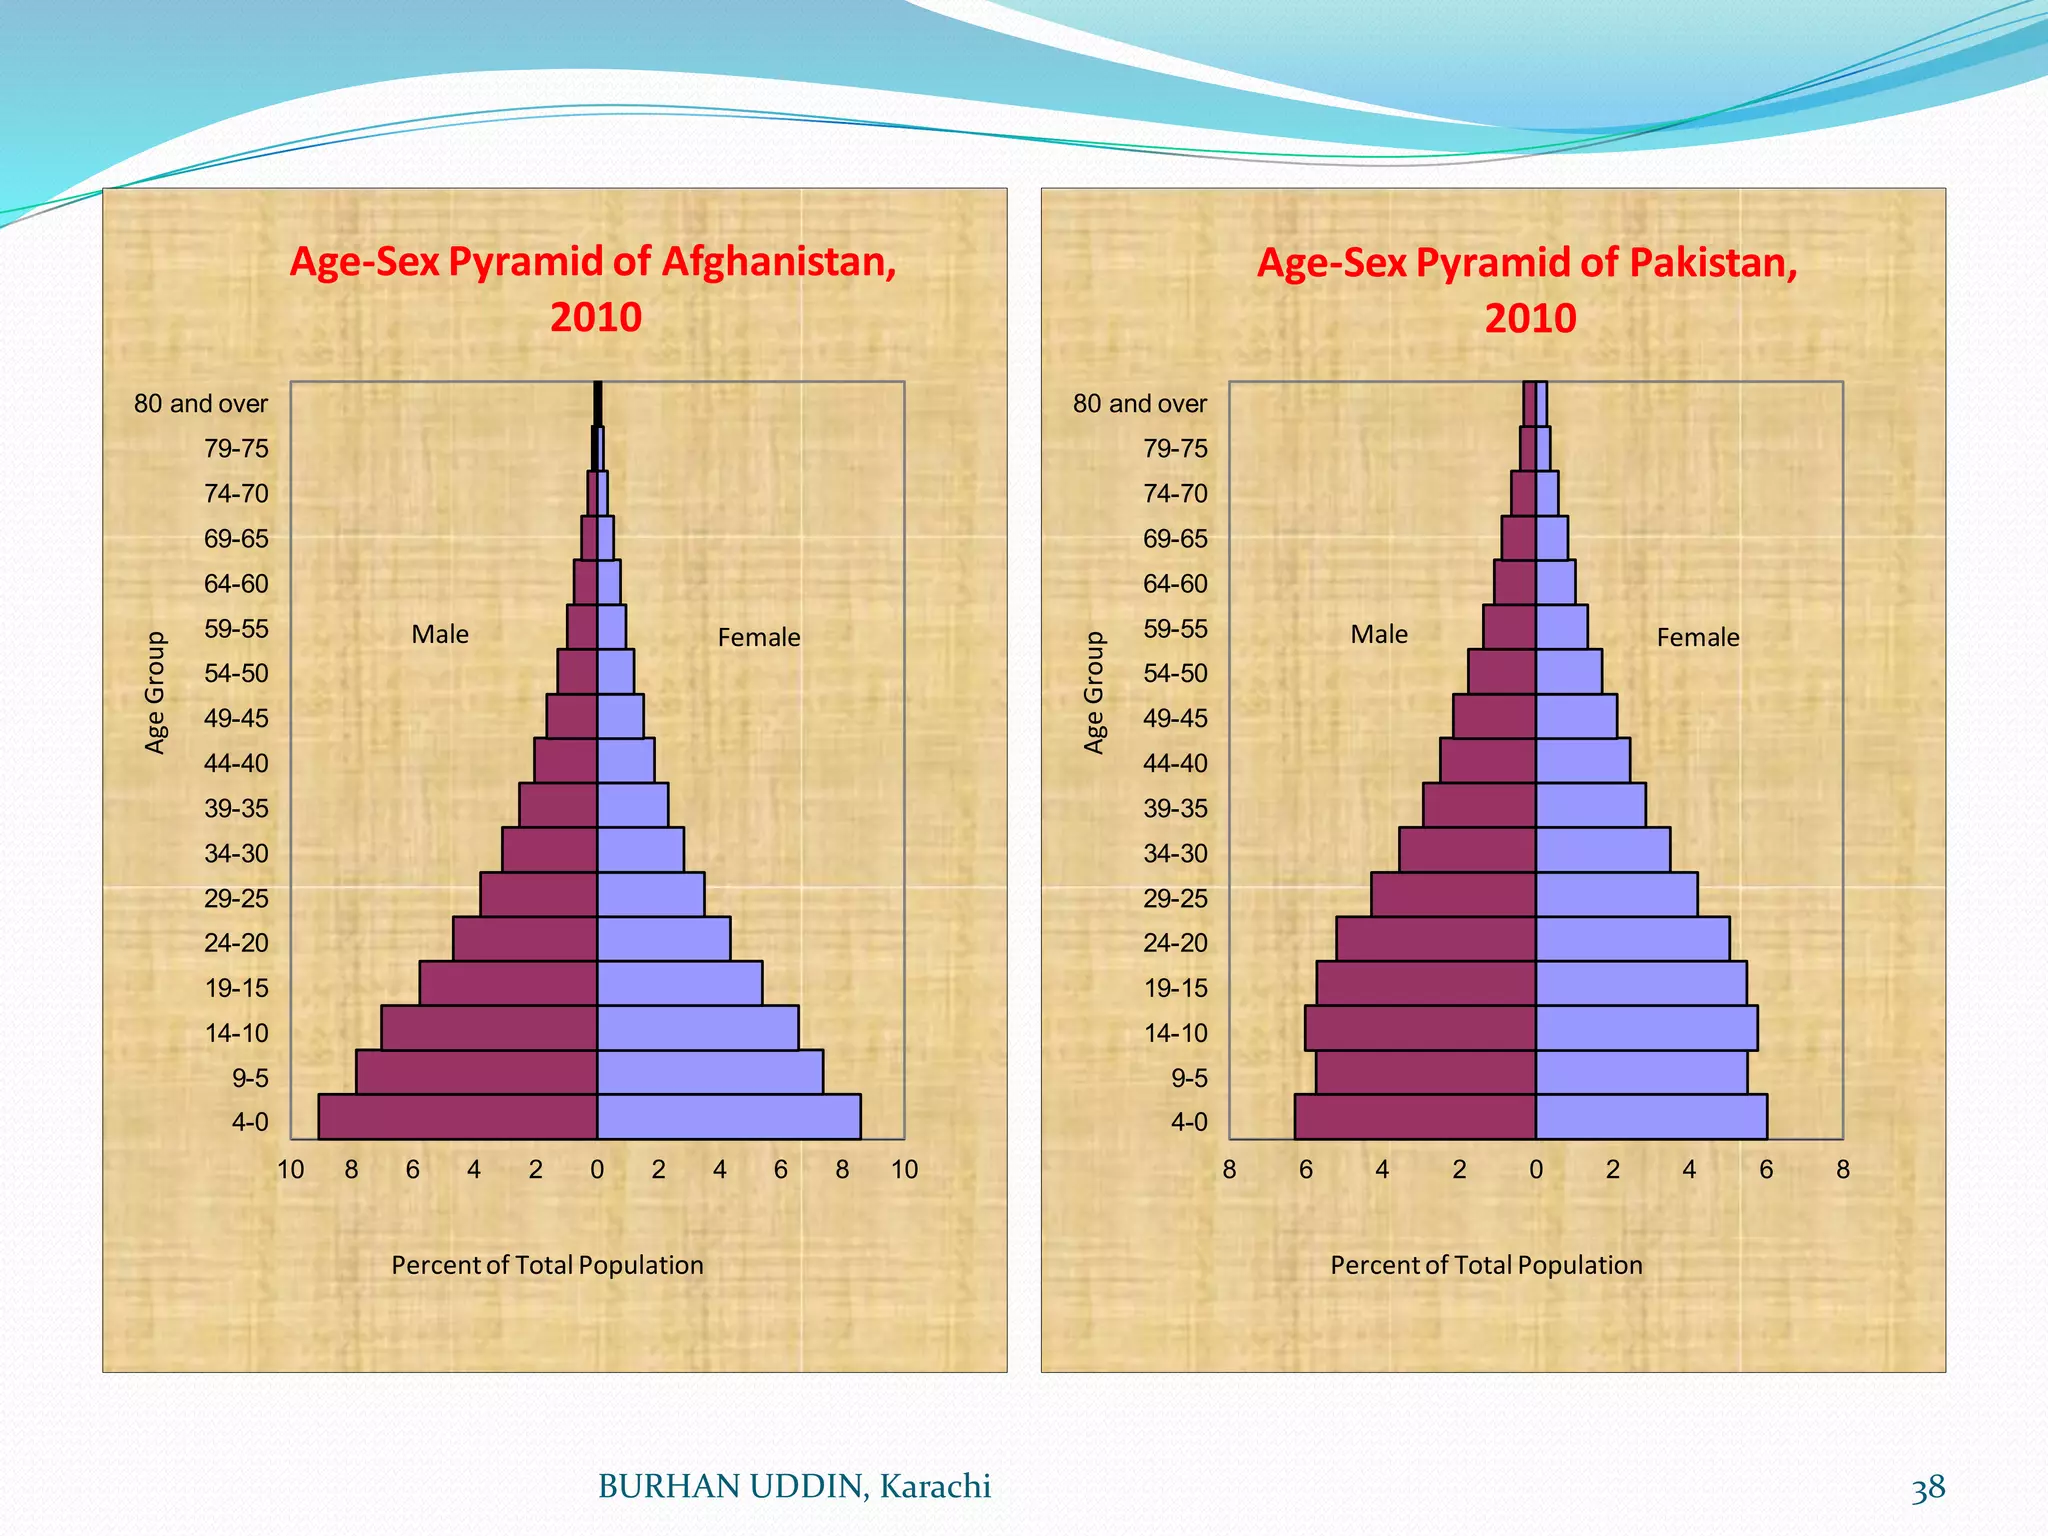


This document discusses the epidemiological transition theory, which describes how disease patterns change as populations develop from less to more developed nations. It outlines three stages of transition: 1) the age of pestilence and famine, characterized by infectious diseases; 2) the age of receding pandemics, where sanitation improvements reduced infectious diseases; and 3) the age of chronic diseases, where non-communicable diseases increase. Population pyramids and their shapes representing growth stages are also examined. Factors influencing population changes like birth rates, death rates, and sex ratios are defined.