Downloaded 421 times

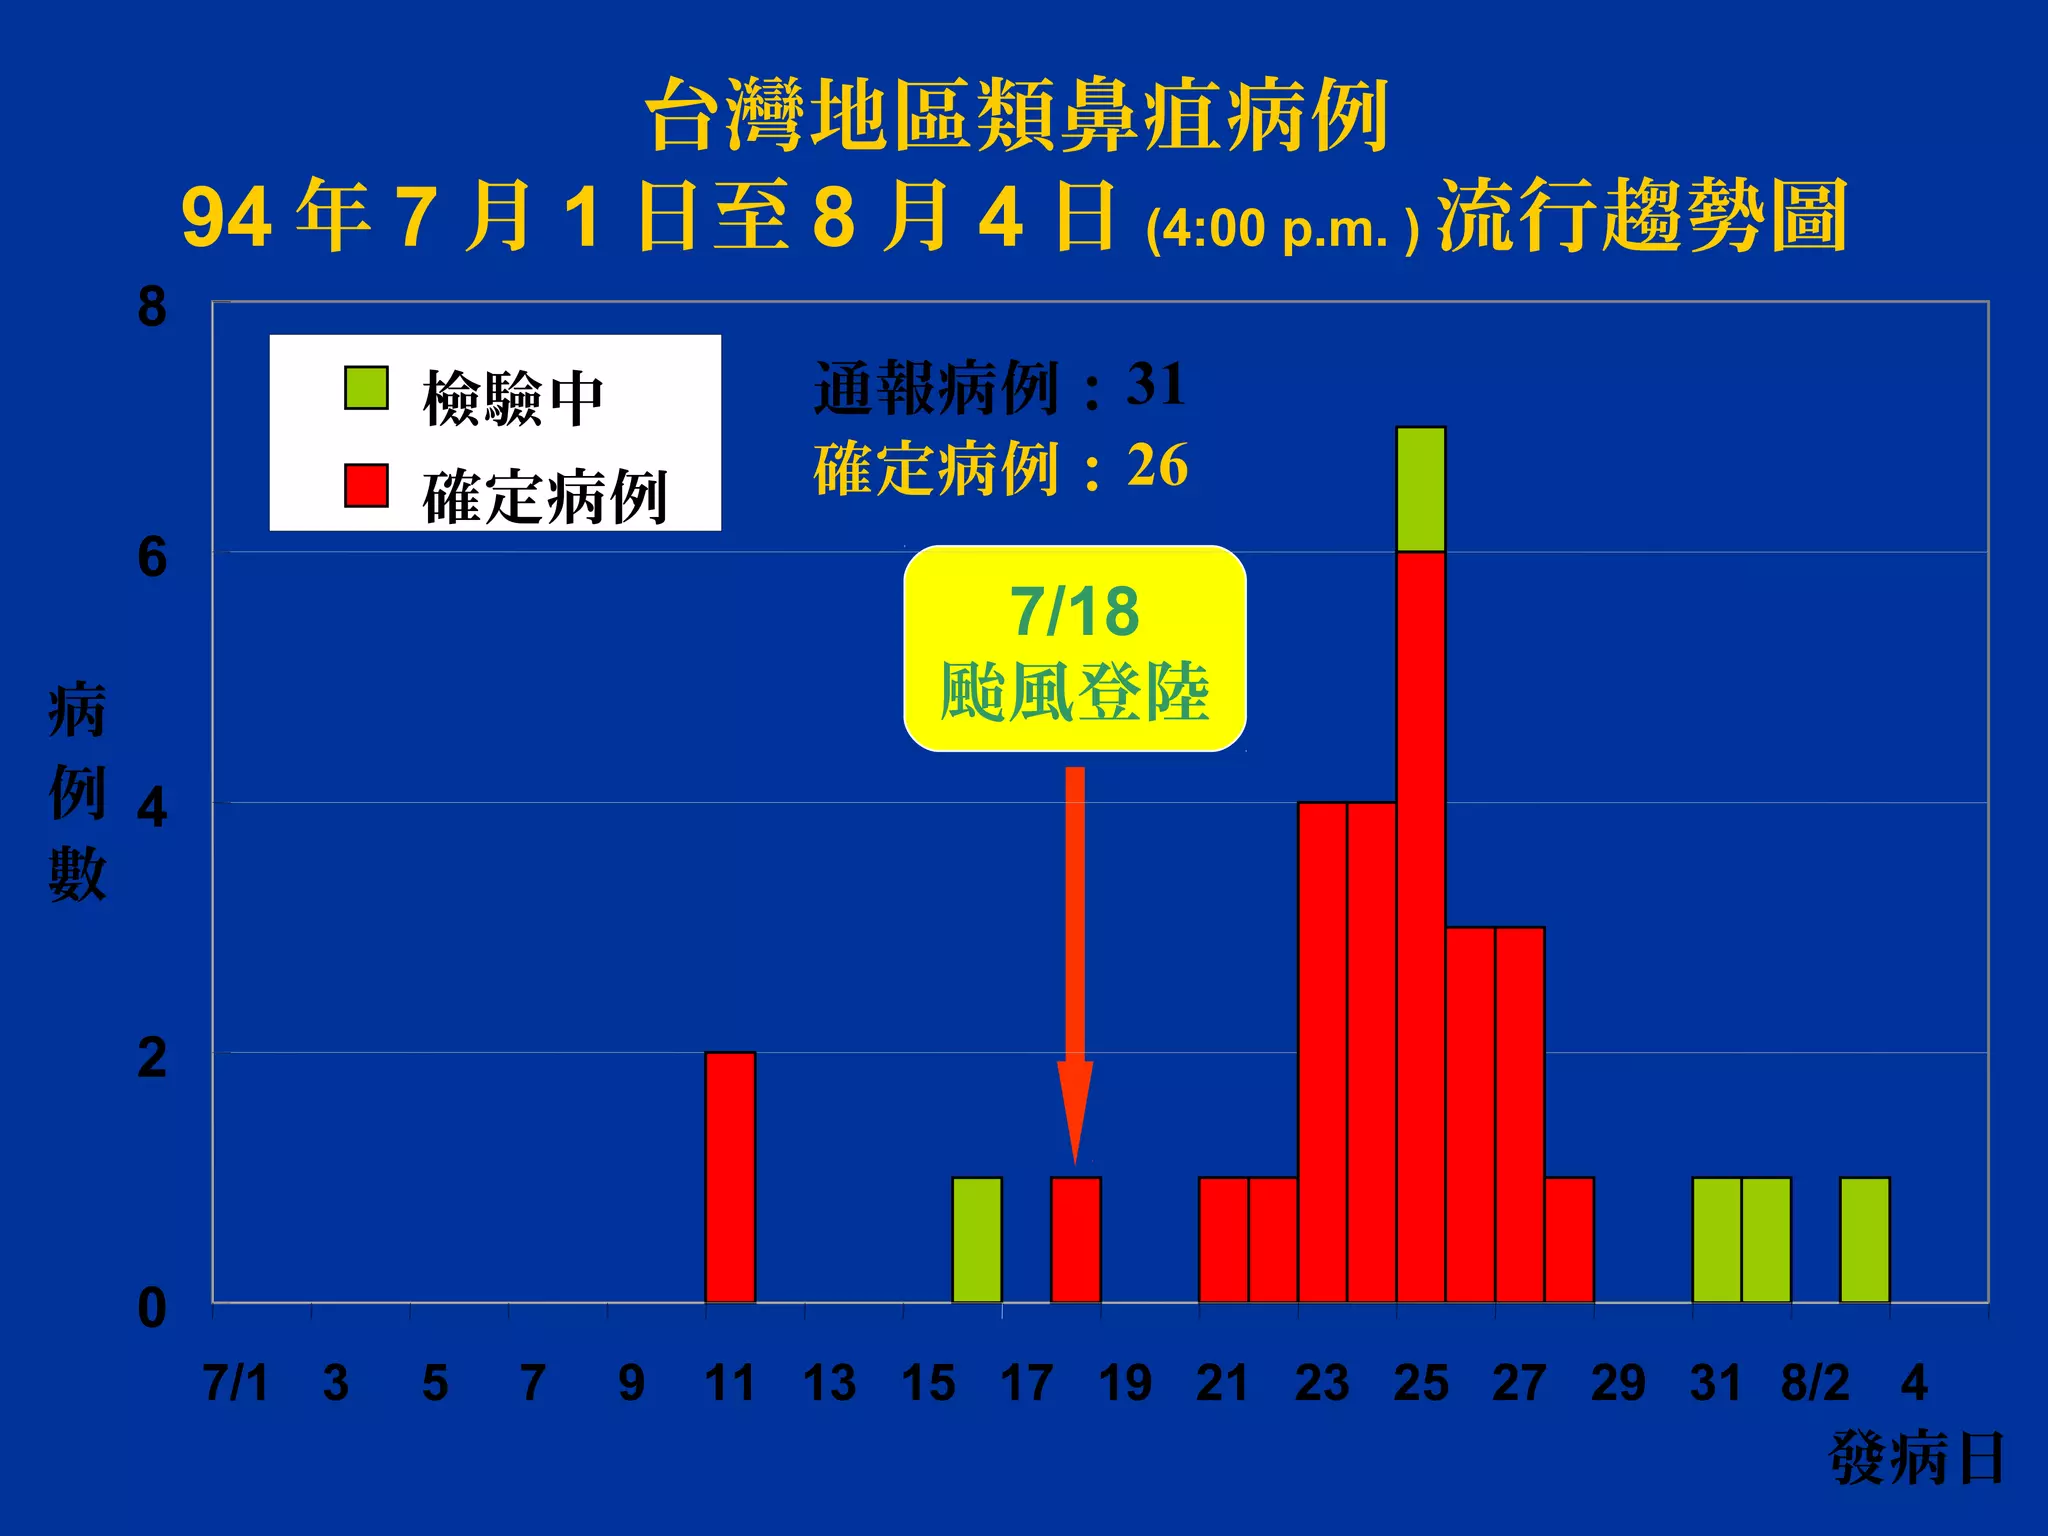
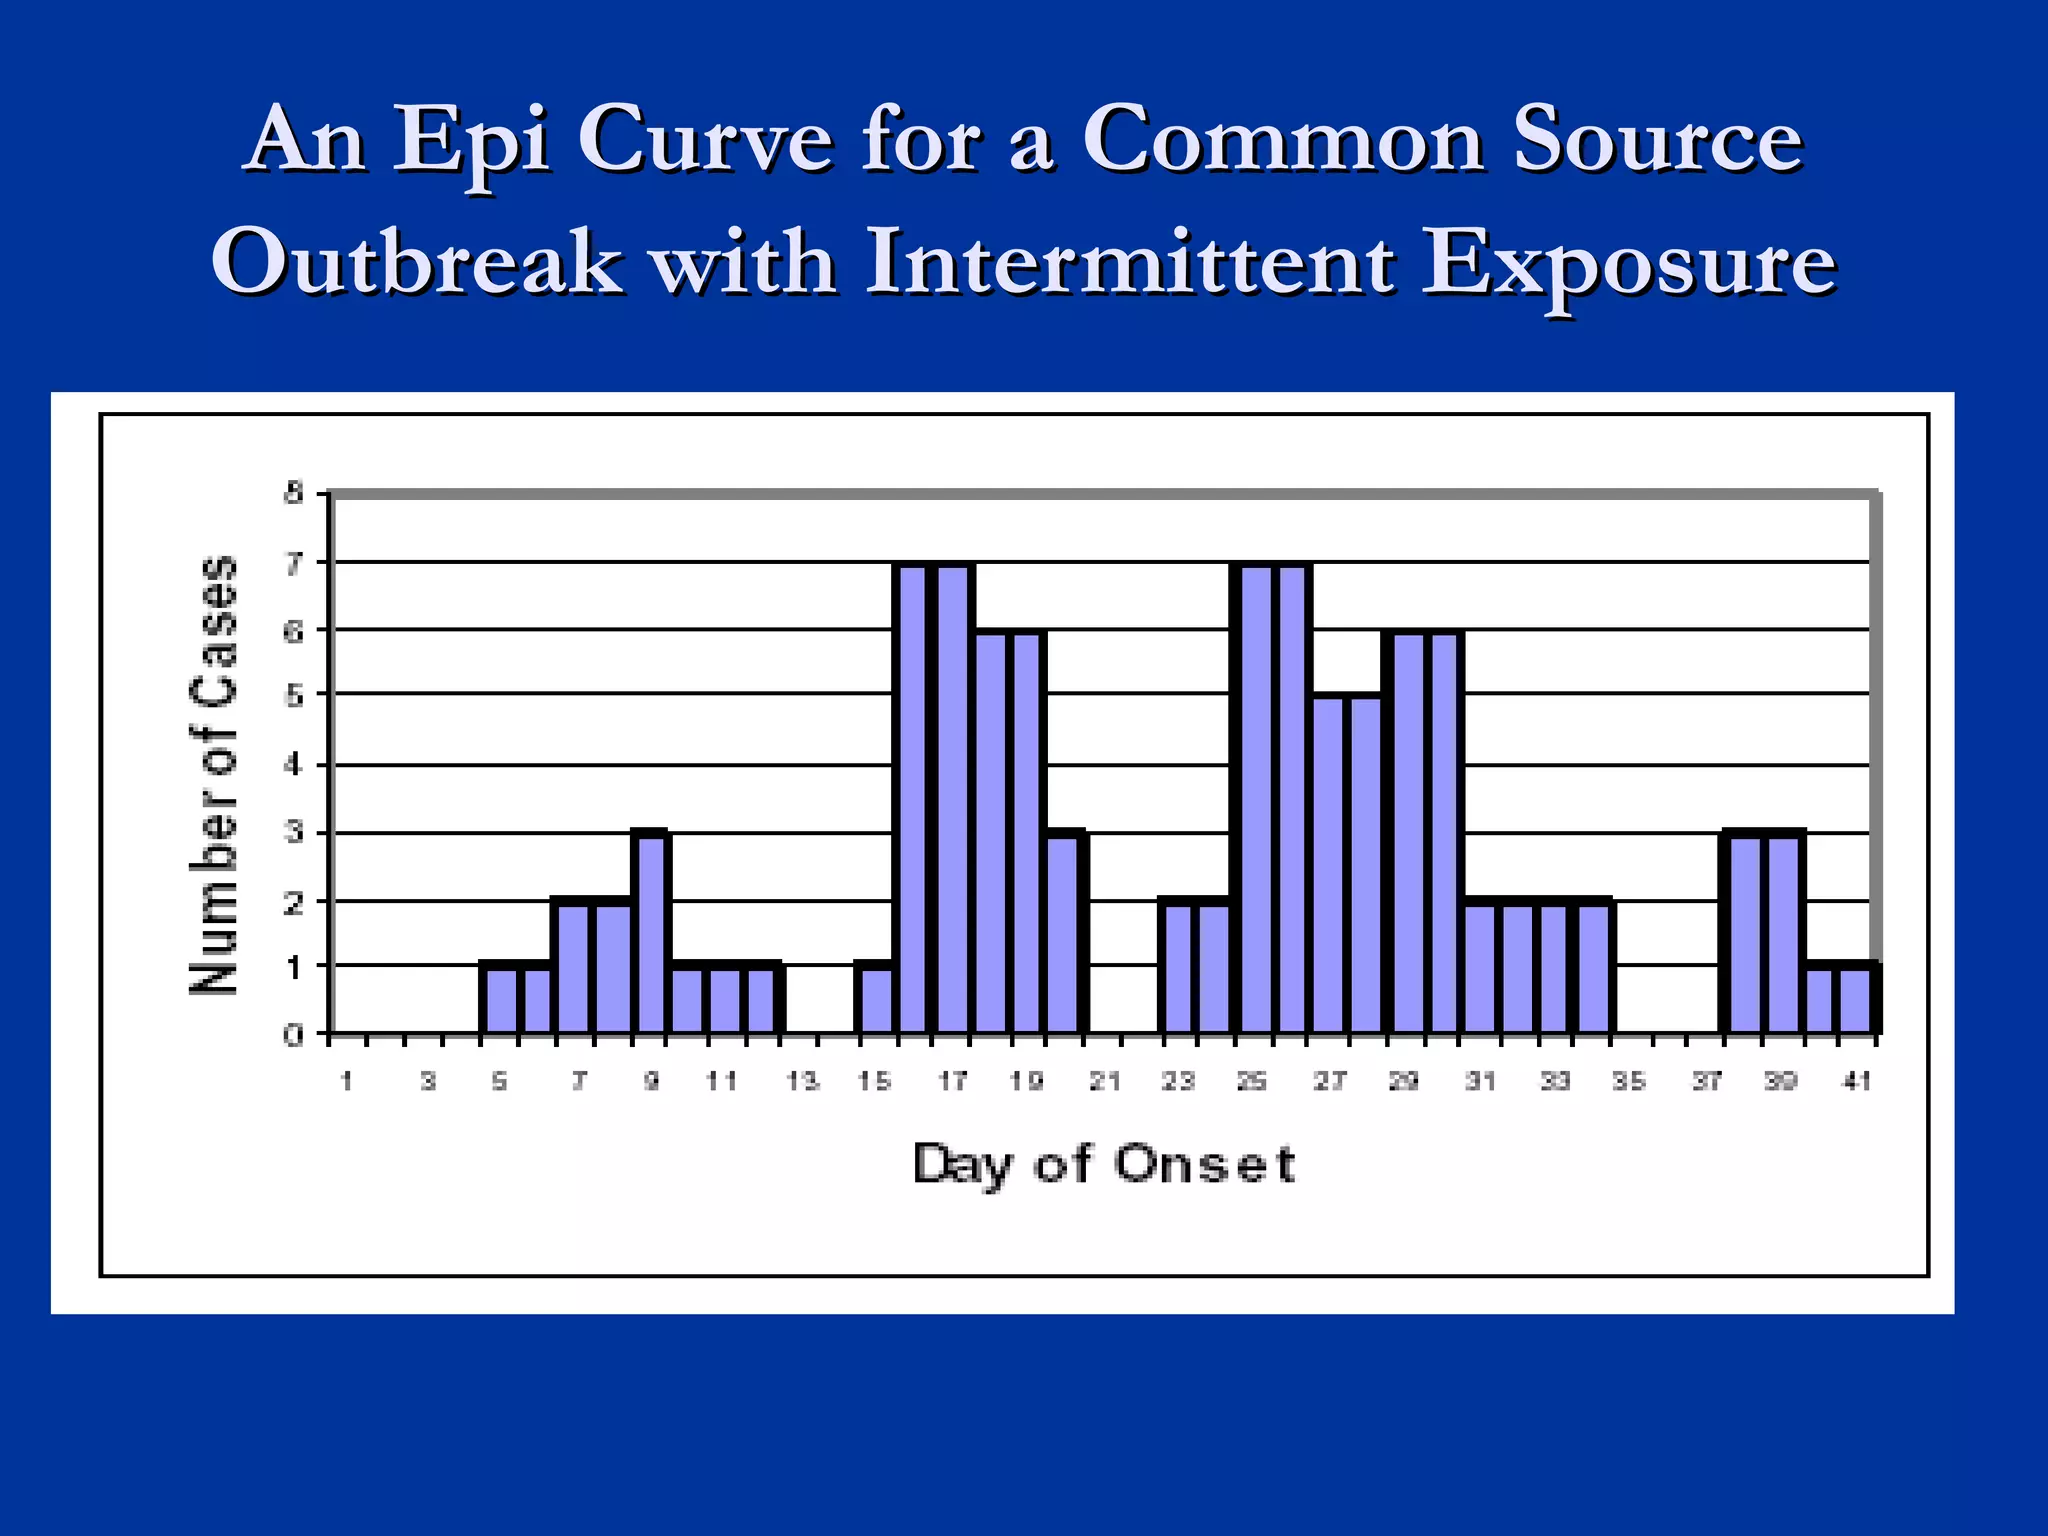

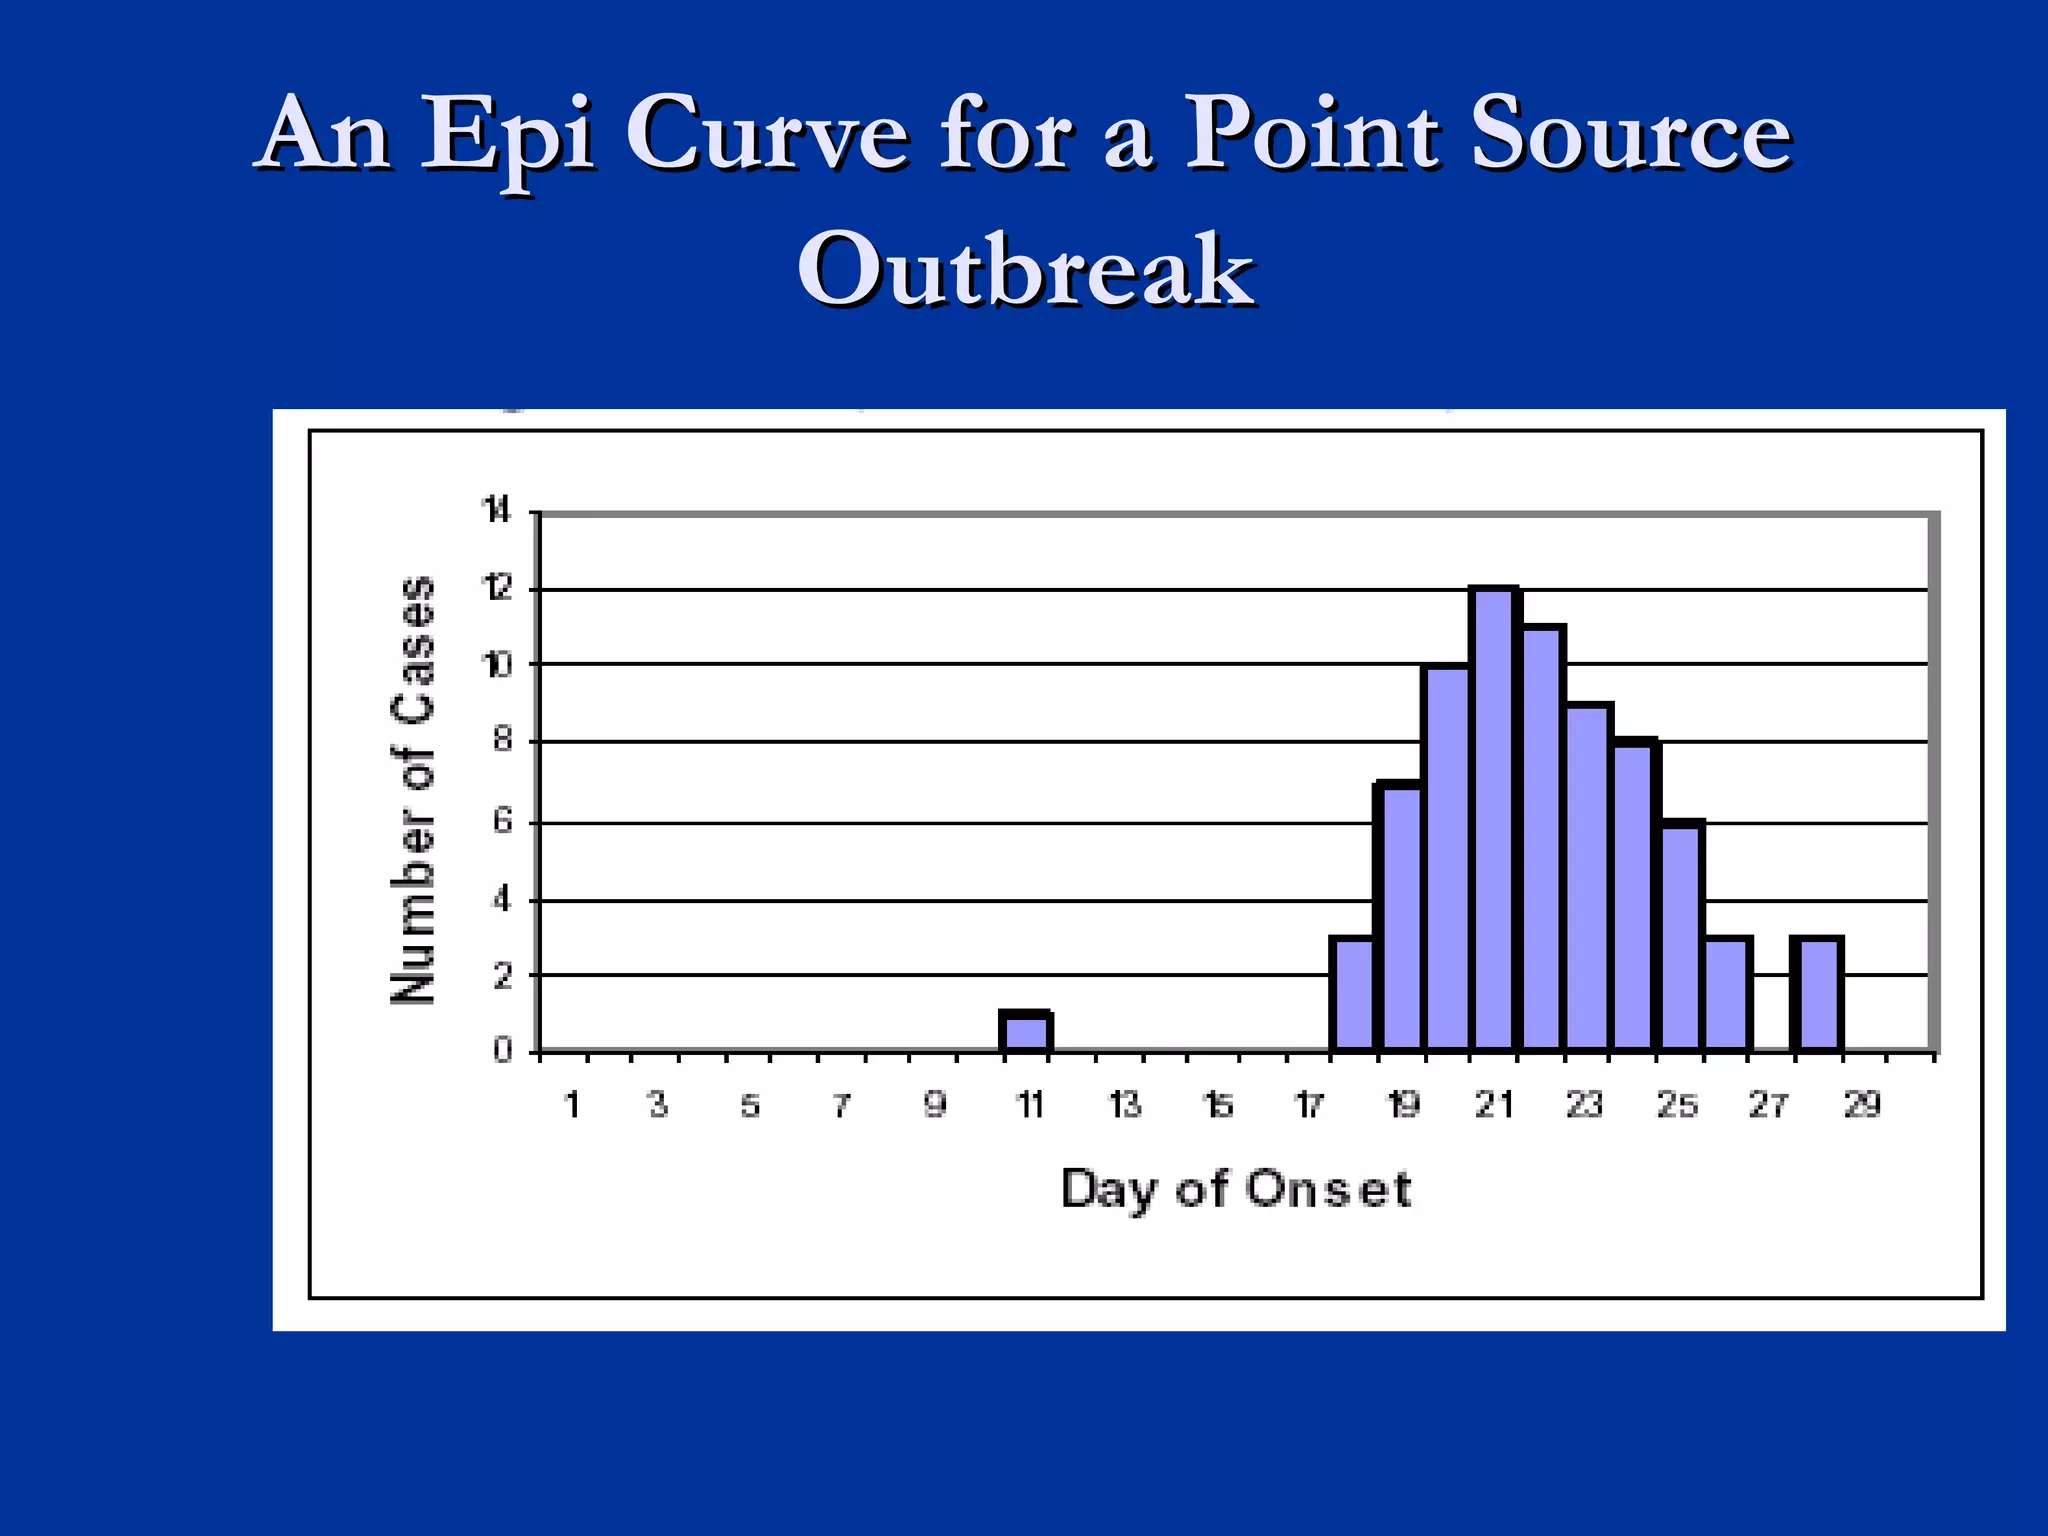

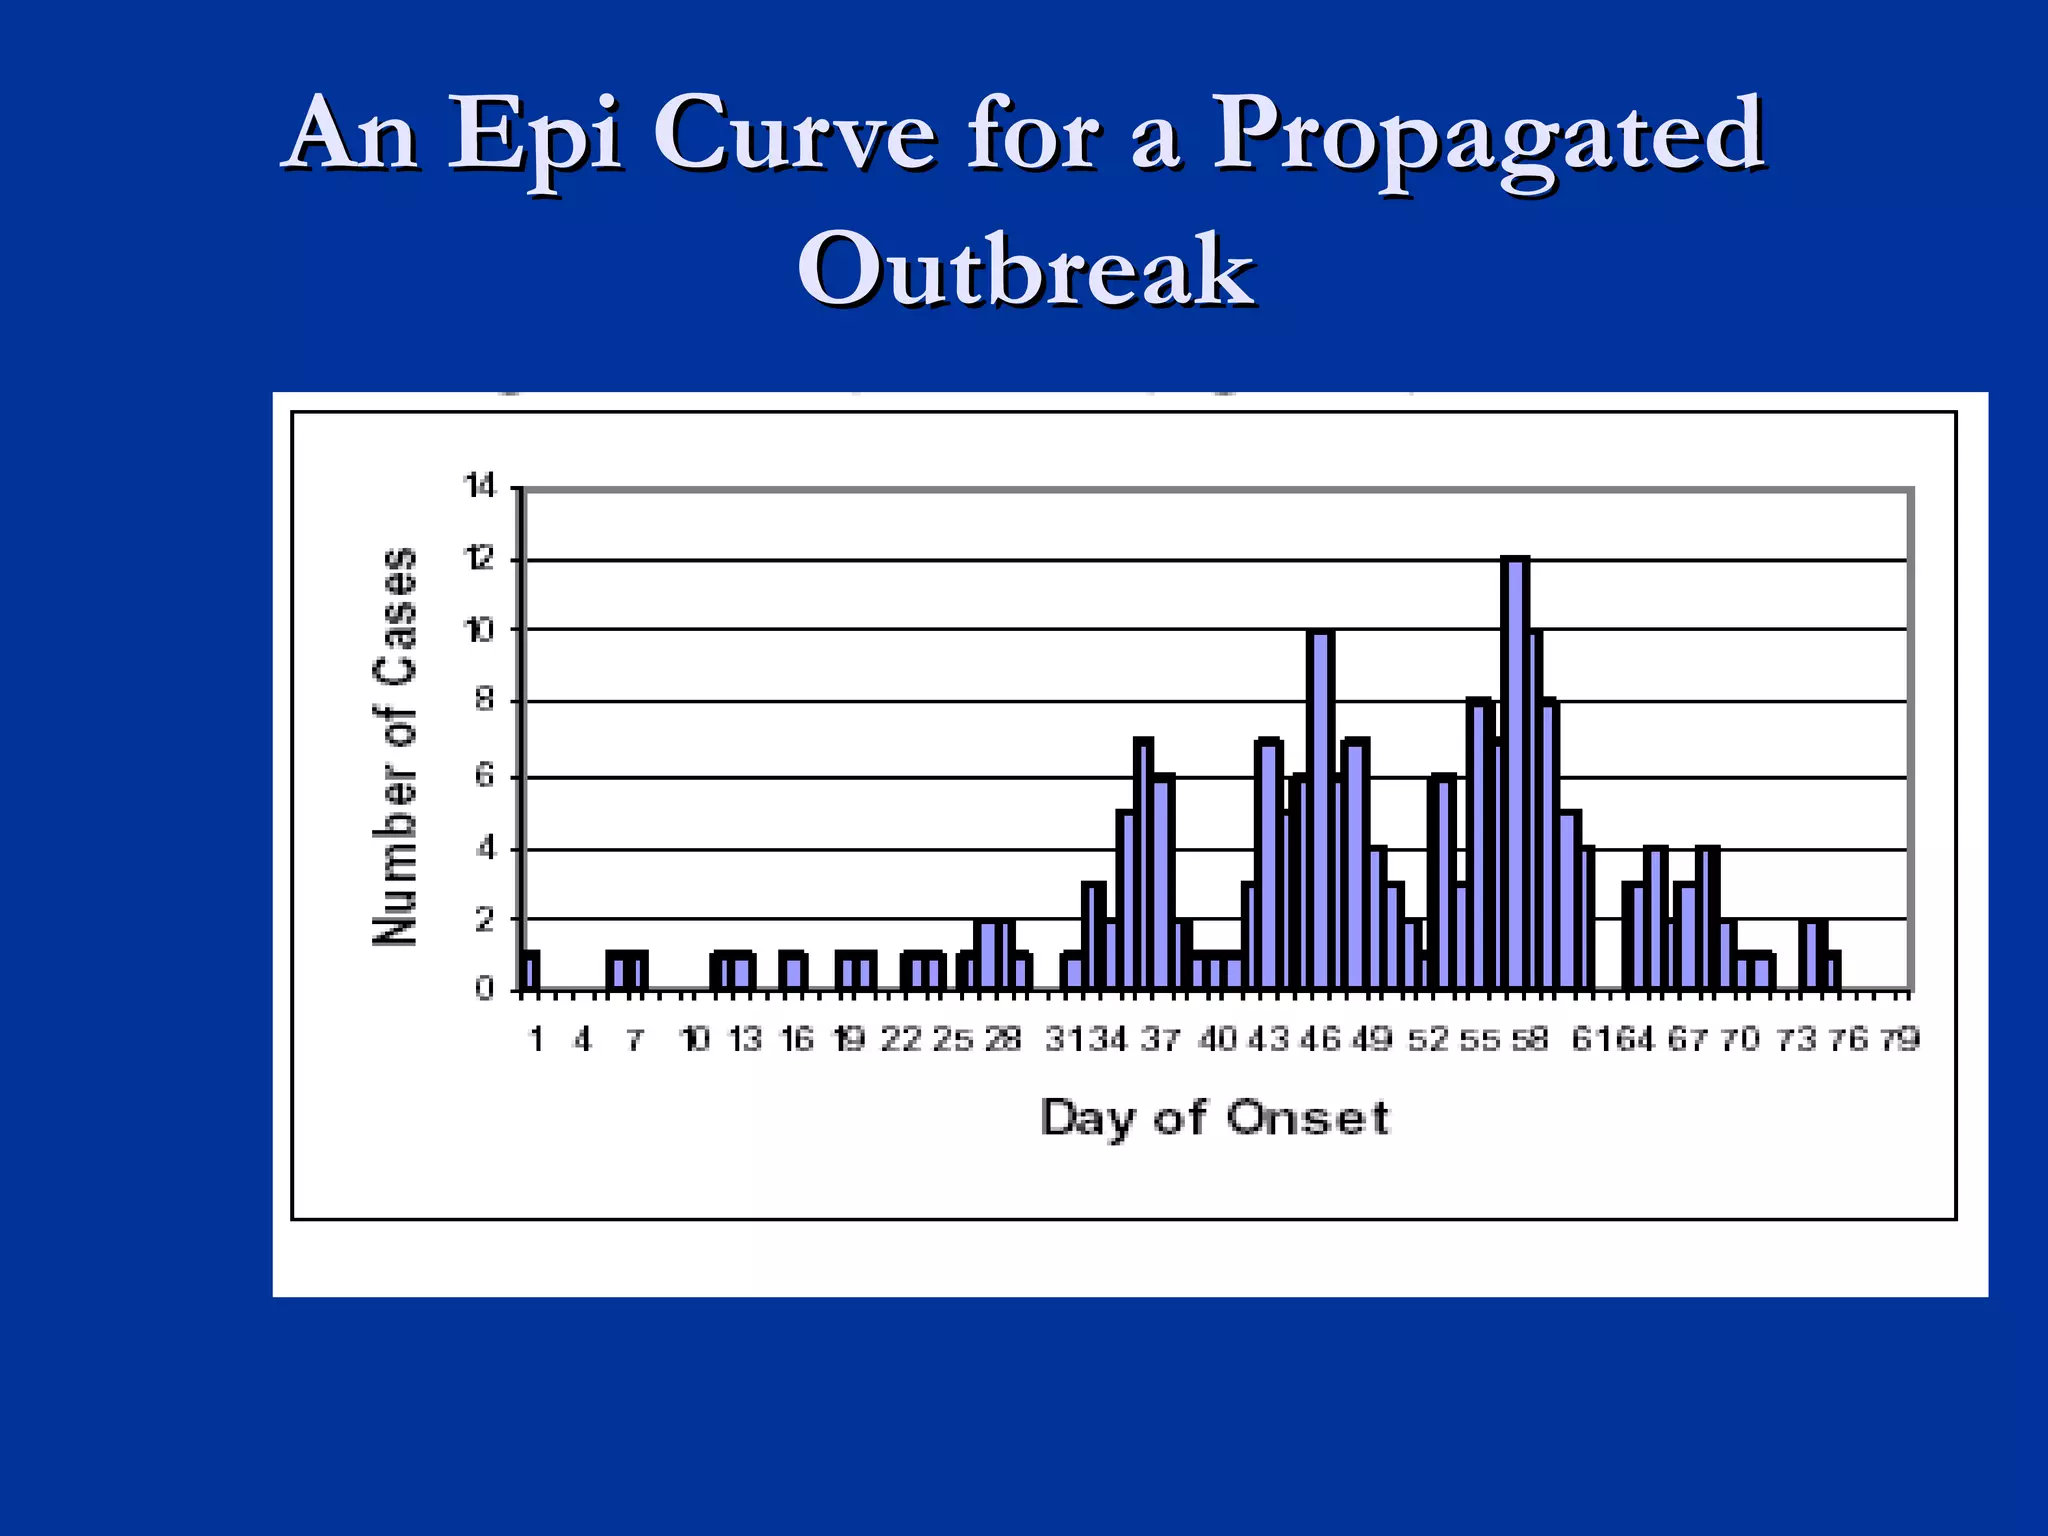

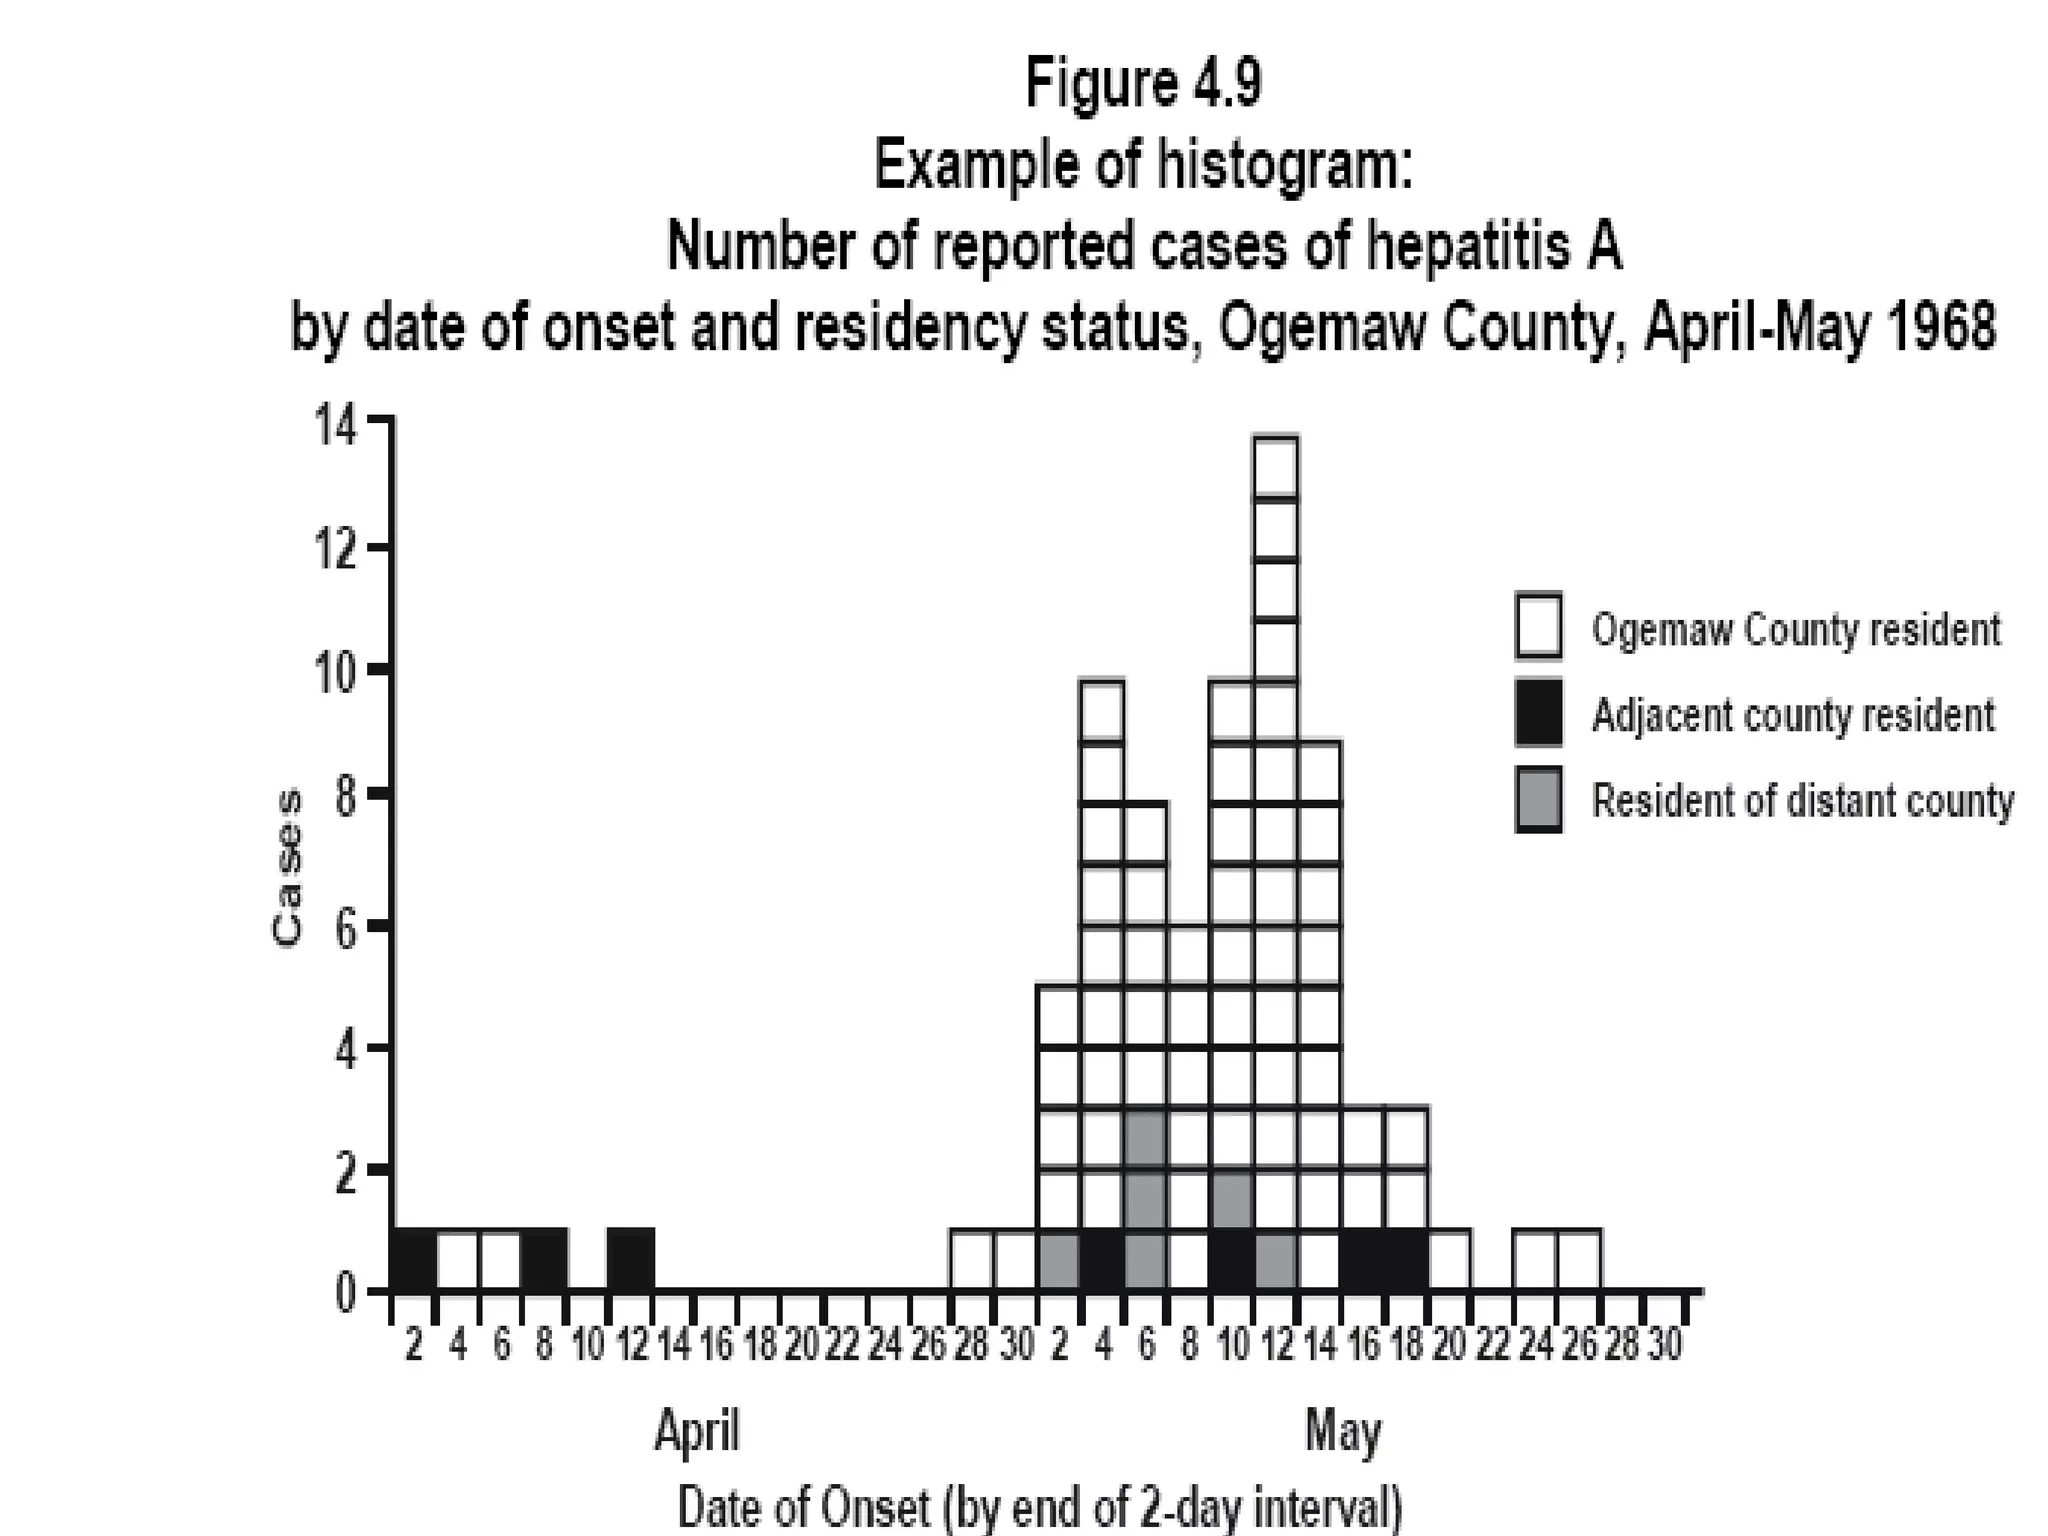


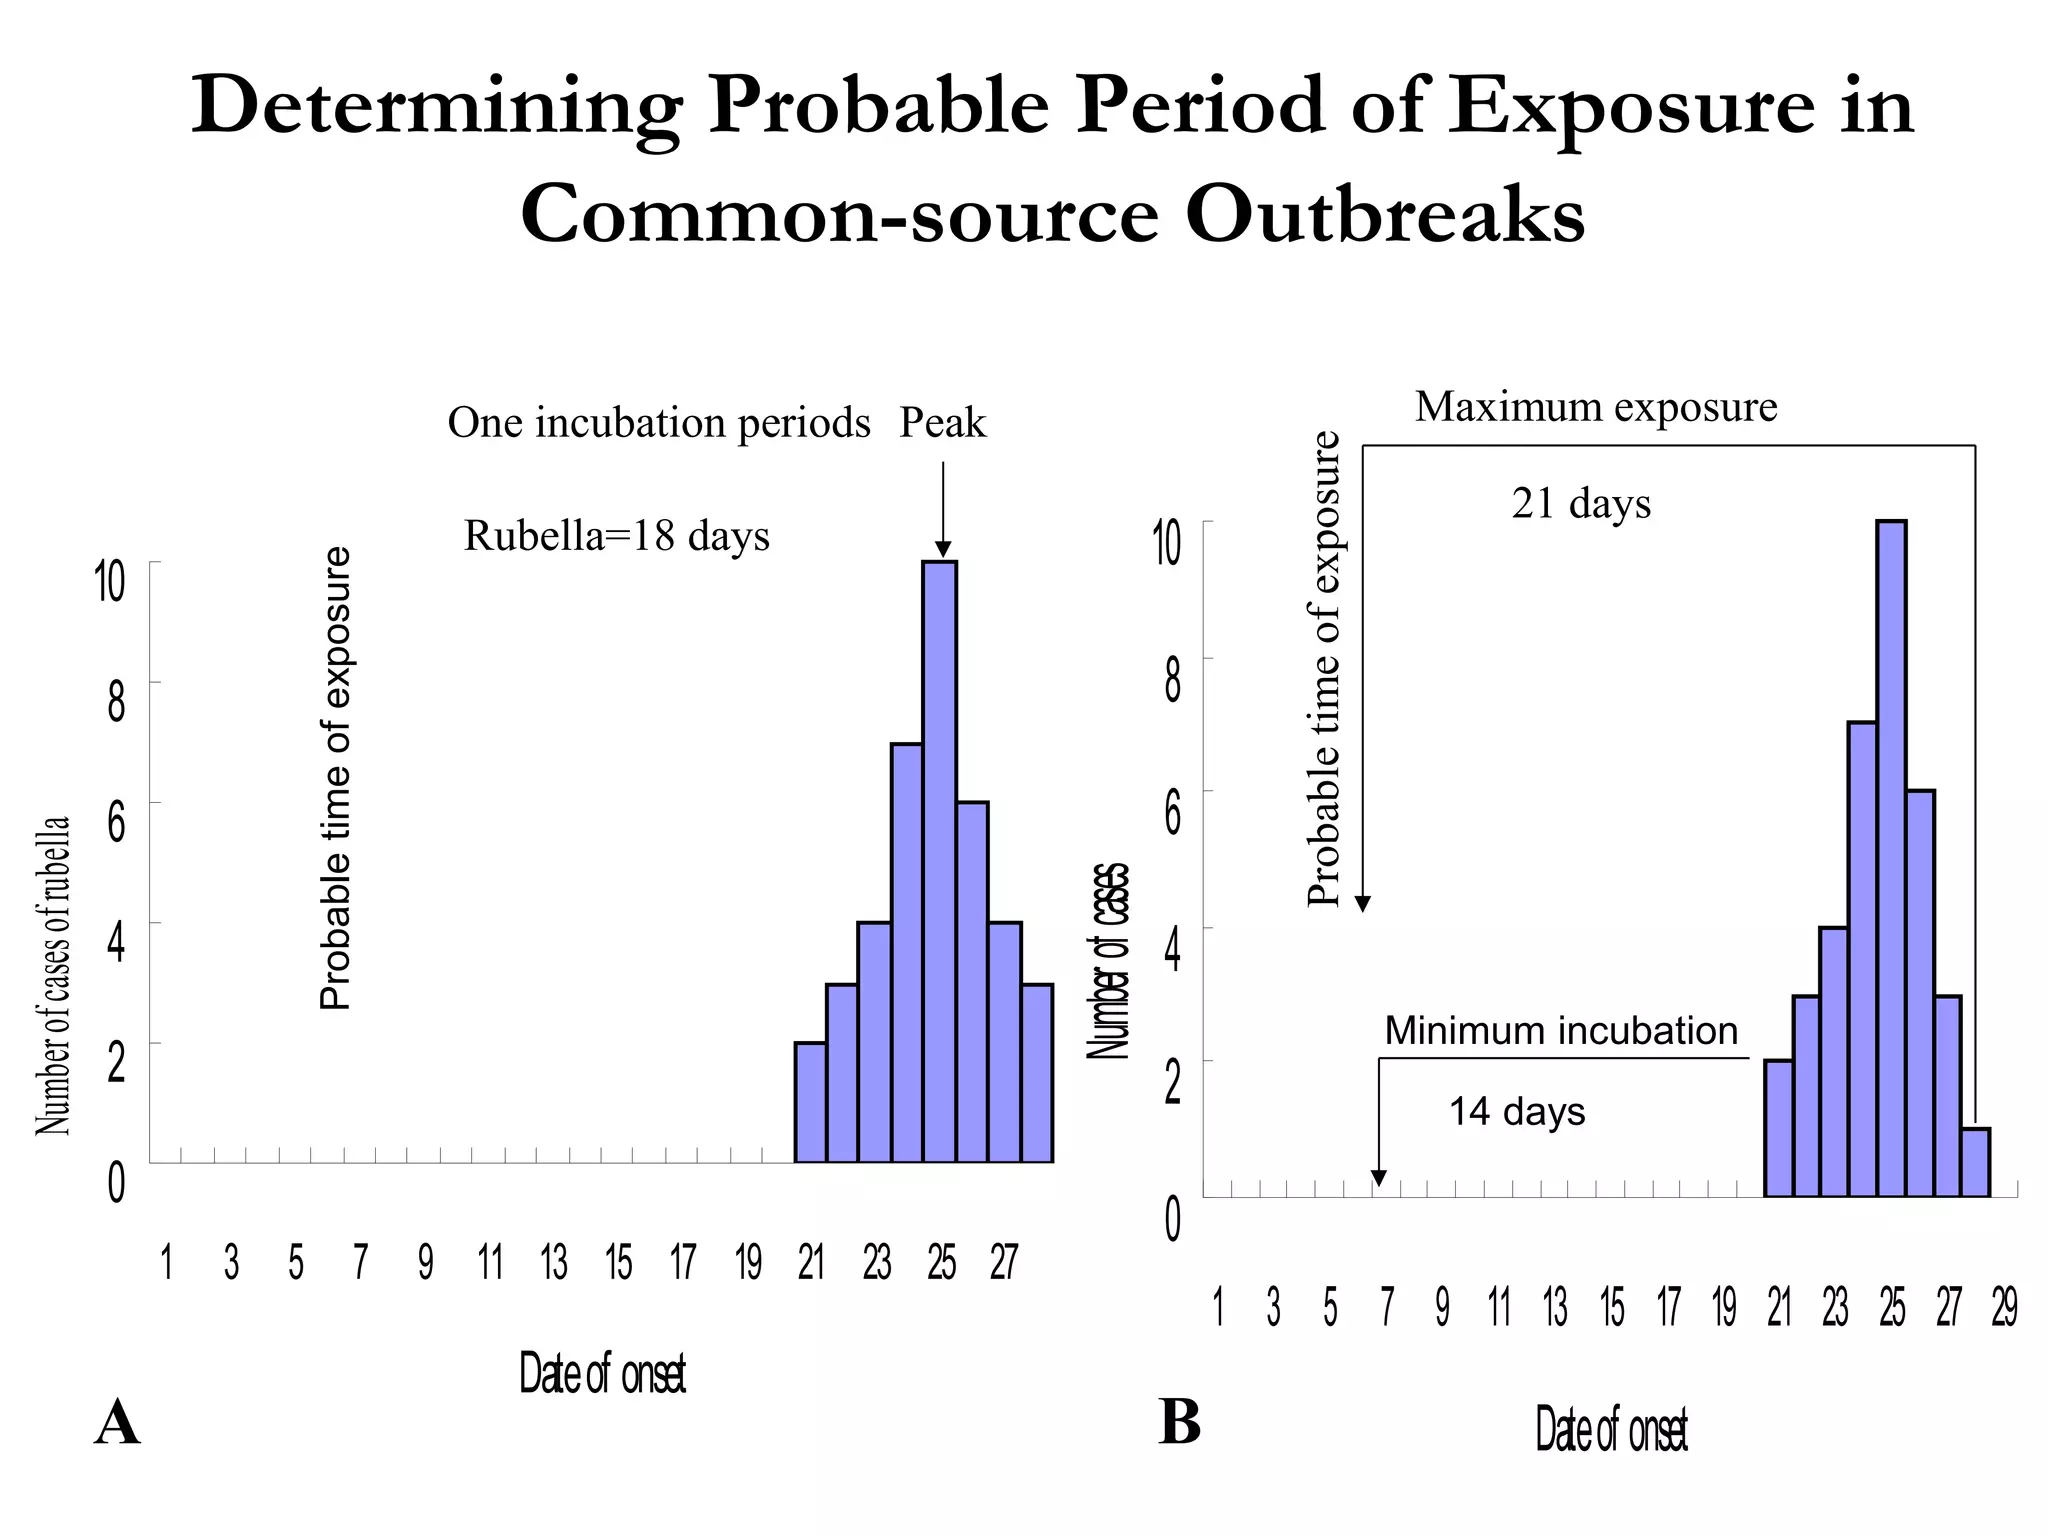


An epidemic curve (or epi curve) is a graphical depiction of the number of illness cases by date of onset that can help characterize outbreaks. The shape and features of the curve can reveal the pattern of spread (e.g. common source, point source, propagated), magnitude, outliers, time trends, and estimate the exposure period. Epi curves are useful for outbreak investigation and response.