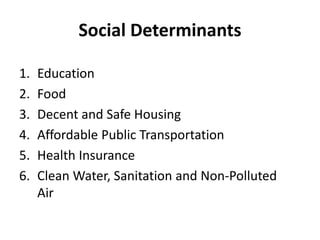
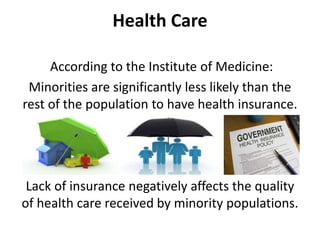
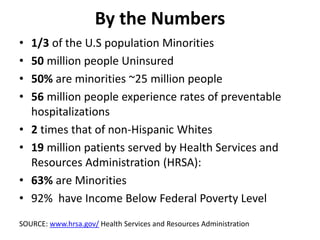
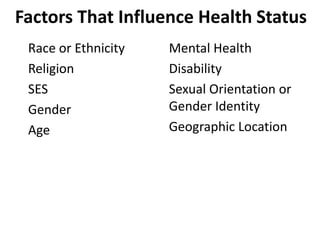
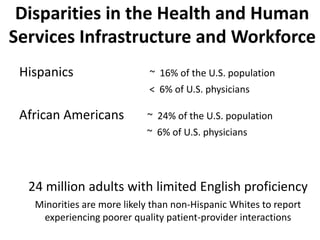
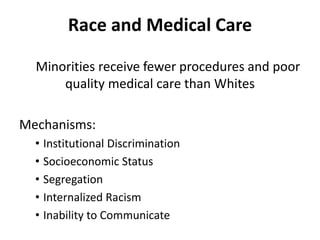
Health Care Disparities
The World Health Organization (WHO)
defines health disparities as:
Differences in health outcomes that are
closely linked with social, economic, and
environmental disadvantage — are often
driven by the social conditions in which
individuals live, learn, work and play
It’s Been Said
“Of all the forms of inequality,
injustice in healthcare is the
most shocking and
inhumane “
Rev. Dr. Martin Luther King
Disparity
The lack of similarity or equality;
any quality difference;
the condition of being unequal
Definitions
Health: state of complete physical, mental and social
well-being.
Healthcare: the prevention, treatment and
management of illness and the preservation of mental
and physical well-being; services offered by the
medical and Allied health professions
Determinants of Health
1. Behavior
2. Physical environment
3. Social environment
4. Biology
5. Individual
Social Determinants
1. Education
2. Food
3. Decent and Safe Housing
4. Affordable Public Transportation
5. Health Insurance
6. Clean Water, Sanitation and Non-Polluted
Air
Leading Causes of Death
Heart Disease
Cancer
Accidents
Diabetes
Important Indicators of
Community Health
1. Health Disparities
2. Health Inequalities
3. Health Inequities
Overview of Racial and Ethnic
Health Disparities
Murray et al show a difference of 33 years between the longest living and shortest
living groups in the U.S.
This research found that:: Disparities in mortality across the eight Americas, each
consisting of millions or tens of millions of Americans, are enormous . The
observed disparities in life expectancy cannot be explained by race, income, or
basic health-care access and utilization alone. Because policies aimed at reducing
fundamental socioeconomic inequalities are currently practically absent in the
US, health disparities will have to be at least partly addressed through public
health strategies that reduce risk factors for chronic diseases and injuries.
Murray CJL, Kulkarni SC, Michaud C, Tomijima N, Bulzacchelli MT, et al. (2006) Eight Americas:
Investigating Mortality
Disparities across Races, Counties, and Race-Counties in the United States. PLoS Med 3(9): e260.
doi:10.1371/journal. pmed.0030260.
The 8 Americas
Economic Burden
$1.24 trillion
The combined costs of health inequalities
and premature death in the United States
between 2003 and 2006
Source:
Joint Center for Political and Economic Studies
Sources of Disparities in Care
• Patient level
– i.e. patient preferences
• Healthcare systems level
– i.e lack of interpretation and translation services
• Provider level
– i.e. bias clinical uncertainty
Measures of Health Care Disparities
• Prevention Quality
– Indicators, Ambulatory Care, Sensitive Conditions
• Vital Statistics
– Population, Births, Deaths
• Access
– Health Insurance, Geography
• Demographics
– Socioeconomic Status
• Clinical Indicators
– Co-morbidity (i.e obesity and diabetes)
Health Care
According to the Institute of Medicine:
Minorities are significantly less likely than the
rest of the population to have health insurance.
Lack of insurance negatively affects the quality
of health care received by minority populations.
By the Numbers
• 1/3 of the U.S population Minorities
• 50 million people Uninsured
• 50% are minorities ~25 million people
• 56 million people experience rates of preventable
hospitalizations
• 2 times that of non-Hispanic Whites
• 19 million patients served by Health Services and
Resources Administration (HRSA):
• 63% are Minorities
• 92% have Income Below Federal Poverty Level
SOURCE: www.hrsa.gov/ Health Services and Resources Administration
Factors That Influence Health Status
Race or Ethnicity
Religion
SES
Gender
Age
Mental Health
Disability
Sexual Orientation or
Gender Identity
Geographic Location
Major Considerations in
Healthcare Disparities
Care
Workforce
Population
Data Collection and Research
Disparities in the Health and Human
Services Infrastructure and Workforce
Hispanics ~ 16% of the U.S. population
< 6% of U.S. physicians
African Americans ~ 24% of the U.S. population
~ 6% of U.S. physicians
24 million adults with limited English proficiency
Minorities are more likely than non-Hispanic Whites to report
experiencing poorer quality patient-provider interactions
Noted Success
National Health Service Corps (NHSC) invests in the healthcare
workforce by placing health professionals in Health Professional
Shortage Areas to care for underserved populations.
7,000 NHSC clinicians provide healthcare services in
underserved areas in exchange for loan repayment or
scholarships:
~ 33% of these clinicians are minorities
50% serve in Community Health Centers (CHC)
US Census 2010
People QuickFacts Hempstead,NY
Population (2010) 53,891 19,378,102
Population (2012) 54,883 19,570,261
Population Hempstead, NY New York State
Population % change (4/1/2010-7/1/2012) 1.8% 1.0%
< 5 years old 8.5% 6.0%
< 18 years old 25.6% 22.3%
White 21.9% 65.7%
Black or African American 48.3% 15.9%
Two or More Races 5.0% 3.0%
Hispanic or Latino 44.2% 17.6%
Foreign 39.2% 21.8%
Language other than English at home (age +5) 46.9% 29.5%
High school graduate or higher (age +25) 69.5% 84.6%
Bachelor’s degree or higher (age +25) 16.5% 32.5%
Successful Note
CDC’s Racial and Ethnic Approaches to Community Health
(REACH)
• seek better health
• change local healthcare practices
• implement evidence-based public health programs
Communities Putting Prevention to Work (CPPW)
• support statewide
• community-based policy
• nutrition, physical activity, and tobacco control
Race and Medical Care
Minorities receive fewer procedures and poor
quality medical care than Whites
Mechanisms:
• Institutional Discrimination
• Socioeconomic Status
• Segregation
• Internalized Racism
• Inability to Communicate
Community Ranking Pediatric Preventative
Care Sensitive Hospitalizations per 100,000
Pediatric Population (2013)
How It’s Going
Community with Highest Admission Rate: Hempstead
Preventable pediatric admission rate 22 times the rate
of the community with the lowest rate (Melville).
411
• Black are 2-4 times more likely than Whites and Hispanics
to be hospitalized for a potentially preventable conditions
• Black men and women are more likely to die from heart
disease vs. all other racial ethnic groups
• Minority women have lower rates of breast cancer than
White women but are more likely to die from the disease
• Life expectancy differs by nearly 10 years between Black
men (70 years) and White women (80+ years)
Head Start Program
Minorities make up 79% of the population served by Head
Start administered by the Administration for Children and
Families (ACF)
Goals of the program:
• Promote the social and cognitive development of children
• Provide educational, health, nutritional, social and other
services to enrolled children and families
• Help parents make progress toward their educational,
literacy, and employment goals
• Engages parents in their child’s learning
Kathleen G. Sebelius, Secretary,
Health & Human Services
“It is time to refocus, reinforce, and
repeat the message that health
disparities exist and that health equity
benefits everyone.”
References
American community survey; Hofstra University University
Centers for Disease Control and Prevention
Disparities across Races, Counties, and Race-Counties in the United States. PLoS Med
3(9): e260. doi:10.1371/journal. pmed.0030260.
Healthy People 2020
Health Services and Resources Administration www.hrsa.gov/
Long Island index 2015
Murray CJL, Kulkarni SC, Michaud C, Tomijima N, Bulzacchelli MT, et al. (2006) Eight
Americas: Investigating Mortality
National centers for health statistics 2005
Rev. Dr. Martin Luther King
US Census 2010
US Census 2015
http://www.countyhealthrankings.org/app/new-york/2015/county/snapshots/059

Health Disparities Power Point FINAL

  • 1.
    Health Care Disparities TheWorld Health Organization (WHO) defines health disparities as: Differences in health outcomes that are closely linked with social, economic, and environmental disadvantage — are often driven by the social conditions in which individuals live, learn, work and play
  • 2.
    It’s Been Said “Ofall the forms of inequality, injustice in healthcare is the most shocking and inhumane “ Rev. Dr. Martin Luther King
  • 3.
    Disparity The lack ofsimilarity or equality; any quality difference; the condition of being unequal
  • 4.
    Definitions Health: state ofcomplete physical, mental and social well-being. Healthcare: the prevention, treatment and management of illness and the preservation of mental and physical well-being; services offered by the medical and Allied health professions
  • 5.
    Determinants of Health 1.Behavior 2. Physical environment 3. Social environment 4. Biology 5. Individual
  • 6.
    Social Determinants 1. Education 2.Food 3. Decent and Safe Housing 4. Affordable Public Transportation 5. Health Insurance 6. Clean Water, Sanitation and Non-Polluted Air
  • 7.
    Leading Causes ofDeath Heart Disease Cancer Accidents Diabetes
  • 8.
    Important Indicators of CommunityHealth 1. Health Disparities 2. Health Inequalities 3. Health Inequities
  • 9.
    Overview of Racialand Ethnic Health Disparities Murray et al show a difference of 33 years between the longest living and shortest living groups in the U.S. This research found that:: Disparities in mortality across the eight Americas, each consisting of millions or tens of millions of Americans, are enormous . The observed disparities in life expectancy cannot be explained by race, income, or basic health-care access and utilization alone. Because policies aimed at reducing fundamental socioeconomic inequalities are currently practically absent in the US, health disparities will have to be at least partly addressed through public health strategies that reduce risk factors for chronic diseases and injuries. Murray CJL, Kulkarni SC, Michaud C, Tomijima N, Bulzacchelli MT, et al. (2006) Eight Americas: Investigating Mortality Disparities across Races, Counties, and Race-Counties in the United States. PLoS Med 3(9): e260. doi:10.1371/journal. pmed.0030260.
  • 10.
  • 11.
    Economic Burden $1.24 trillion Thecombined costs of health inequalities and premature death in the United States between 2003 and 2006 Source: Joint Center for Political and Economic Studies
  • 12.
    Sources of Disparitiesin Care • Patient level – i.e. patient preferences • Healthcare systems level – i.e lack of interpretation and translation services • Provider level – i.e. bias clinical uncertainty
  • 13.
    Measures of HealthCare Disparities • Prevention Quality – Indicators, Ambulatory Care, Sensitive Conditions • Vital Statistics – Population, Births, Deaths • Access – Health Insurance, Geography • Demographics – Socioeconomic Status • Clinical Indicators – Co-morbidity (i.e obesity and diabetes)
  • 15.
    Health Care According tothe Institute of Medicine: Minorities are significantly less likely than the rest of the population to have health insurance. Lack of insurance negatively affects the quality of health care received by minority populations.
  • 16.
    By the Numbers •1/3 of the U.S population Minorities • 50 million people Uninsured • 50% are minorities ~25 million people • 56 million people experience rates of preventable hospitalizations • 2 times that of non-Hispanic Whites • 19 million patients served by Health Services and Resources Administration (HRSA): • 63% are Minorities • 92% have Income Below Federal Poverty Level SOURCE: www.hrsa.gov/ Health Services and Resources Administration
  • 17.
    Factors That InfluenceHealth Status Race or Ethnicity Religion SES Gender Age Mental Health Disability Sexual Orientation or Gender Identity Geographic Location
  • 18.
    Major Considerations in HealthcareDisparities Care Workforce Population Data Collection and Research
  • 19.
    Disparities in theHealth and Human Services Infrastructure and Workforce Hispanics ~ 16% of the U.S. population < 6% of U.S. physicians African Americans ~ 24% of the U.S. population ~ 6% of U.S. physicians 24 million adults with limited English proficiency Minorities are more likely than non-Hispanic Whites to report experiencing poorer quality patient-provider interactions
  • 20.
    Noted Success National HealthService Corps (NHSC) invests in the healthcare workforce by placing health professionals in Health Professional Shortage Areas to care for underserved populations. 7,000 NHSC clinicians provide healthcare services in underserved areas in exchange for loan repayment or scholarships: ~ 33% of these clinicians are minorities 50% serve in Community Health Centers (CHC)
  • 21.
  • 22.
    People QuickFacts Hempstead,NY Population(2010) 53,891 19,378,102 Population (2012) 54,883 19,570,261 Population Hempstead, NY New York State Population % change (4/1/2010-7/1/2012) 1.8% 1.0% < 5 years old 8.5% 6.0% < 18 years old 25.6% 22.3% White 21.9% 65.7% Black or African American 48.3% 15.9% Two or More Races 5.0% 3.0% Hispanic or Latino 44.2% 17.6% Foreign 39.2% 21.8% Language other than English at home (age +5) 46.9% 29.5% High school graduate or higher (age +25) 69.5% 84.6% Bachelor’s degree or higher (age +25) 16.5% 32.5%
  • 23.
    Successful Note CDC’s Racialand Ethnic Approaches to Community Health (REACH) • seek better health • change local healthcare practices • implement evidence-based public health programs Communities Putting Prevention to Work (CPPW) • support statewide • community-based policy • nutrition, physical activity, and tobacco control
  • 24.
    Race and MedicalCare Minorities receive fewer procedures and poor quality medical care than Whites Mechanisms: • Institutional Discrimination • Socioeconomic Status • Segregation • Internalized Racism • Inability to Communicate
  • 25.
    Community Ranking PediatricPreventative Care Sensitive Hospitalizations per 100,000 Pediatric Population (2013)
  • 26.
    How It’s Going Communitywith Highest Admission Rate: Hempstead Preventable pediatric admission rate 22 times the rate of the community with the lowest rate (Melville).
  • 29.
    411 • Black are2-4 times more likely than Whites and Hispanics to be hospitalized for a potentially preventable conditions • Black men and women are more likely to die from heart disease vs. all other racial ethnic groups • Minority women have lower rates of breast cancer than White women but are more likely to die from the disease • Life expectancy differs by nearly 10 years between Black men (70 years) and White women (80+ years)
  • 30.
    Head Start Program Minoritiesmake up 79% of the population served by Head Start administered by the Administration for Children and Families (ACF) Goals of the program: • Promote the social and cognitive development of children • Provide educational, health, nutritional, social and other services to enrolled children and families • Help parents make progress toward their educational, literacy, and employment goals • Engages parents in their child’s learning
  • 31.
    Kathleen G. Sebelius,Secretary, Health & Human Services “It is time to refocus, reinforce, and repeat the message that health disparities exist and that health equity benefits everyone.”
  • 32.
    References American community survey;Hofstra University University Centers for Disease Control and Prevention Disparities across Races, Counties, and Race-Counties in the United States. PLoS Med 3(9): e260. doi:10.1371/journal. pmed.0030260. Healthy People 2020 Health Services and Resources Administration www.hrsa.gov/ Long Island index 2015 Murray CJL, Kulkarni SC, Michaud C, Tomijima N, Bulzacchelli MT, et al. (2006) Eight Americas: Investigating Mortality National centers for health statistics 2005 Rev. Dr. Martin Luther King US Census 2010 US Census 2015 http://www.countyhealthrankings.org/app/new-york/2015/county/snapshots/059

Editor's Notes

  • #2 Healthy People 2020
  • #4 www.Merriman-webster.com
  • #6 Source: Centers for Disease Control and Prevention
  • #8 National centers for health statistics 2005 Centers for Disease Control and Prevention 2005
  • #9 1.noun (pl. disparities) a great difference 2. noun (pl. inequalities) difference in size, degree 3. noun (pl. inequities) lack of fairness or justice:
  • #13 Source: IOM, 2002 Unequal treatment confronting racial and ethnic disparities in healthcare
  • #23 Population, percent change, April 1, 2010 to July 1, 2012 1.8% 1.0% Population, 2010 53,891 19,378,102 Persons under 5 years, percent, 2010 8.5% 6.0% Persons under 18 years, percent, 2010 25.6% 22.3%   White alone, percent, 2010 (a) 21.9% 65.7% Black or African American alone, percent, 2010 (a) 48.3% 15.9% Two or More Races, percent, 2010 5.0% 3.0% Hispanic or Latino, percent, 2010 (b) 44.2% 17.6%   Foreign born persons, percent, 2007-2011 39.2% 21.8% Language other than English spoken at home, percent age 5+, 2007-2011 46.9% 29.5% High school graduate or higher, percent of persons age 25+, 2007-2011 69.5% 84.6% Bachelor's degree or higher, percent of persons age 25+, 2007-2011 16.5% 32.5%
  • #26 2013 Long Island index
  • #28 Long Island index.org 2013
  • #32 Healthy People 2020