Downloaded 375 times


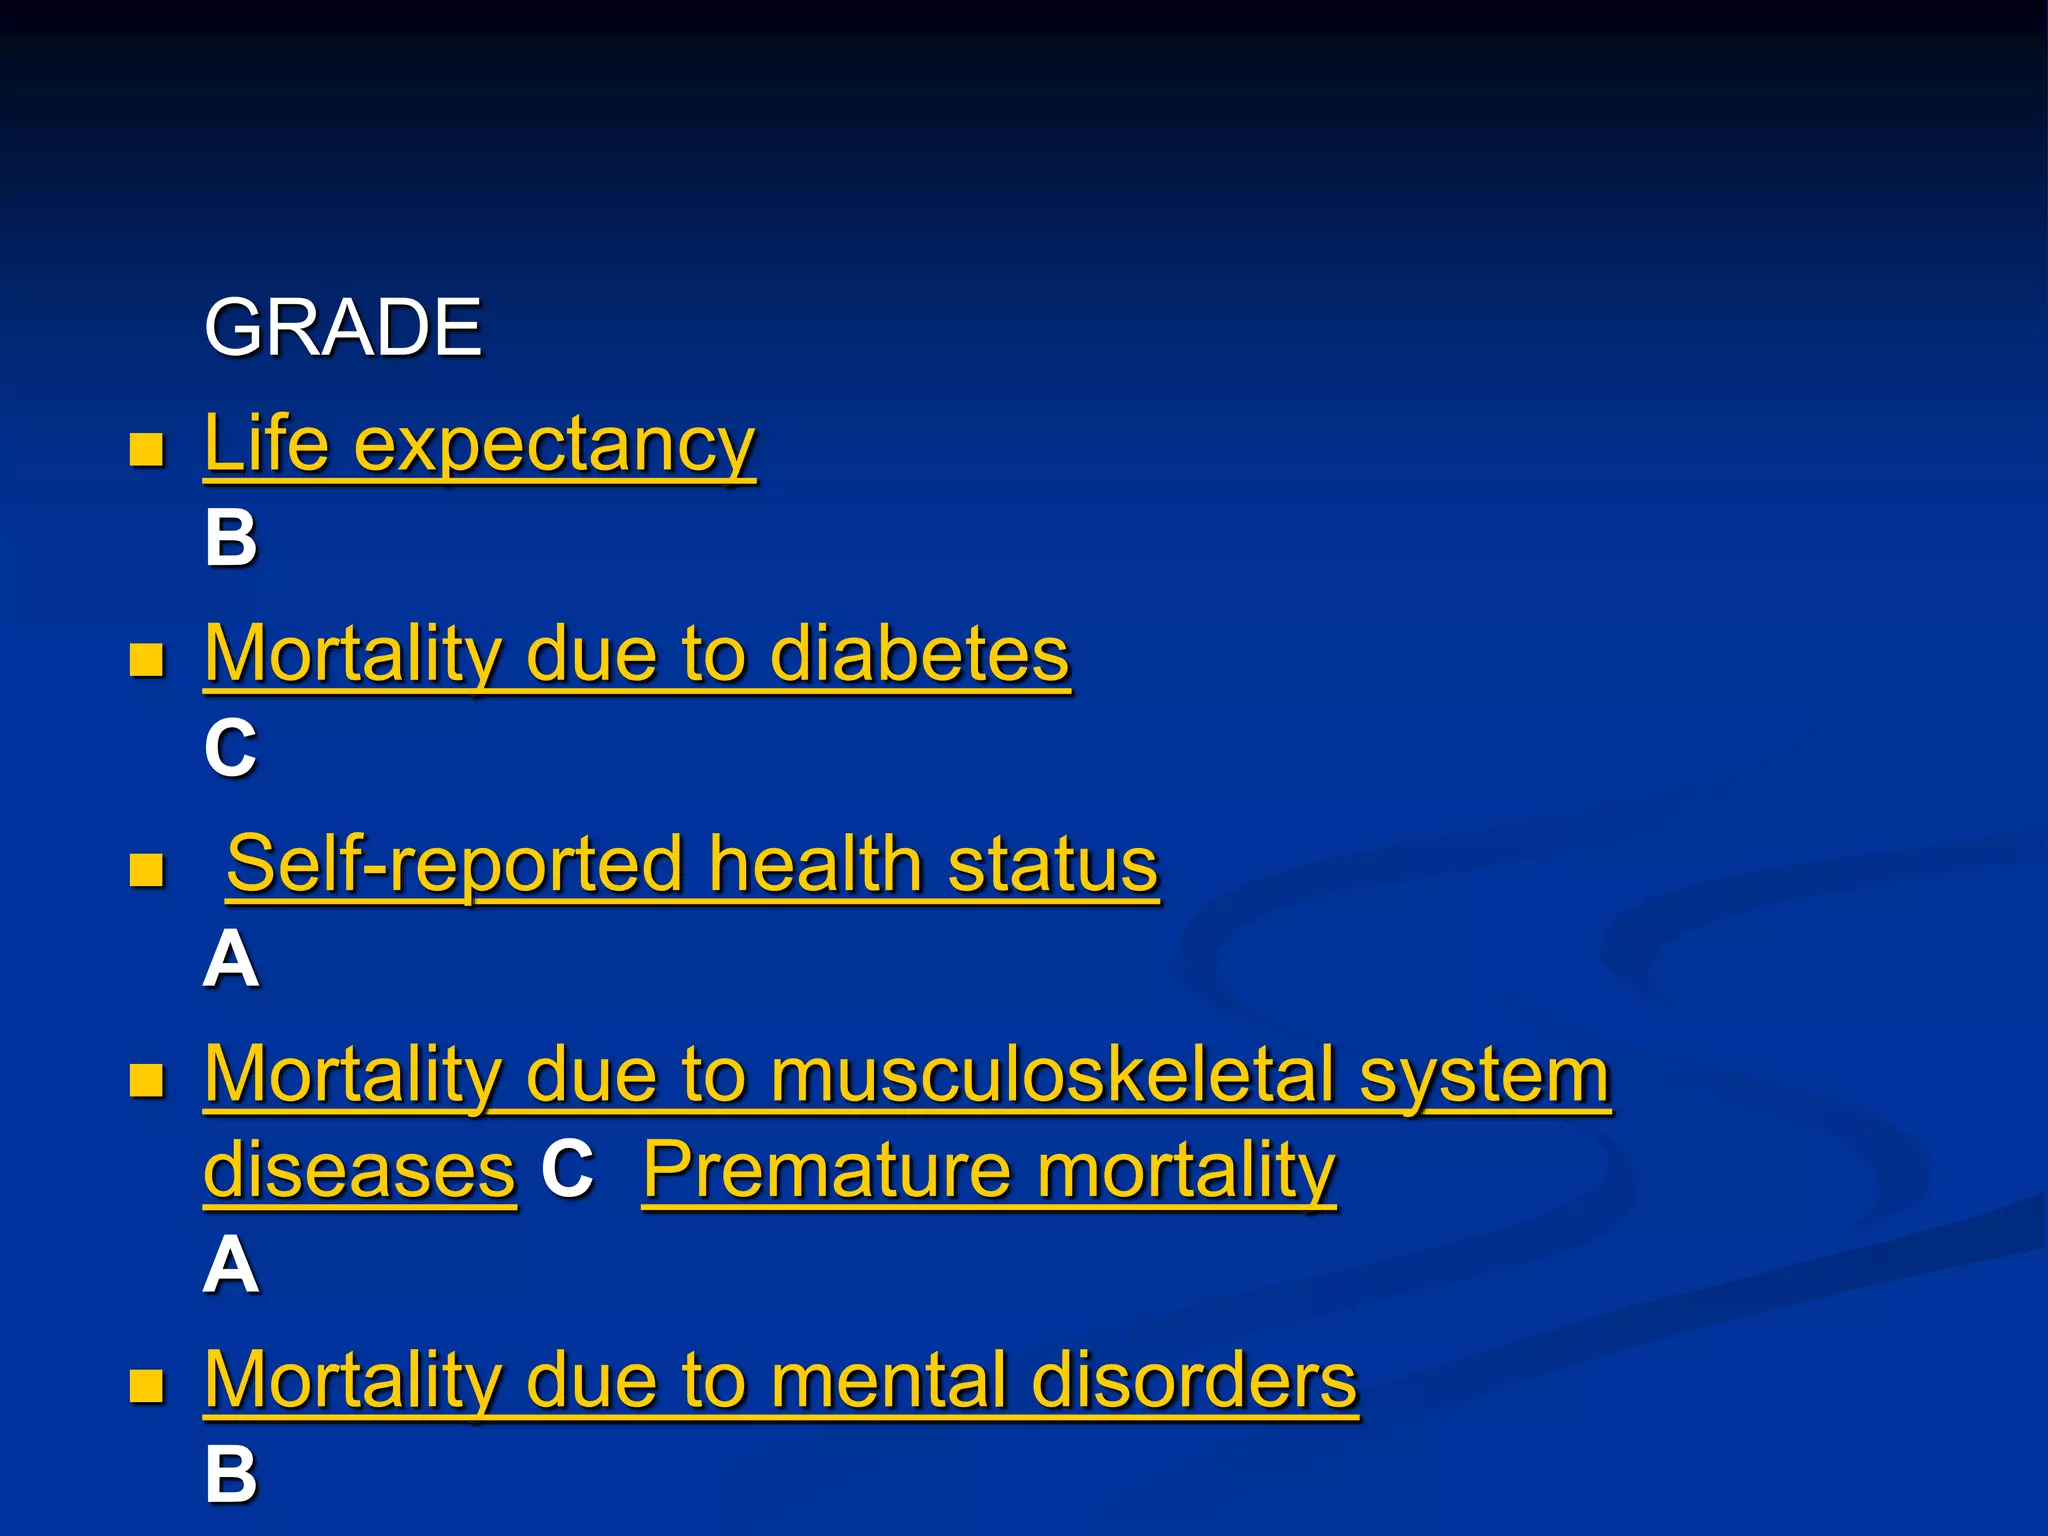
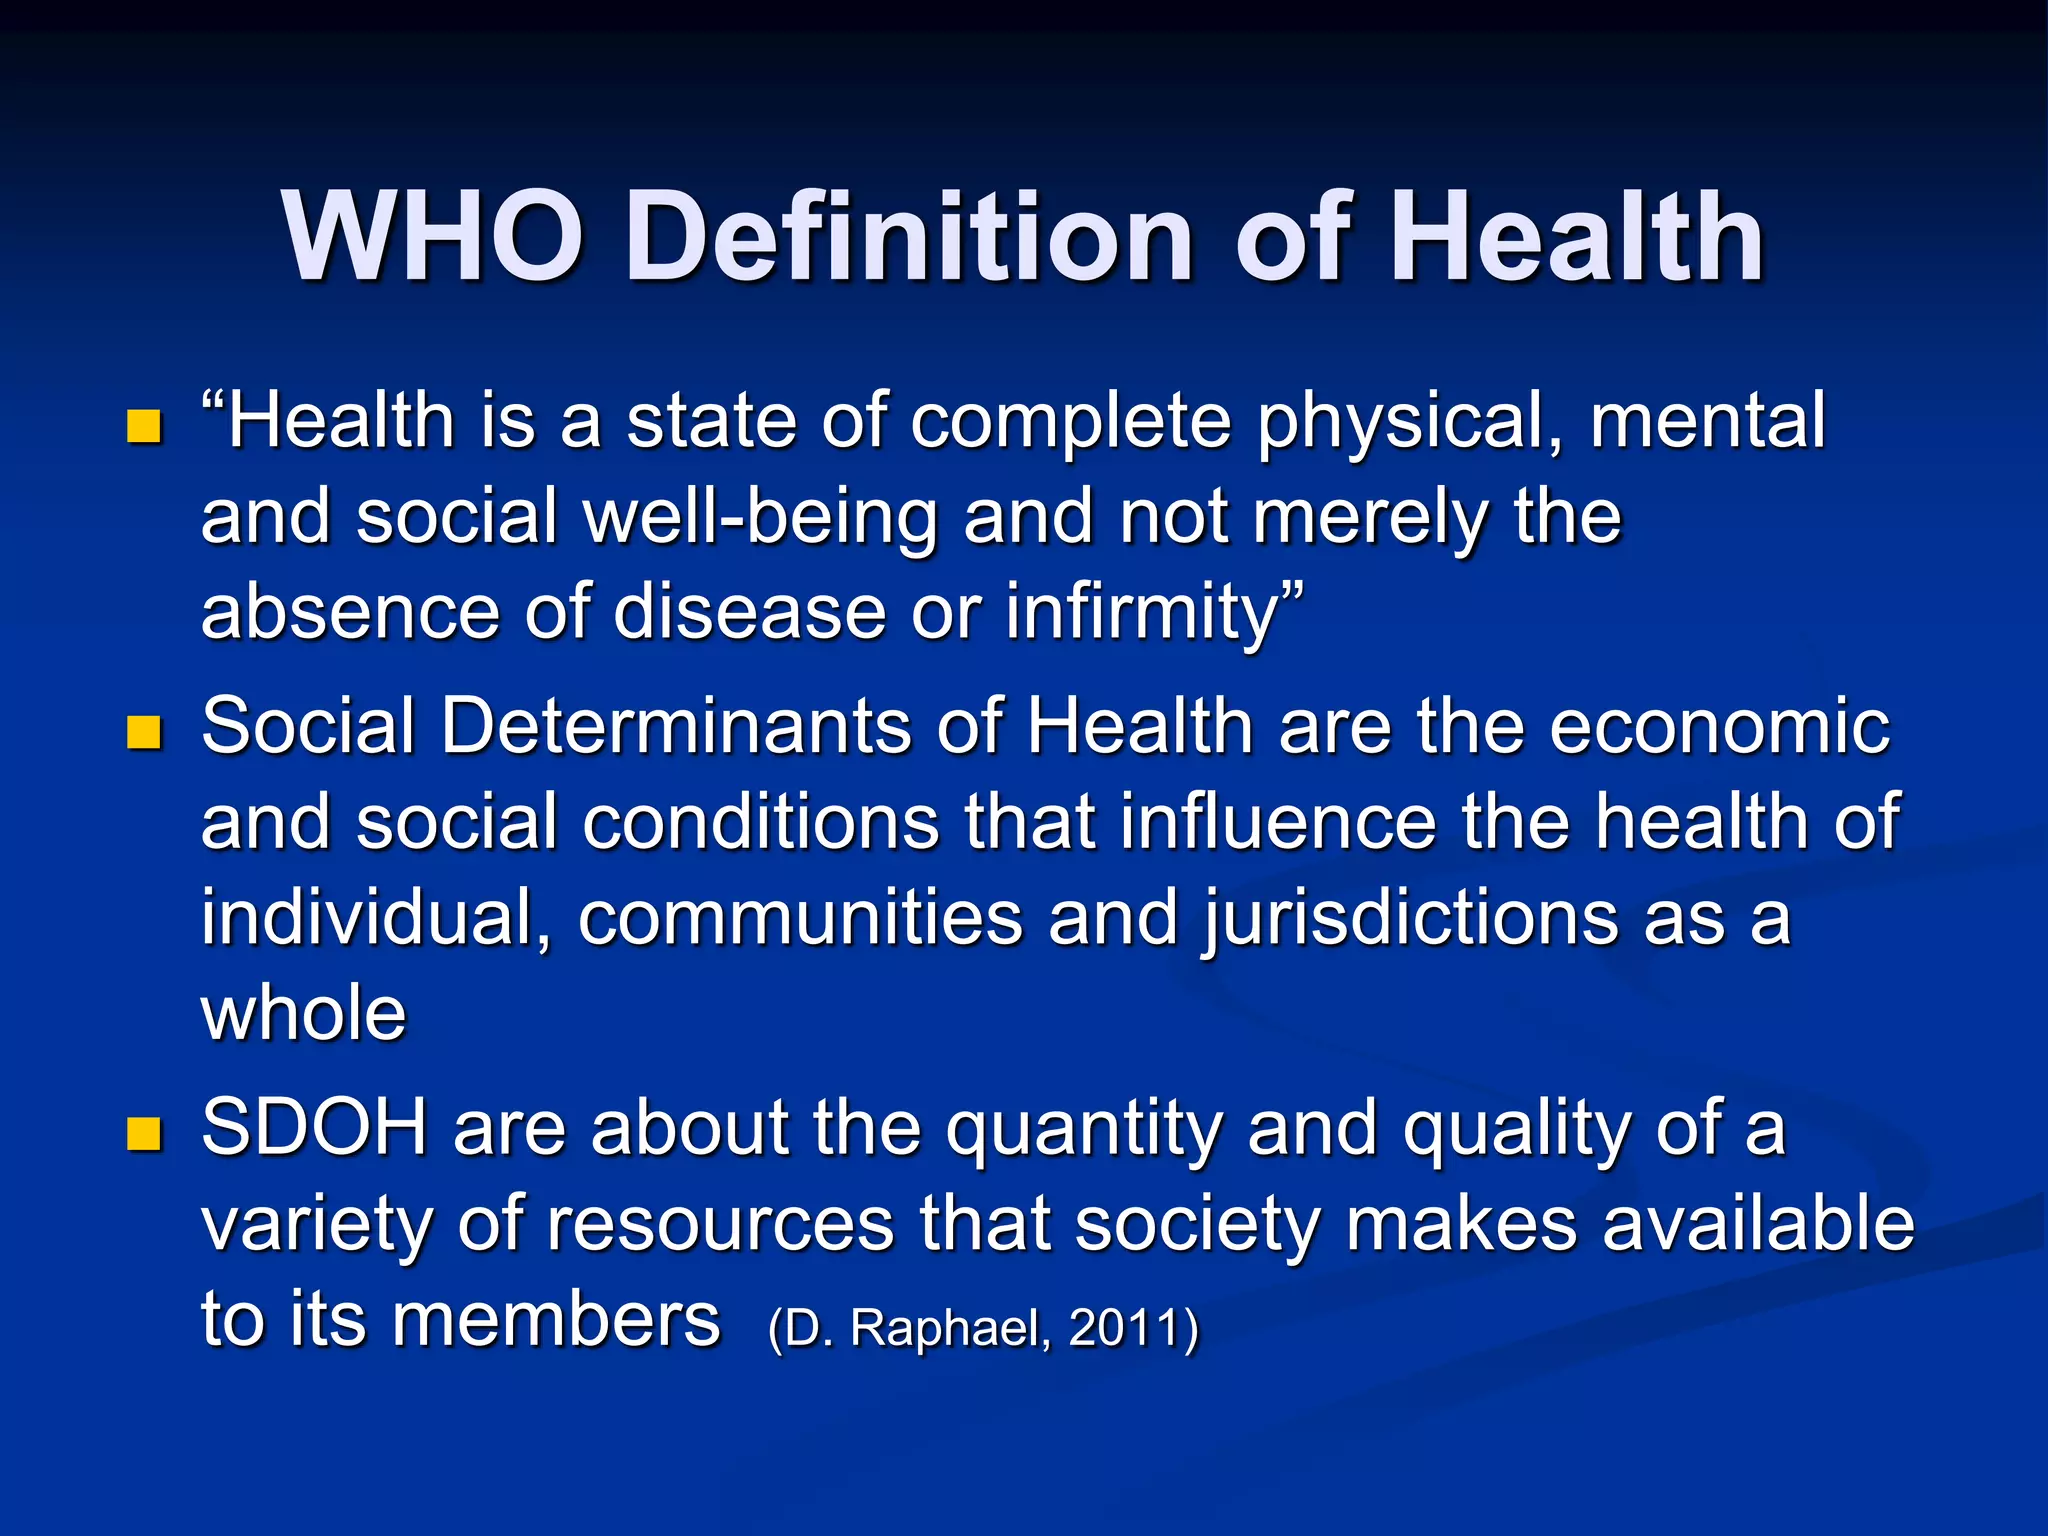


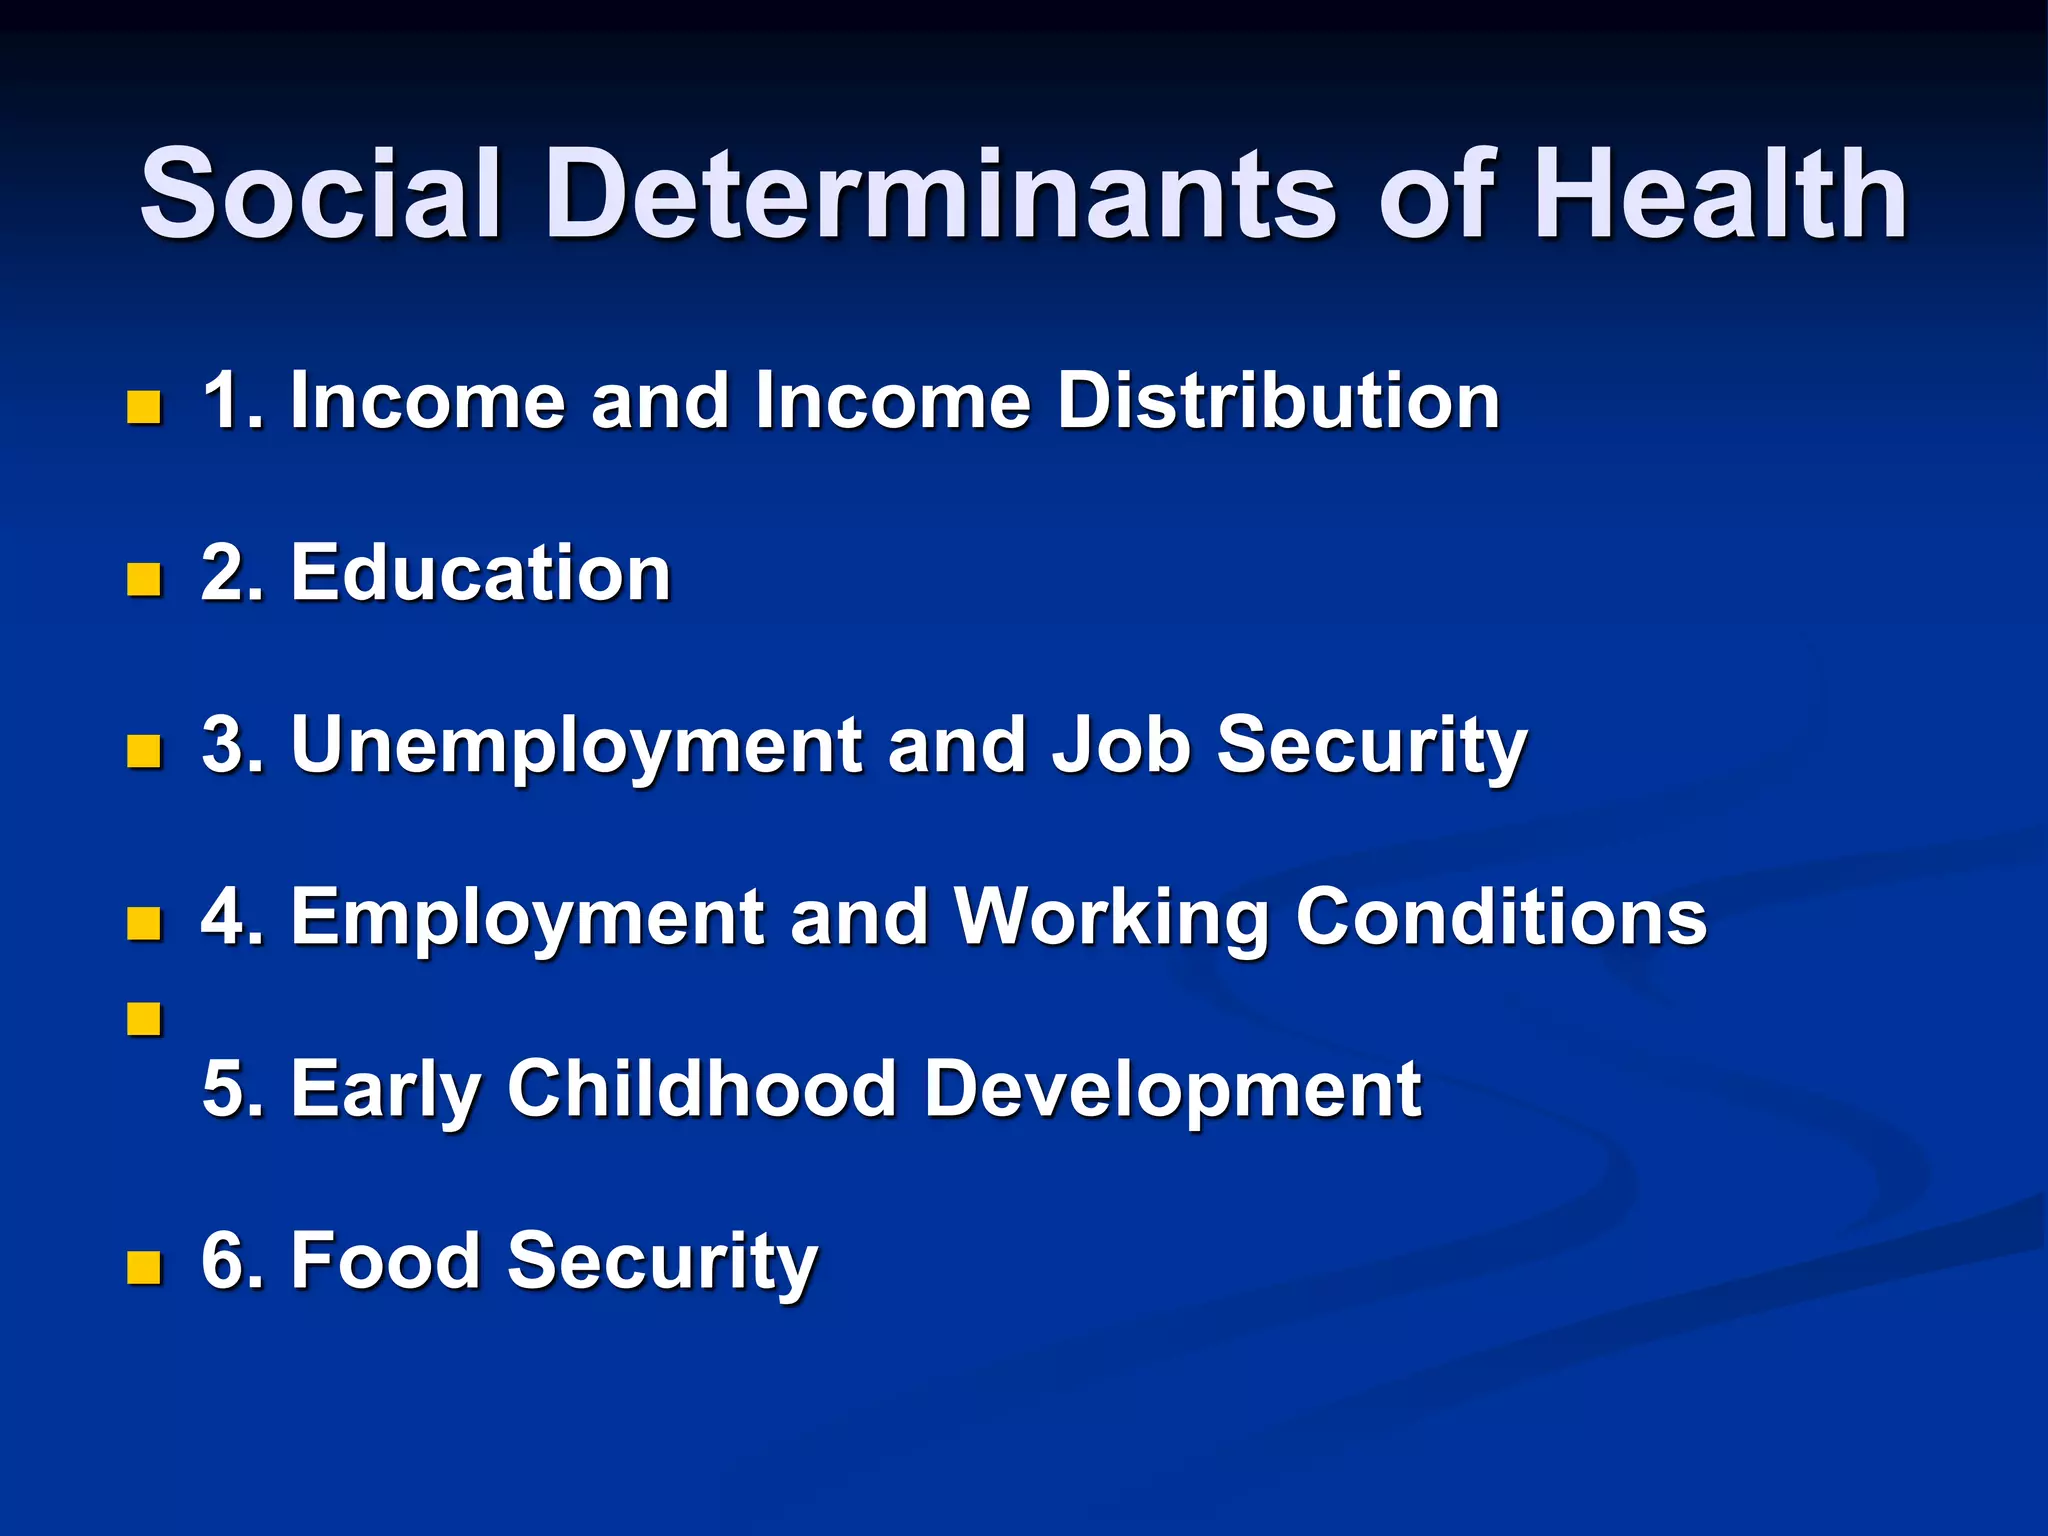


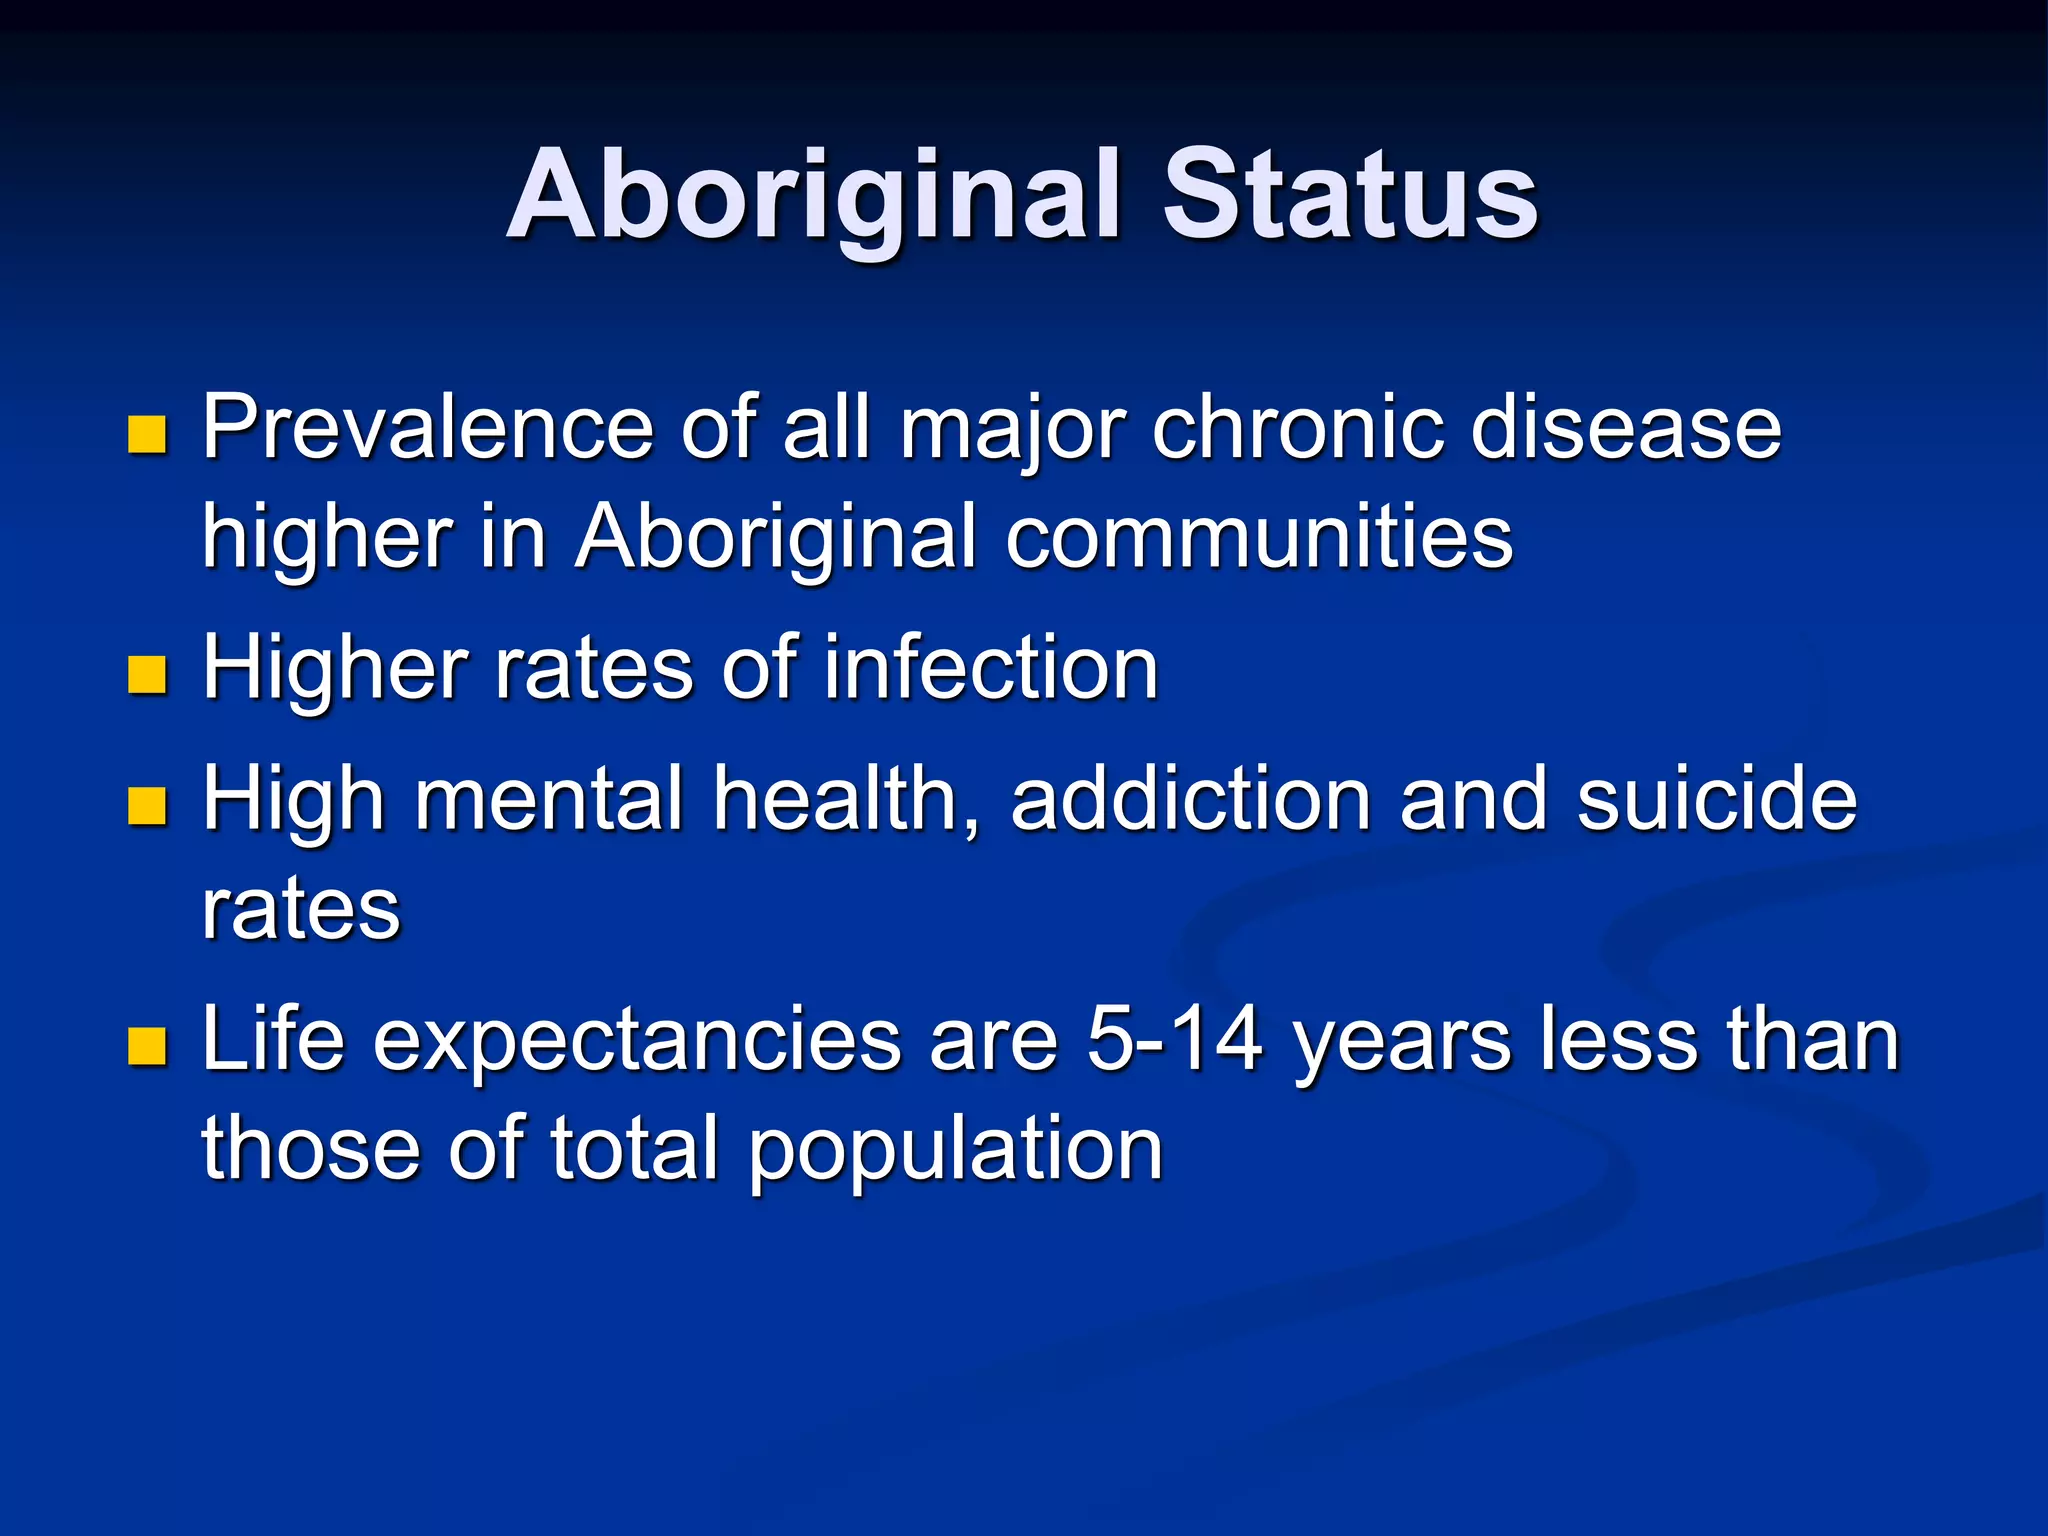


The document discusses the crucial role of social determinants of health (SDOH) in shaping healthcare outcomes in Canada, emphasizing that factors like income, education, and housing significantly influence health status. It highlights the need for social workers to be integral in healthcare delivery by addressing these determinants and improving patient outcomes. The document advocates for policy changes that focus on reducing health inequalities and enhancing the overall health of communities.


