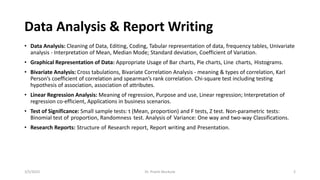
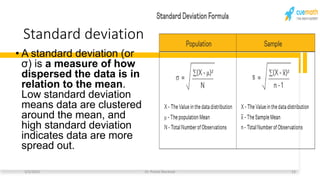
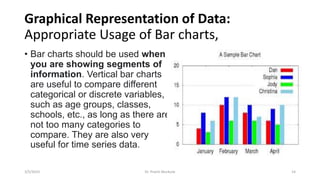
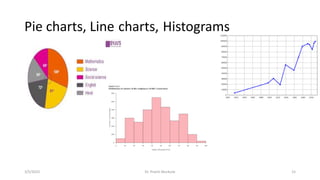
5. Data Analysis & Report Writing: Data Analysis: Cleaning of Data, Editing, Coding, Tabular representation of data, frequency tables, Univariate analysis - Interpretation of Mean, Median Mode; Standard deviation, Coefficient of Variation. Graphical Representation of Data: Appropriate Usage of Bar charts, Pie charts, Line charts, Histograms. Bivariate Analysis: Cross tabulations, Bivariate Correlation Analysis - meaning & types of correlation, Karl Person’s coefficient of correlation and spearman’s rank correlation. Chi-square test including testing hypothesis of association, association of attributes. Linear Regression Analysis: Meaning of regression, Purpose and use, Linear regression; Interpretation of regression co-efficient, Applications in business scenarios. Test of Significance: Small sample tests: t (Mean, proportion) and F tests, Z test. Non-parametric tests: Binomial test of proportion, Randomness test. Analysis of Variance: One way and two-way Classifications. Research Reports: Structure of Research report, Report writing and Presentation.
The chi-square test is used to determine if there is a significant association between two categorical variables. It can be used for independence tests between two variables or goodness-of-fit tests to determine if observed data fits a theoretical distribution. The chi-square test calculates expected frequencies and compares them to observed frequencies to determine if any differences could be due to chance or indicate a true association. It is widely applied in research fields to analyze relationships in categorical data.
This document provides an introduction to key concepts in statistics. It defines variables, populations, samples, and different types of variables. It also describes different types of research studies including correlational studies, experiments, and other quasi-experimental designs. Finally, it introduces important statistical concepts like descriptive statistics, inferential statistics, sampling error, notation, and order of operations.
This document introduces key concepts in statistics. It defines variables, populations, samples, and different types of variables. It discusses different types of research studies including correlational studies, experiments, and other quasi-experimental designs. It also outlines different scales of measurement and introduces descriptive and inferential statistics for organizing, summarizing, and making inferences about data. Notation used in statistics is defined along with the order of operations.
variance sample and population as introduction to statisticssuerie2
This document provides an introduction to key concepts in statistics. It defines variables, populations, samples, and different types of variables. It also describes different types of research studies including correlational studies, experiments, and other quasi-experimental designs. Finally, it introduces important statistical concepts like descriptive statistics, inferential statistics, sampling error, notation, and order of operations.
chapter 1 : introduction to statistics. topics include variable, population a...suerie2
This document provides an introduction to key concepts in statistics. It defines variables, populations, samples, and different types of variables. It also describes different types of research studies including correlational studies, experiments, and other quasi-experimental designs. Finally, it introduces important statistical concepts like descriptive statistics, inferential statistics, sampling error, notation, and order of operations.
This document introduces key concepts in statistics. It defines variables, populations, samples, and different types of variables. It discusses different types of research studies including correlational studies, experiments, and other quasi-experimental designs. It also outlines different scales of measurement and introduces descriptive and inferential statistics for organizing, summarizing, and making inferences about data. Notation used in statistics is defined along with the order of operations.
This document provides an introduction to key concepts in statistics. It defines variables, populations, samples, and different types of variables. It also describes different types of research studies including correlational studies, experiments, and other quasi-experimental designs. Finally, it introduces important statistical concepts like descriptive statistics, inferential statistics, sampling error, notation, and order of operations.
This document provides an overview of data processing and analysis techniques. It discusses editing, coding, classification, and tabulation as part of data processing. For data analysis, it describes descriptive statistics such as univariate, bivariate, and multivariate analysis. It also discusses inferential statistics and various correlation, regression, time series analysis techniques to determine relationships between variables and test hypotheses.
Chapter 13 Data Analysis Inferential Methods and Analysis of Time SeriesInternational advisers
This document discusses inferential statistics and time series analysis. It defines inferential statistics as ways to generalize statistics from a sample to a larger population. Common inferential methods include correlation, linear regression, ANOVA, and time series analysis. Correlation measures relationships between variables while regression predicts outcomes. ANOVA compares group means. Time series analysis models trends, seasonality, and irregular patterns over time.
This document discusses correlational research designs. Correlational studies can show relationships between two variables to indicate cause and effect or predict future outcomes. There are three main types of correlational studies: observational research, survey research, and archival research. Correlational research allows analysis of relationships among many variables and provides correlation coefficients to measure direction and degree of relationships. Interpreting correlations involves scattergrams, correlation coefficients from -1 to 1, and determining explained variance through r-squared values. However, correlation does not necessarily prove causation as third variables could be the true cause.
Parametric and non-parametric tests differ in their assumptions about the population from which data is drawn. Parametric tests assume the population is normally distributed and variables are measured on an interval scale, while non-parametric tests make fewer assumptions. Examples of parametric tests include t-tests and ANOVA, while non-parametric examples include chi-square, Mann-Whitney U, and Wilcoxon signed-rank. Parametric tests are more powerful but rely on stronger assumptions, while non-parametric tests are more flexible but less powerful. Researchers must consider the characteristics of their data and questions being asked to determine the appropriate test.
This document discusses quantitative and qualitative data analysis. It defines key terms like analysis, hypothesis, descriptive statistics, inferential statistics, and parametric and nonparametric tests. It explains the steps of quantitative data analysis which include data preparation, describing the data through summary statistics, drawing inferences through inferential statistics, and interpreting the results. Common parametric tests include t-tests, ANOVA, and correlation. Common nonparametric tests include chi-square, median, Mann-Whitney, and Wilcoxon tests. The document emphasizes accurate presentation of analyzed data through narratives and tables.
This document discusses key concepts in biostatistics. It defines biostatistics as the application of statistics in the medical field, involving collecting and analyzing data and interpreting results to make decisions. It describes factors like sample size, study design, and effect size that influence statistical power. Parametric and non-parametric tests are covered, along with the t-test, ANOVA, correlation coefficients, linear regression, the Wilcoxon signed-rank test, and the chi-square test as examples of important statistical analyses. P-values are defined as a measure of how likely observed results would be assuming the null hypothesis is true.
This document provides information about non-parametric tests. It begins by explaining that non-parametric tests do not assume a specific distribution or make assumptions about the population. It then discusses tests for normality like the Kolmogorov-Smirnov test and Shapiro-Wilk test. Commonly used non-parametric tests like Spearman's rank correlation, Mann-Whitney U test, and Kruskal-Wallis H test are explained. The chi-square test and assumptions are also covered in detail. Advantages of non-parametric tests include fewer assumptions and applicability to small sample sizes. A disadvantage is they are less powerful than parametric tests.
The document discusses different statistical techniques used for data analysis. It describes descriptive statistics, which summarize aspects of a data set using measures like mean, median and mode. Inferential statistics are used to make generalizations, predictions and test hypotheses. Various types of statistical analysis are discussed, including univariate, bivariate and multivariate analysis. Specific bivariate statistical methods explained include correlation, cross tabulation, correlation coefficients like Pearson's r and Spearman's rho, chi-square tests, t-tests, ANOVA, and regression analysis.
Selection of appropriate data analysis techniqueRajaKrishnan M
- The document discusses choosing the right statistical method for data analysis, which depends on factors like the number and measurement level of variables, the distribution of variables, the dependence/independence structure, the nature of the hypotheses, and sample size.
- It presents flowcharts for choosing a statistical method based on whether the hypothesis involves one variable (univariate), two variables (bivariate), or more than two variables (multivariate).
- For univariate data, descriptive statistics or a one-sample t-test can be used depending on whether description or inference is the goal; for bivariate data, the choice depends on the nature of the hypothesis (difference or association) and the level of measurement (parametric or nonparame
The document discusses various statistical concepts including:
- The functions of statistics such as expressing facts numerically and establishing relationships between facts.
- The importance of statistics to fields like administration, economics, research, and education.
- Common measures of central tendency including the mean, median, and mode.
- The difference between theoretical and empirical probabilities.
- Types of correlation like positive, negative, simple, and multiple correlation.
- Key statistical tests including t-tests, chi-square, F-tests, and measures of accuracy, precision, and confidence intervals.
This document discusses different types of statistical analysis techniques. It begins by defining descriptive analysis as studying distributions of one variable and bivariate/multivariate analysis as studying relationships between two or more variables. It then discusses various types of statistical analyses including correlation analysis, causal analysis, multiple regression analysis, multiple discriminant analysis, multivariate ANOVA, and canonical analysis. It also covers inferential analysis, characteristics and importance of statistical methods, assumptions of parametric tests, examples of parametric and non-parametric tests, and provides details on the chi-square test.
This part of the thesis describes the methodology section which provides details of the research activities, data collection strategies, and administration of questionnaires and interviews to achieve the study objectives and address the problem. It discusses preparing and testing questionnaires, identifying persons responsible for data collection, and approaches for administering questionnaires and conducting interviews.
MELJUN CORTES research lectures_evaluating_data_statistical_treatmentMELJUN CORTES
This document discusses the importance of statistics in research and the proper treatment of data. It notes that statistics are the backbone of research and help organize data in tables and graphs to guide meaningful interpretations. The document outlines the data analysis process and different levels of measurement for variables. It provides a matrix for statistical treatment of different types of data and describes common statistical operations like measures of central tendency, variance, correlation, and statistical tests. Dangers of misusing statistics are also discussed.
Research is a systematic and scientific method of finding solutions by obtaining various types of data and systematic analysis of the multiple aspects of the issues related.
The techniques or the specific procedure which helps to identify, choose, process, and analyze information about a subject is called Research Methodology
Experimental design is a statistical tool for improving product design and solving production problems.
4. Sampling: Basic Concepts: Defining the Universe, Concepts of Statistical Population, Sample, Characteristics of a good sample. Sampling Frame, determining the sample frame, Sampling errors, Non Sampling errors, Methods to reduce the errors, Sample Size constraints, Non Response. Probability Sample: Simple Random Sample, Systematic Sample, Stratified Random Sample, Area Sampling & Cluster Sampling. Non Probability Sample: Judgment Sampling, Convenience Sampling, Purposive Sampling, Quota Sampling & Snowballing Sampling methods. Determining size of the sample: Practical considerations in sampling and sample size, (sample size determination formulae and numerical not expected)
This document provides an overview of key concepts related to data and measurement in research. It discusses the meaning of data and the need for data collection. It describes primary and secondary data, including their definitions and advantages/disadvantages. Measurement concepts like validity, reliability, and levels of measurement from nominal to ratio scales are explained. Various scaling techniques for capturing attitudes like Likert scales are also introduced. The document concludes with a discussion of questionnaire construction.
More Related Content
Similar to Unit -5 - Data Analysis & Report Writing.pptx
This document introduces key concepts in statistics. It defines variables, populations, samples, and different types of variables. It discusses different types of research studies including correlational studies, experiments, and other quasi-experimental designs. It also outlines different scales of measurement and introduces descriptive and inferential statistics for organizing, summarizing, and making inferences about data. Notation used in statistics is defined along with the order of operations.
variance sample and population as introduction to statisticssuerie2
This document provides an introduction to key concepts in statistics. It defines variables, populations, samples, and different types of variables. It also describes different types of research studies including correlational studies, experiments, and other quasi-experimental designs. Finally, it introduces important statistical concepts like descriptive statistics, inferential statistics, sampling error, notation, and order of operations.
chapter 1 : introduction to statistics. topics include variable, population a...suerie2
This document provides an introduction to key concepts in statistics. It defines variables, populations, samples, and different types of variables. It also describes different types of research studies including correlational studies, experiments, and other quasi-experimental designs. Finally, it introduces important statistical concepts like descriptive statistics, inferential statistics, sampling error, notation, and order of operations.
This document introduces key concepts in statistics. It defines variables, populations, samples, and different types of variables. It discusses different types of research studies including correlational studies, experiments, and other quasi-experimental designs. It also outlines different scales of measurement and introduces descriptive and inferential statistics for organizing, summarizing, and making inferences about data. Notation used in statistics is defined along with the order of operations.
This document provides an introduction to key concepts in statistics. It defines variables, populations, samples, and different types of variables. It also describes different types of research studies including correlational studies, experiments, and other quasi-experimental designs. Finally, it introduces important statistical concepts like descriptive statistics, inferential statistics, sampling error, notation, and order of operations.
This document provides an overview of data processing and analysis techniques. It discusses editing, coding, classification, and tabulation as part of data processing. For data analysis, it describes descriptive statistics such as univariate, bivariate, and multivariate analysis. It also discusses inferential statistics and various correlation, regression, time series analysis techniques to determine relationships between variables and test hypotheses.
Chapter 13 Data Analysis Inferential Methods and Analysis of Time SeriesInternational advisers
This document discusses inferential statistics and time series analysis. It defines inferential statistics as ways to generalize statistics from a sample to a larger population. Common inferential methods include correlation, linear regression, ANOVA, and time series analysis. Correlation measures relationships between variables while regression predicts outcomes. ANOVA compares group means. Time series analysis models trends, seasonality, and irregular patterns over time.
This document discusses correlational research designs. Correlational studies can show relationships between two variables to indicate cause and effect or predict future outcomes. There are three main types of correlational studies: observational research, survey research, and archival research. Correlational research allows analysis of relationships among many variables and provides correlation coefficients to measure direction and degree of relationships. Interpreting correlations involves scattergrams, correlation coefficients from -1 to 1, and determining explained variance through r-squared values. However, correlation does not necessarily prove causation as third variables could be the true cause.
Parametric and non-parametric tests differ in their assumptions about the population from which data is drawn. Parametric tests assume the population is normally distributed and variables are measured on an interval scale, while non-parametric tests make fewer assumptions. Examples of parametric tests include t-tests and ANOVA, while non-parametric examples include chi-square, Mann-Whitney U, and Wilcoxon signed-rank. Parametric tests are more powerful but rely on stronger assumptions, while non-parametric tests are more flexible but less powerful. Researchers must consider the characteristics of their data and questions being asked to determine the appropriate test.
This document discusses quantitative and qualitative data analysis. It defines key terms like analysis, hypothesis, descriptive statistics, inferential statistics, and parametric and nonparametric tests. It explains the steps of quantitative data analysis which include data preparation, describing the data through summary statistics, drawing inferences through inferential statistics, and interpreting the results. Common parametric tests include t-tests, ANOVA, and correlation. Common nonparametric tests include chi-square, median, Mann-Whitney, and Wilcoxon tests. The document emphasizes accurate presentation of analyzed data through narratives and tables.
This document discusses key concepts in biostatistics. It defines biostatistics as the application of statistics in the medical field, involving collecting and analyzing data and interpreting results to make decisions. It describes factors like sample size, study design, and effect size that influence statistical power. Parametric and non-parametric tests are covered, along with the t-test, ANOVA, correlation coefficients, linear regression, the Wilcoxon signed-rank test, and the chi-square test as examples of important statistical analyses. P-values are defined as a measure of how likely observed results would be assuming the null hypothesis is true.
This document provides information about non-parametric tests. It begins by explaining that non-parametric tests do not assume a specific distribution or make assumptions about the population. It then discusses tests for normality like the Kolmogorov-Smirnov test and Shapiro-Wilk test. Commonly used non-parametric tests like Spearman's rank correlation, Mann-Whitney U test, and Kruskal-Wallis H test are explained. The chi-square test and assumptions are also covered in detail. Advantages of non-parametric tests include fewer assumptions and applicability to small sample sizes. A disadvantage is they are less powerful than parametric tests.
The document discusses different statistical techniques used for data analysis. It describes descriptive statistics, which summarize aspects of a data set using measures like mean, median and mode. Inferential statistics are used to make generalizations, predictions and test hypotheses. Various types of statistical analysis are discussed, including univariate, bivariate and multivariate analysis. Specific bivariate statistical methods explained include correlation, cross tabulation, correlation coefficients like Pearson's r and Spearman's rho, chi-square tests, t-tests, ANOVA, and regression analysis.
Selection of appropriate data analysis techniqueRajaKrishnan M
- The document discusses choosing the right statistical method for data analysis, which depends on factors like the number and measurement level of variables, the distribution of variables, the dependence/independence structure, the nature of the hypotheses, and sample size.
- It presents flowcharts for choosing a statistical method based on whether the hypothesis involves one variable (univariate), two variables (bivariate), or more than two variables (multivariate).
- For univariate data, descriptive statistics or a one-sample t-test can be used depending on whether description or inference is the goal; for bivariate data, the choice depends on the nature of the hypothesis (difference or association) and the level of measurement (parametric or nonparame
The document discusses various statistical concepts including:
- The functions of statistics such as expressing facts numerically and establishing relationships between facts.
- The importance of statistics to fields like administration, economics, research, and education.
- Common measures of central tendency including the mean, median, and mode.
- The difference between theoretical and empirical probabilities.
- Types of correlation like positive, negative, simple, and multiple correlation.
- Key statistical tests including t-tests, chi-square, F-tests, and measures of accuracy, precision, and confidence intervals.
This document discusses different types of statistical analysis techniques. It begins by defining descriptive analysis as studying distributions of one variable and bivariate/multivariate analysis as studying relationships between two or more variables. It then discusses various types of statistical analyses including correlation analysis, causal analysis, multiple regression analysis, multiple discriminant analysis, multivariate ANOVA, and canonical analysis. It also covers inferential analysis, characteristics and importance of statistical methods, assumptions of parametric tests, examples of parametric and non-parametric tests, and provides details on the chi-square test.
This part of the thesis describes the methodology section which provides details of the research activities, data collection strategies, and administration of questionnaires and interviews to achieve the study objectives and address the problem. It discusses preparing and testing questionnaires, identifying persons responsible for data collection, and approaches for administering questionnaires and conducting interviews.
MELJUN CORTES research lectures_evaluating_data_statistical_treatmentMELJUN CORTES
This document discusses the importance of statistics in research and the proper treatment of data. It notes that statistics are the backbone of research and help organize data in tables and graphs to guide meaningful interpretations. The document outlines the data analysis process and different levels of measurement for variables. It provides a matrix for statistical treatment of different types of data and describes common statistical operations like measures of central tendency, variance, correlation, and statistical tests. Dangers of misusing statistics are also discussed.
Research is a systematic and scientific method of finding solutions by obtaining various types of data and systematic analysis of the multiple aspects of the issues related.
The techniques or the specific procedure which helps to identify, choose, process, and analyze information about a subject is called Research Methodology
Experimental design is a statistical tool for improving product design and solving production problems.
Similar to Unit -5 - Data Analysis & Report Writing.pptx (20)
4. Sampling: Basic Concepts: Defining the Universe, Concepts of Statistical Population, Sample, Characteristics of a good sample. Sampling Frame, determining the sample frame, Sampling errors, Non Sampling errors, Methods to reduce the errors, Sample Size constraints, Non Response. Probability Sample: Simple Random Sample, Systematic Sample, Stratified Random Sample, Area Sampling & Cluster Sampling. Non Probability Sample: Judgment Sampling, Convenience Sampling, Purposive Sampling, Quota Sampling & Snowballing Sampling methods. Determining size of the sample: Practical considerations in sampling and sample size, (sample size determination formulae and numerical not expected)
This document provides an overview of key concepts related to data and measurement in research. It discusses the meaning of data and the need for data collection. It describes primary and secondary data, including their definitions and advantages/disadvantages. Measurement concepts like validity, reliability, and levels of measurement from nominal to ratio scales are explained. Various scaling techniques for capturing attitudes like Likert scales are also introduced. The document concludes with a discussion of questionnaire construction.
Unit –V. Digital Business Applications.pptxDrPrachiAjit
5. Digital Business Applications - II: Online Travel and Tourism Services: Characteristics of Online Travel, Benefits, Limitations, and Competition in Online Travel Services. E-Employment: Online Job Market, Social Networks Based Job Markets, Social Recruiting, Virtual Job Fairs and Recruiting Events, Benefits and Limitations of the Electronic Job Market. E-Health: Definition, Electronic Medical Record Systems (EMR), Doctors’ System, Patients Services, Medical Devices and Patients Surveillance. Entertainment, Media & Gaming: Service Industry Consumer Applications. Digital Products, Internet TV and Internet Radio, Social Television (TV) Mobile Entertainment, Mobile Marketing, Mobile Streaming Music and Video Providers, Entertainment in Cars; Gaming - Mobile Games, Social Games and Gamification, Business of Social Games, Educational Social Games; Mobile Gambling, Mobility and Sports; Social Entertainment
UNIT IV- Digital Business Application.pptxDrPrachiAjit
Digital Business Applications - I: Electronic Retailing: B2C Electronic Retailing, Characteristics, Advantages, Limitations, E-Tailing Business Models, Classification of Models by Distribution Channel, Referring Directories, Malls with Shared Services. Social Shopping – Concept, Benefits and Drivers, Social Shopping Aids – Recommendations, Reviews, Ratings, and Marketplaces, Real-Time Online Shopping. The Online Versus Off-Line Competition, Click-and-Brick models,
Product and Service Customization and Personalization. Fintech: E-Banking, Mobile Banking, Pure Virtual Banks, Insurance, and Stock Trading, Other Mobile Finance Applications. Digital Government: Government-to-Citizens, Government-to-Business, Government-to-Government, Government-to-Employees Models, Internal Efficiency and Effectiveness, E-Government and Social Networking, M-Government. E-Learning, E-Training, and E-Books: Basics of E- Learning, Characteristics, Advantages, Limitations, Distance Learning and Online Universities, Online Corporate Training, Social Networks and E-Learning, E-Learning Management Systems, Electronic Books
Mobile Commerce, Social Commerce and IoT: Mobile Commerce, Attributes Applications and Benefits of M- Commerce, Mobile Marketing - Shopping and Advertising. Social Commerce: Social Commerce, Social Business (Enterprise), Social Business Networks and Social Enterprise, Social Media, Platforms for Social Networking; Social Media Marketing, Enterprise 2.0, Improved Business Models. Entrepreneur Networks, Enterprise Social Networks, The Benefits and Limitations of Social Commerce, Benefits to Customers, Retailers, Employees, players in the ecosystem. Social Collaboration (Collaboration 2.0) - Essentials of Social Collaboration, Consumer-to-Consumer Electronic Commerce (C2C), Person-to-Person models. Internet of Things: Concept of IoT, Smart Homes and Appliances, Smart Cities, Smart Cars, Wearable Computing and Smart Gadgets
UNIT III DIGITAL BUSINESS ECOSYSTEM.pptxDrPrachiAjit
This document discusses key concepts in digital business ecosystems and e-commerce. It describes electronic commerce mechanisms like online purchasing processes and e-marketplaces. E-marketplaces are categorized into five types: product online marketplaces, online service marketplaces, online rental marketplaces, hybrid models, and hyperlocal marketplaces. The roles and components of e-marketplaces are also outlined, including customers, sellers, intermediaries, and support services.
Unit -1.Intro to Digital Business pptxDrPrachiAjit
This document discusses key concepts in digital business and electronic commerce. It covers topics like the digital revolution and how it has impacted society, the digital economy, e-business models, virtual communities, defining e-commerce, emerging e-commerce platforms, and the benefits and limitations of e-commerce. The document is presented over multiple pages with definitions and explanations of these important digital business and e-commerce terms.
1. The document discusses key concepts in research design including exploratory, descriptive, and quasi-experimental designs. It also covers variables, hypotheses, and different types of research approaches.
2. Key variable types are discussed such as independent, dependent, covariates, and how they relate to research studies.
3. The concepts of correlation versus causation are explained, noting that a correlation does not necessarily indicate one variable causing a change in another.
The document discusses key concepts in digital business and electronic commerce including: the digital revolution and how it has impacted society; definitions of digital economy, digital enterprise, virtual and online communities; defining electronic commerce and emerging e-commerce platforms; the content and frameworks of e-commerce; different e-commerce business models; and drivers of Web 2.0. It also briefly mentions classification of e-commerce transactions, integrating marketplaces with marketspaces, and benefits and limitations of e-commerce. The document is a lecture presented by Dr. Prachi Murkute on topics related to digital business and electronic commerce.
This document provides an overview of contract law in India, including the essential elements of a valid contract, types of contracts, and agency law. It discusses the key requirements for a valid contract such as offer and acceptance, lawful object and consideration, capacity to contract, and free consent. It also defines contracts of indemnity and guarantee, contingent contracts, quasi contracts, discharge of a contract, and breach of contract. Finally, it addresses agency relationships, noting an agent must act within the scope of authority conferred by the principal.
Unit -1 Business Research Methodology.pptxDrPrachiAjit
The document summarizes the key aspects of conducting business research. It discusses:
1. The foundations of research including defining research, the need for business research, characteristics of scientific research methods, and typical applications in business.
2. The research process including formulating the research problem, developing management, research, and investigation questions, conducting a literature review, identifying concepts and theories, determining sampling and data collection methods, analyzing data, and writing up findings.
3. Practical considerations for research including ethical values of the researcher and organization, principles around harming participants, informed consent, privacy, deception, and conflicts of interest, as well as legal issues concerning data management and copyright.
Ellen Burstyn: From Detroit Dreamer to Hollywood Legend | CIO Women MagazineCIOWomenMagazine
In this article, we will dive into the extraordinary life of Ellen Burstyn, where the curtains rise on a story that's far more attractive than any script.
HR search is critical to a company's success because it ensures the correct people are in place. HR search integrates workforce capabilities with company goals by painstakingly identifying, screening, and employing qualified candidates, supporting innovation, productivity, and growth. Efficient talent acquisition improves teamwork while encouraging collaboration. Also, it reduces turnover, saves money, and ensures consistency. Furthermore, HR search discovers and develops leadership potential, resulting in a strong pipeline of future leaders. Finally, this strategic approach to recruitment enables businesses to respond to market changes, beat competitors, and achieve long-term success.
4 Benefits of Partnering with an OnlyFans Agency for Content Creators.pdfonlyfansmanagedau
In the competitive world of content creation, standing out and maximising revenue on platforms like OnlyFans can be challenging. This is where partnering with an OnlyFans agency can make a significant difference. Here are five key benefits for content creators considering this option:
Best Competitive Marble Pricing in Dubai - ☎ 9928909666Stone Art Hub
Stone Art Hub offers the best competitive Marble Pricing in Dubai, ensuring affordability without compromising quality. With a wide range of exquisite marble options to choose from, you can enhance your spaces with elegance and sophistication. For inquiries or orders, contact us at ☎ 9928909666. Experience luxury at unbeatable prices.
𝐔𝐧𝐯𝐞𝐢𝐥 𝐭𝐡𝐞 𝐅𝐮𝐭𝐮𝐫𝐞 𝐨𝐟 𝐄𝐧𝐞𝐫𝐠𝐲 𝐄𝐟𝐟𝐢𝐜𝐢𝐞𝐧𝐜𝐲 𝐰𝐢𝐭𝐡 𝐍𝐄𝐖𝐍𝐓𝐈𝐃𝐄’𝐬 𝐋𝐚𝐭𝐞𝐬𝐭 𝐎𝐟𝐟𝐞𝐫𝐢𝐧𝐠𝐬
Explore the details in our newly released product manual, which showcases NEWNTIDE's advanced heat pump technologies. Delve into our energy-efficient and eco-friendly solutions tailored for diverse global markets.
[To download this presentation, visit:
https://www.oeconsulting.com.sg/training-presentations]
This PowerPoint compilation offers a comprehensive overview of 20 leading innovation management frameworks and methodologies, selected for their broad applicability across various industries and organizational contexts. These frameworks are valuable resources for a wide range of users, including business professionals, educators, and consultants.
Each framework is presented with visually engaging diagrams and templates, ensuring the content is both informative and appealing. While this compilation is thorough, please note that the slides are intended as supplementary resources and may not be sufficient for standalone instructional purposes.
This compilation is ideal for anyone looking to enhance their understanding of innovation management and drive meaningful change within their organization. Whether you aim to improve product development processes, enhance customer experiences, or drive digital transformation, these frameworks offer valuable insights and tools to help you achieve your goals.
INCLUDED FRAMEWORKS/MODELS:
1. Stanford’s Design Thinking
2. IDEO’s Human-Centered Design
3. Strategyzer’s Business Model Innovation
4. Lean Startup Methodology
5. Agile Innovation Framework
6. Doblin’s Ten Types of Innovation
7. McKinsey’s Three Horizons of Growth
8. Customer Journey Map
9. Christensen’s Disruptive Innovation Theory
10. Blue Ocean Strategy
11. Strategyn’s Jobs-To-Be-Done (JTBD) Framework with Job Map
12. Design Sprint Framework
13. The Double Diamond
14. Lean Six Sigma DMAIC
15. TRIZ Problem-Solving Framework
16. Edward de Bono’s Six Thinking Hats
17. Stage-Gate Model
18. Toyota’s Six Steps of Kaizen
19. Microsoft’s Digital Transformation Framework
20. Design for Six Sigma (DFSS)
To download this presentation, visit:
https://www.oeconsulting.com.sg/training-presentations
Industrial Tech SW: Category Renewal and CreationChristian Dahlen
Every industrial revolution has created a new set of categories and a new set of players.
Multiple new technologies have emerged, but Samsara and C3.ai are only two companies which have gone public so far.
Manufacturing startups constitute the largest pipeline share of unicorns and IPO candidates in the SF Bay Area, and software startups dominate in Germany.
The Most Inspiring Entrepreneurs to Follow in 2024.pdfthesiliconleaders
In a world where the potential of youth innovation remains vastly untouched, there emerges a guiding light in the form of Norm Goldstein, the Founder and CEO of EduNetwork Partners. His dedication to this cause has earned him recognition as a Congressional Leadership Award recipient.
Call8328958814 satta matka Kalyan result satta guessing➑➌➋➑➒➎➑➑➊➍
Satta Matka Kalyan Main Mumbai Fastest Results
Satta Matka ❋ Sattamatka ❋ New Mumbai Ratan Satta Matka ❋ Fast Matka ❋ Milan Market ❋ Kalyan Matka Results ❋ Satta Game ❋ Matka Game ❋ Satta Matka ❋ Kalyan Satta Matka ❋ Mumbai Main ❋ Online Matka Results ❋ Satta Matka Tips ❋ Milan Chart ❋ Satta Matka Boss❋ New Star Day ❋ Satta King ❋ Live Satta Matka Results ❋ Satta Matka Company ❋ Indian Matka ❋ Satta Matka 143❋ Kalyan Night Matka..
Brian Fitzsimmons on the Business Strategy and Content Flywheel of Barstool S...Neil Horowitz
On episode 272 of the Digital and Social Media Sports Podcast, Neil chatted with Brian Fitzsimmons, Director of Licensing and Business Development for Barstool Sports.
What follows is a collection of snippets from the podcast. To hear the full interview and more, check out the podcast on all podcast platforms and at www.dsmsports.net
Cover Story - China's Investment Leader - Dr. Alyce SUmsthrill
In World Expo 2010 Shanghai – the most visited Expo in the World History
https://www.britannica.com/event/Expo-Shanghai-2010
China’s official organizer of the Expo, CCPIT (China Council for the Promotion of International Trade https://en.ccpit.org/) has chosen Dr. Alyce Su as the Cover Person with Cover Story, in the Expo’s official magazine distributed throughout the Expo, showcasing China’s New Generation of Leaders to the World.
SATTA MATKA SATTA FAST RESULT KALYAN TOP MATKA RESULT KALYAN SATTA MATKA FAST RESULT MILAN RATAN RAJDHANI MAIN BAZAR MATKA FAST TIPS RESULT MATKA CHART JODI CHART PANEL CHART FREE FIX GAME SATTAMATKA ! MATKA MOBI SATTA 143 spboss.in TOP NO1 RESULT FULL RATE MATKA ONLINE GAME PLAY BY APP SPBOSS
Storytelling is an incredibly valuable tool to share data and information. To get the most impact from stories there are a number of key ingredients. These are based on science and human nature. Using these elements in a story you can deliver information impactfully, ensure action and drive change.
1. UNIT V -
Data Analysis & Report
Writing:
Dr. Prachi Murkute
2. Data Analysis & Report Writing
• Data Analysis: Cleaning of Data, Editing, Coding, Tabular representation of data, frequency tables, Univariate
analysis - Interpretation of Mean, Median Mode; Standard deviation, Coefficient of Variation.
• Graphical Representation of Data: Appropriate Usage of Bar charts, Pie charts, Line charts, Histograms.
• Bivariate Analysis: Cross tabulations, Bivariate Correlation Analysis - meaning & types of correlation, Karl
Person’s coefficient of correlation and spearman’s rank correlation. Chi-square test including testing
hypothesis of association, association of attributes.
• Linear Regression Analysis: Meaning of regression, Purpose and use, Linear regression; Interpretation of
regression co-efficient, Applications in business scenarios.
• Test of Significance: Small sample tests: t (Mean, proportion) and F tests, Z test. Non-parametric tests:
Binomial test of proportion, Randomness test. Analysis of Variance: One way and two-way Classifications.
• Research Reports: Structure of Research report, Report writing and Presentation.
3/5/2023 Dr. Prachi Murkute 2
3. Cleaning of Data,
• Data cleaning is the process of fixing or removing incorrect,
corrupted, incorrectly formatted, duplicate, or incomplete
data within a dataset. When combining multiple data sources,
there are many opportunities for data to be duplicated or
mislabeled.
3/5/2023 Dr. Prachi Murkute 3
4. Editing,
• Data editing is the process of "improving" collected survey
data. The improvement involves finding erroneous data and
then correcting it. Errors may have happened along the way
from the respondent to the survey organization's data files for
various reasons, intended or unintended.
3/5/2023 Dr. Prachi Murkute 4
5. Coding • Coding is a qualitative data analysis strategy
in which some aspect of the data is
assigned a descriptive label that allows the
researcher to identify related content across
the data. How you decide to code - or whether
to code- your data should be driven by your
methodology.
3/5/2023 Dr. Prachi Murkute 5
6. Tabular representation
of data,
• In tabular representation of data, the given data
set is presented in rows and columns. When a
table is used to represent a large amount of data
in an arranged, organised, engaging, coordinated
and easy to read form it is called the tabular
representation of data.
3/5/2023 Dr. Prachi Murkute 6
7. Frequency tables,
• Frequency refers to
the number of times
an event or a value
occurs. A frequency
table is a table that
lists items and
shows the number
of times the items
occur.
3/5/2023 Dr. Prachi Murkute 7
8. Mean
For example, mean of 2, 6, 4, 5, 8
is: Mean = (2 + 6 + 4 + 5 + 8) / 5 =
25/5 = 5.
3/5/2023 Dr. Prachi Murkute 8
9. Median
• Median, in statistics, is the
middle value of the
given list of data when
arranged in an order.
What is the median of 4 and 7?
The mean of these middle values is (4 + 7) /
2 = 5.5 , so the median is 5.5
3/5/2023 Dr. Prachi Murkute 9
12. Standard deviation
• A standard deviation (or
σ) is a measure of how
dispersed the data is in
relation to the mean.
Low standard deviation
means data are clustered
around the mean, and
high standard deviation
indicates data are more
spread out.
3/5/2023 Dr. Prachi Murkute 12
13. Coefficient of Variation
Coefficient of variation is a
relative measure of
dispersion that is used to
determine the variability of
data. It is expressed as a
ratio of the standard
3/5/2023 Dr. Prachi Murkute 13
14. Graphical Representation of Data:
Appropriate Usage of Bar charts,
• Bar charts should be used when
you are showing segments of
information. Vertical bar charts
are useful to compare different
categorical or discrete variables,
such as age groups, classes,
schools, etc., as long as there are
not too many categories to
compare. They are also very
useful for time series data.
3/5/2023 Dr. Prachi Murkute 14
15. Pie charts, Line charts, Histograms
3/5/2023 Dr. Prachi Murkute 15
16. Bivariate Analysis
• Cross tabulations, Bivariate Correlation Analysis - meaning & types of
correlation, Karl Person’s coefficient of correlation and spearman’s
rank correlation. Chi-square test including testing hypothesis of
association, association of attributes.
3/5/2023 Dr. Prachi Murkute 16
17. Cross tabulations
• Cross tabulations are data
tables that display not
only the results of the
entire group of
respondents, but also
the results from
specifically defined
subgroups.
3/5/2023 Dr. Prachi Murkute 17
18. Bivariate Correlation Analysis - meaning &
types of correlation
• A bivariate correlation analyzes
whether and how two
variables covary linearly, that
is, whether the variance of one
changes in a linear fashion as
the variance of the other
changes.
3/5/2023 Dr. Prachi Murkute 18
19. Types of correlation
• There are three types of correlation:
1. Positive and negative correlation.
2. Linear and non-linear correlation.
3. Simple, multiple, and partial correlation.
3/5/2023 Dr. Prachi Murkute 19
20. Positive and negative correlation
• For example, when
two stocks move in
the same direction,
the correlation
coefficient is positive.
Conversely, when two
stocks move in
opposite directions, the
correlation coefficient is
negative.
3/5/2023 Dr. Prachi Murkute 20
21. Linear and non-linear
correlation • Linear correlation is
defined when the ratio of
proportion of two given
variables are
same/constant.
• Example- every time when
the income increases by
20% there is a rise in
expenditure of 5%.
• Non-linear correlation is
defined as when the ratio
of variations between two
given variables changes.
3/5/2023 Dr. Prachi Murkute 21
23. Karl Person’s coefficient of correlation and
spearman’s rank correlation.
• Karl Person’s coefficient of
correlation- Karl Pearson's
coefficient of correlation is defined
as a linear correlation
coefficient that falls in the value
range of -1 to +1. Value of -1
signifies strong negative
correlation while +1 indicates
strong positive correlation.
3/5/2023 Dr. Prachi Murkute 23
24. spearman’s rank
correlation
• Spearman's rank
correlation measures the strength
and direction of association
between two ranked variables. It
basically gives the measure of
monotonicity of the relation between
two variables i.e. how well the
relationship between two variables
could be represented using a
monotonic function.
3/5/2023 Dr. Prachi Murkute 24
25. Chi-square test
• A chi-squared test (symbolically represented as χ2) is basically
a data analysis on the basis of observations of a random set of
variables. Usually, it is a comparison of two statistical data sets.
This test was introduced by Karl Pearson in 1900 for categorical
data analysis and distribution. So, it was mentioned
as Pearson’s chi-squared test.
• The chi-square test is used to estimate how likely the
observations that are made would be, by considering the
assumption of the null hypothesis as true.
3/5/2023 Dr. Prachi Murkute 25
26. Linear Regression Analysis:
• Meaning of regression- A regression is a statistical technique
that relates a dependent variable to one or more
independent (explanatory) variables. A regression model is
able to show whether changes observed in the dependent
variable are associated with changes in one or more of the
explanatory variables.
• Purpose and use: Regression allows researchers to predict or
explain the variation in one variable based on another
variable. Definitions: ❖ The variable that researchers are trying
to explain or predict is called the response variable. It is also
sometimes called the dependent variable because it depends
on another variable.
3/5/2023 Dr. Prachi Murkute 26
27. Linear regression; Interpretation of regression co-
efficient
• A positive coefficient indicates
that as the value of the
independent variable increases,
the mean of the dependent
variable also tends to increase.
A negative coefficient suggests
that as the independent variable
increases, the dependent variable
tends to decrease.
3/5/2023 Dr. Prachi Murkute 27
29. Small sample tests: t (Mean, proportion)
• If the sample size is less than 30 i.e., n < 30, the
sample may be regarded as small sample. and it is
popularly known as t-test or students' t-distribution
or students' distribution. Let us take the null
hypothesis that there is no significant difference
between the sample mean and population mean.
3/5/2023 Dr. Prachi Murkute 29
30. F tests
• An F-test is any statistical test in
which the test statistic has an F-
distribution under the null
hypothesis. It is most often used
when comparing
3/5/2023 Dr. Prachi Murkute 30
31. Non-parametric tests: Binomial test of
proportion, Randomness test.
• Binomial test of proportion -
A binomial test uses
sample data to determine
if the population
proportion of one level in
a binary (or dichotomous)
variable equals a specific
claimed value.
3/5/2023 Dr. Prachi Murkute 31
32. Randomness
Test
• To test the run test of
randomness, first set up
the null and alternative
hypothesis. In run test of
randomness, null
hypothesis assumes that
the distributions of the two
continuous populations
are the same. The
alternative hypothesis will
be the opposite of the null
hypothesis.
3/5/2023 Dr. Prachi Murkute 32
34. Research Reports: Structure of Research
report, Report writing and Presentation
• A research report is a well-
crafted document that outlines
the processes, data, and
findings of a systematic
investigation.
• It is an important document that
serves as a first-hand account
of the research process, and it
is typically considered as an
objective and accurate source
of information.
A complete research paper is
reporting on experimental
research will typically contain
a Title page, Abstract,
Introduction, Methods,
Results, Discussion, and
References sections. Many
will also contain Figures and
Tables and some will have an
Appendix or Appendices.
3/5/2023 Dr. Prachi Murkute 34