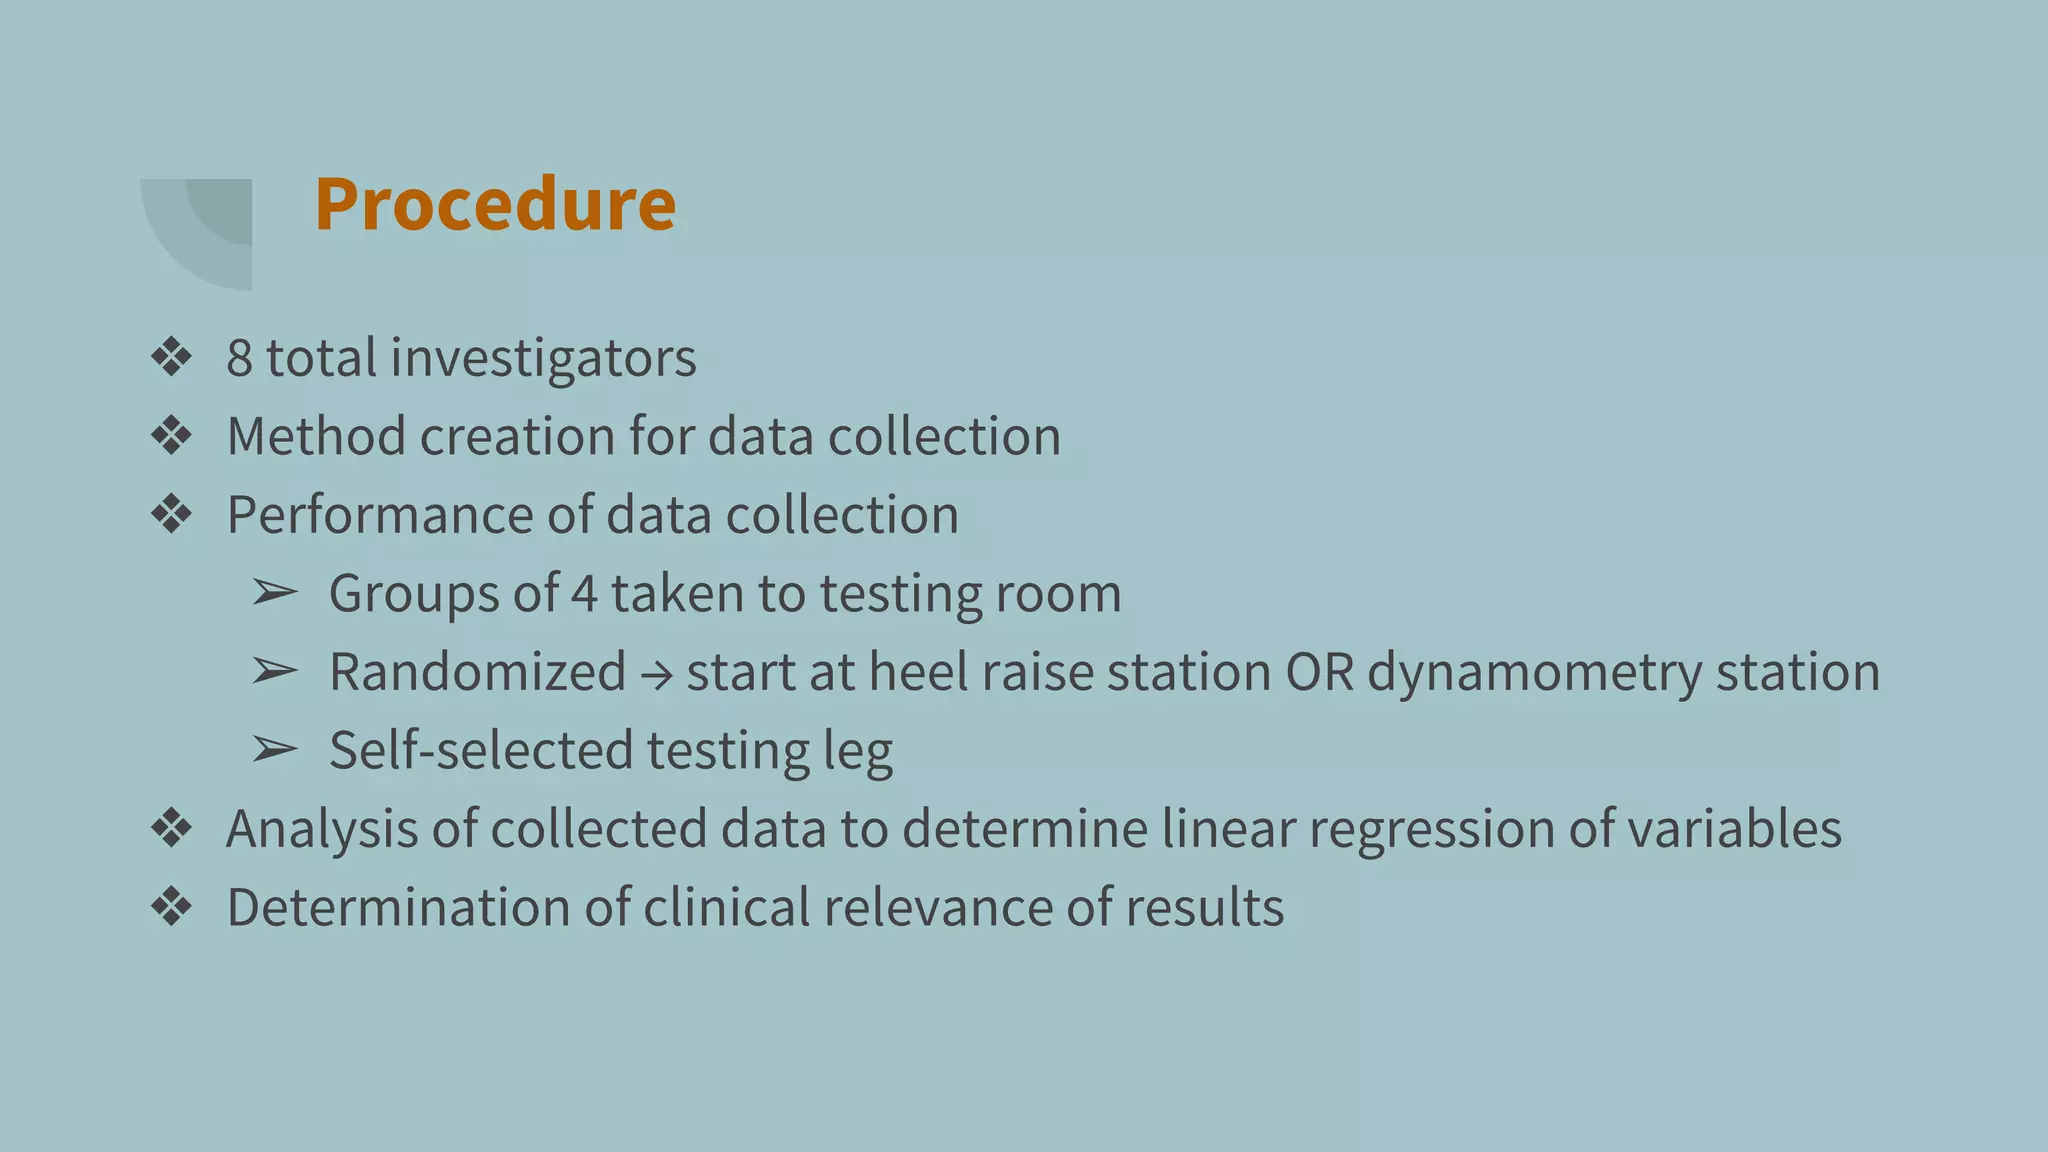
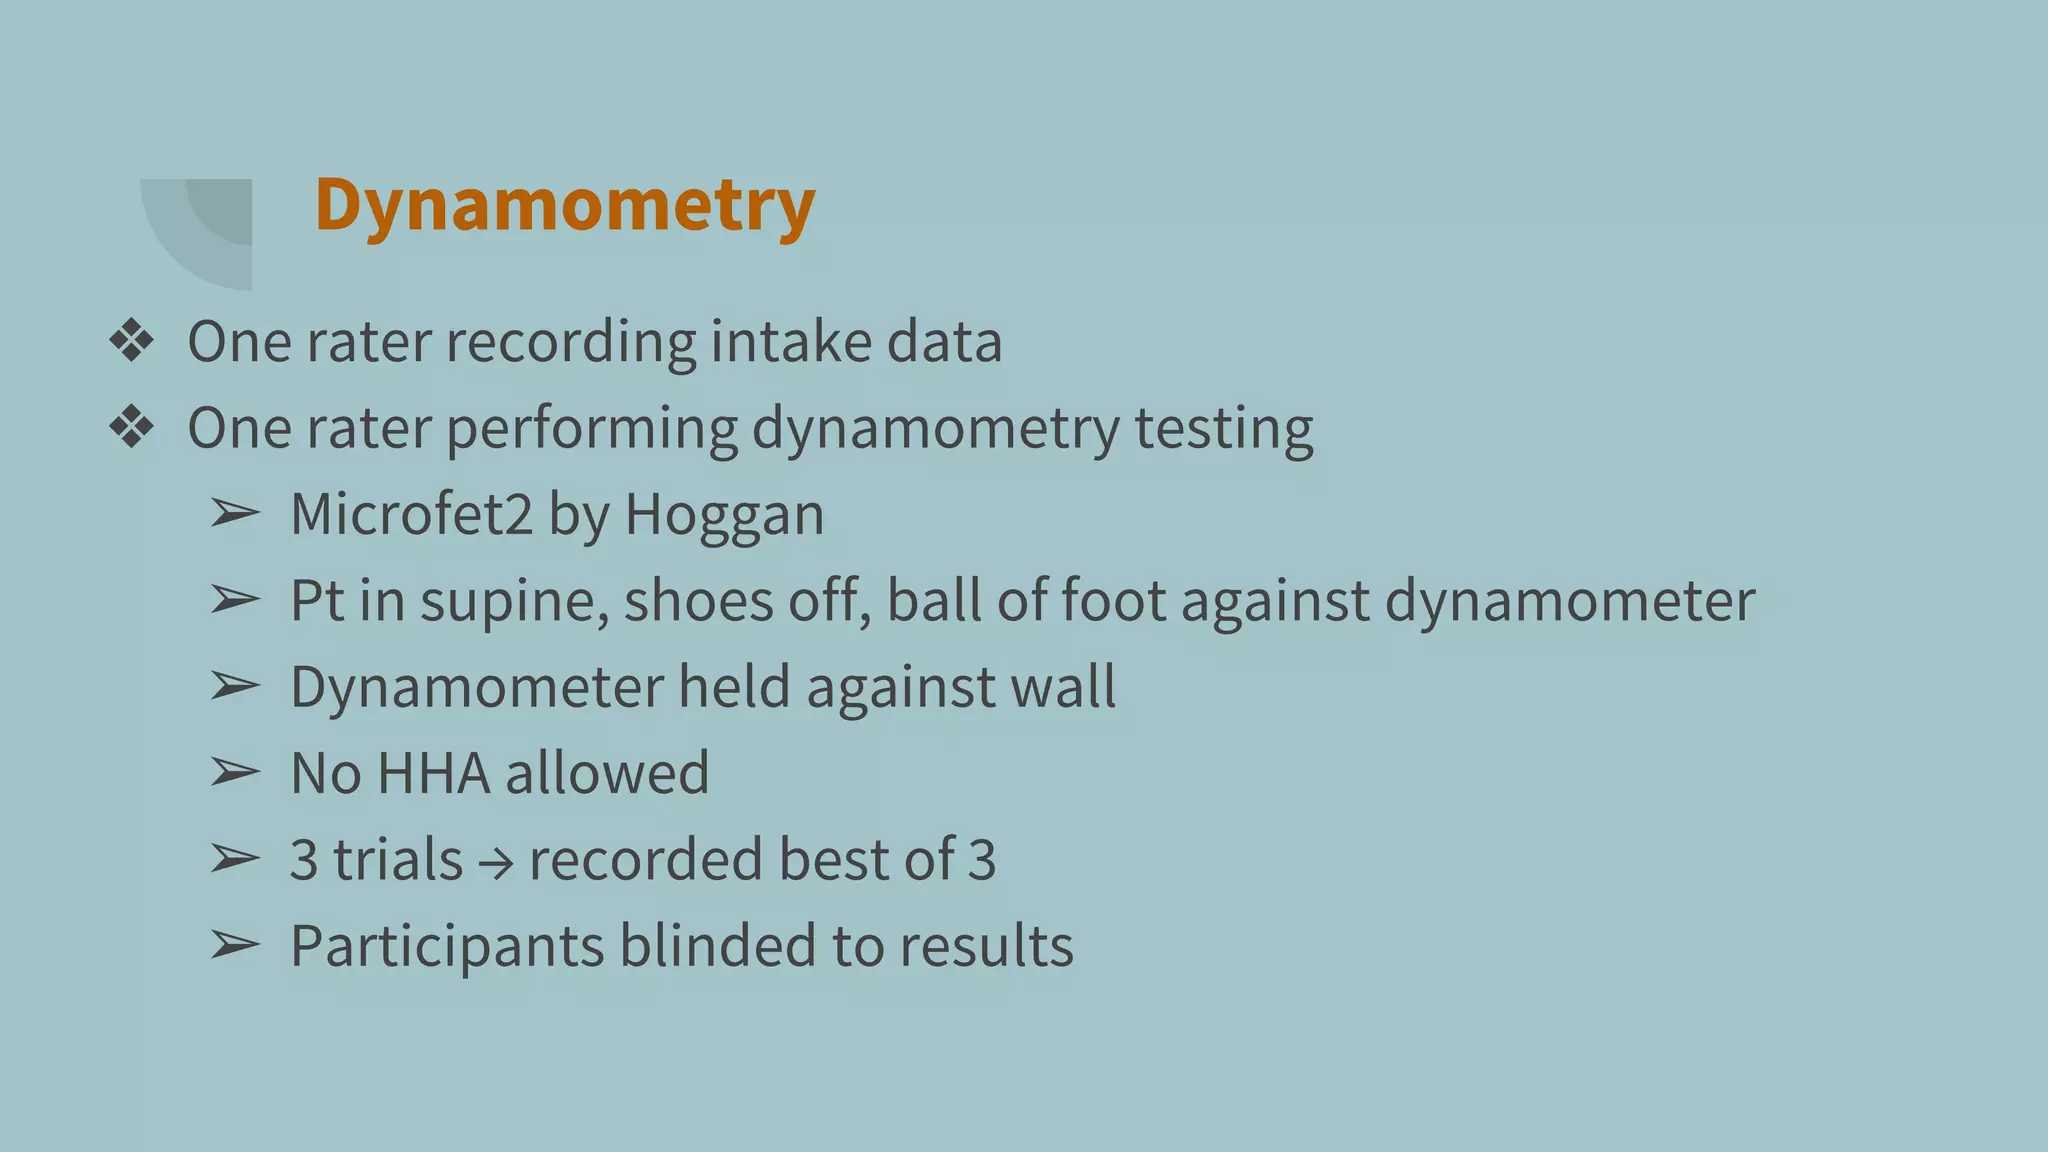
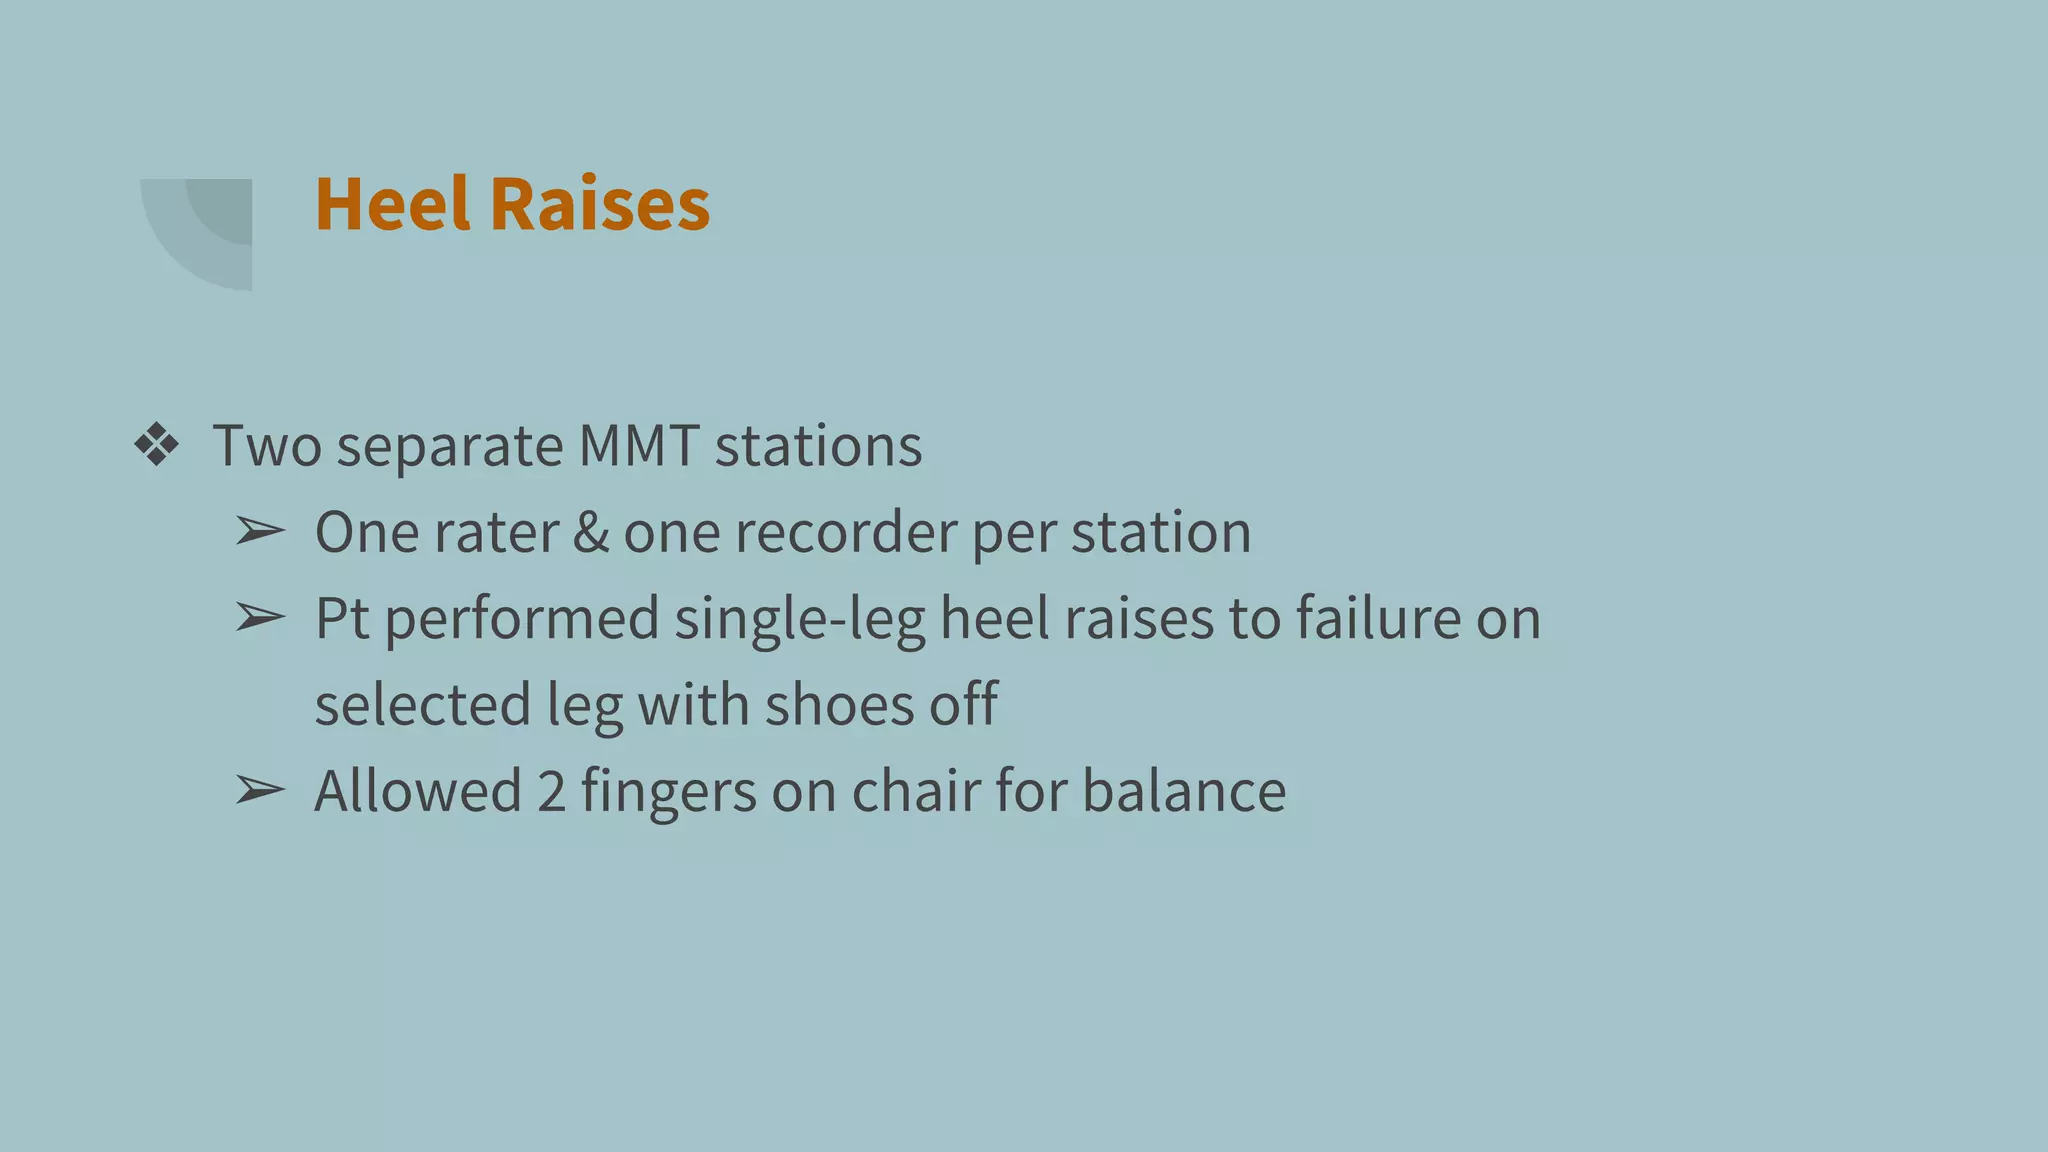
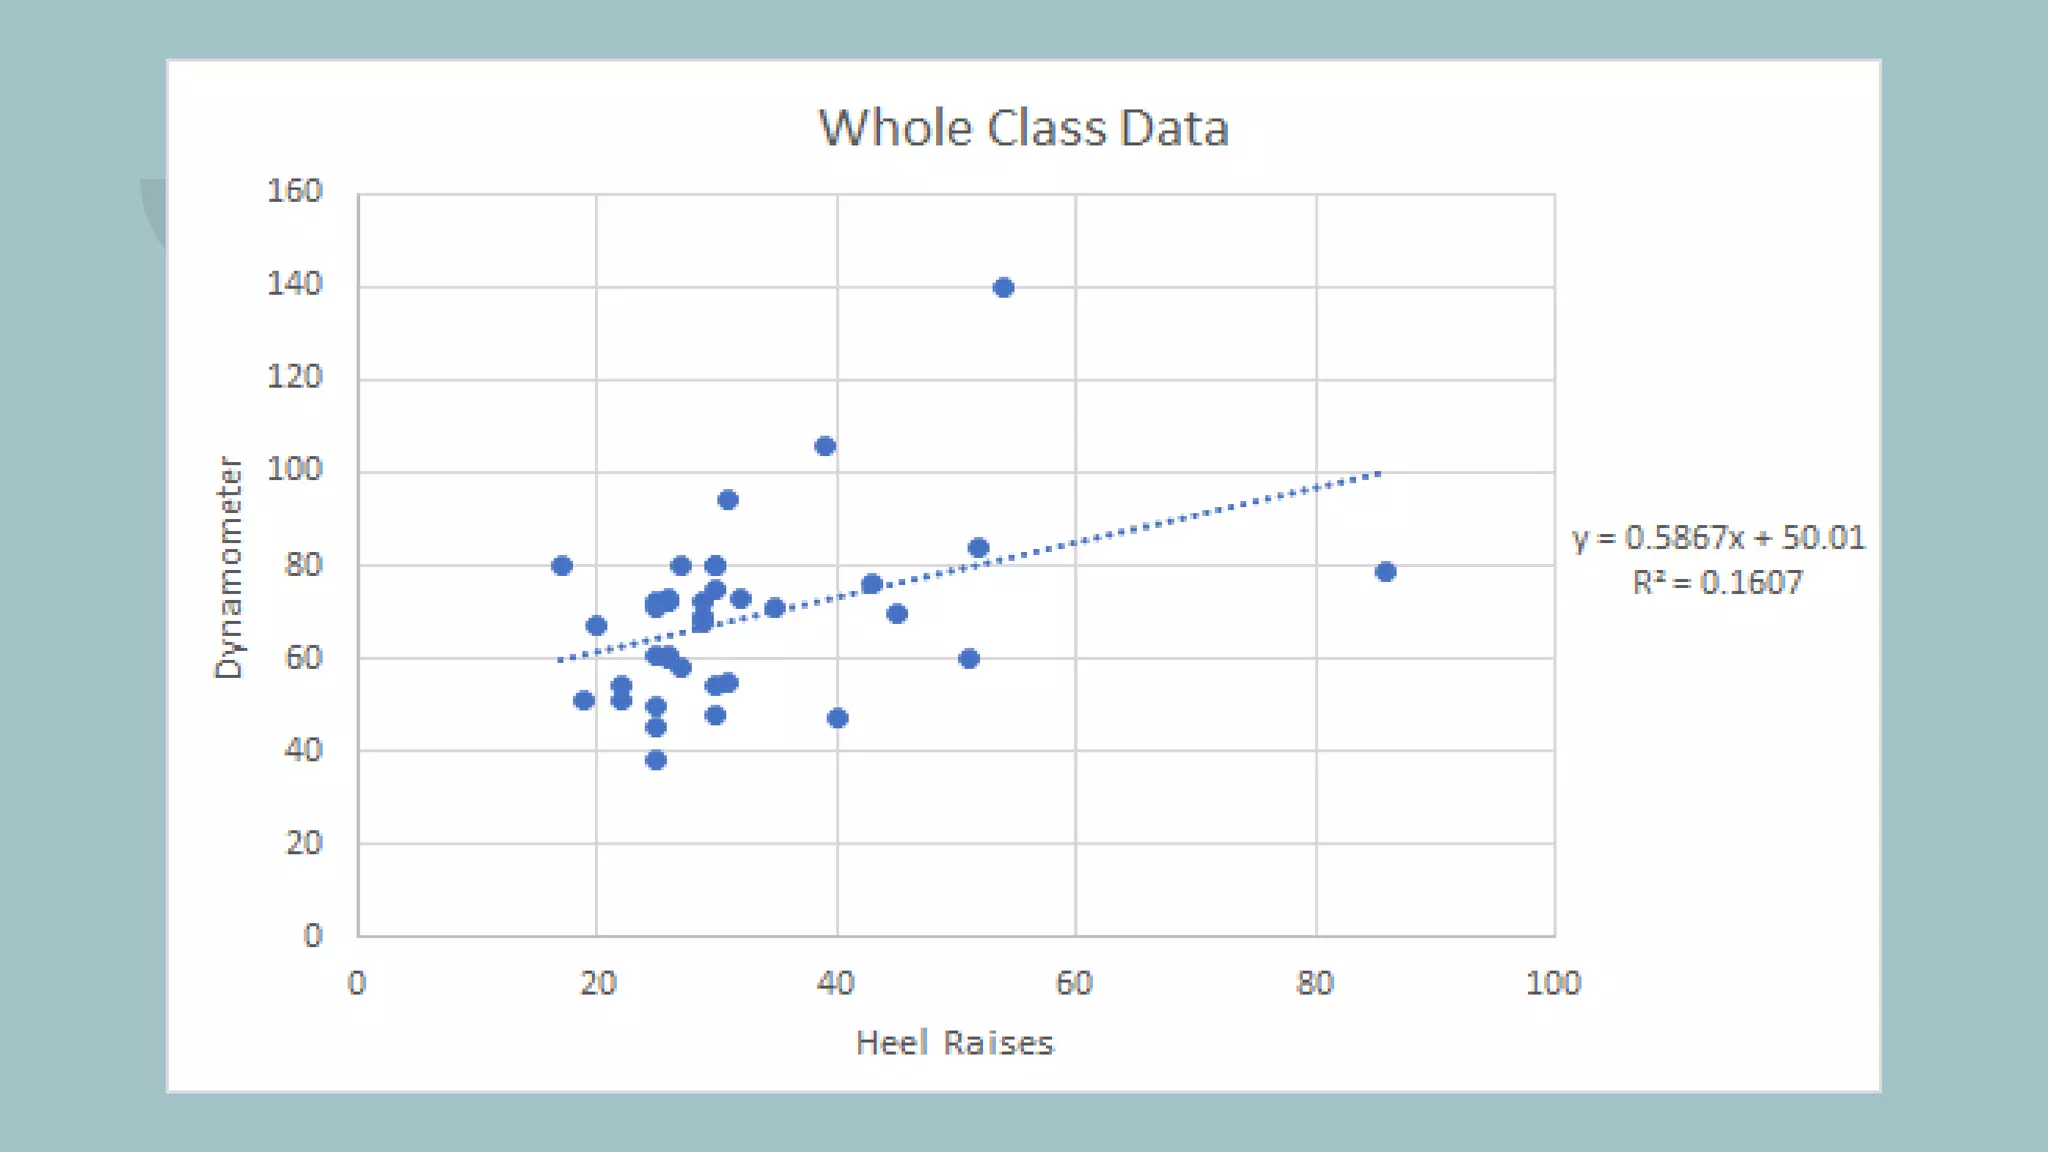
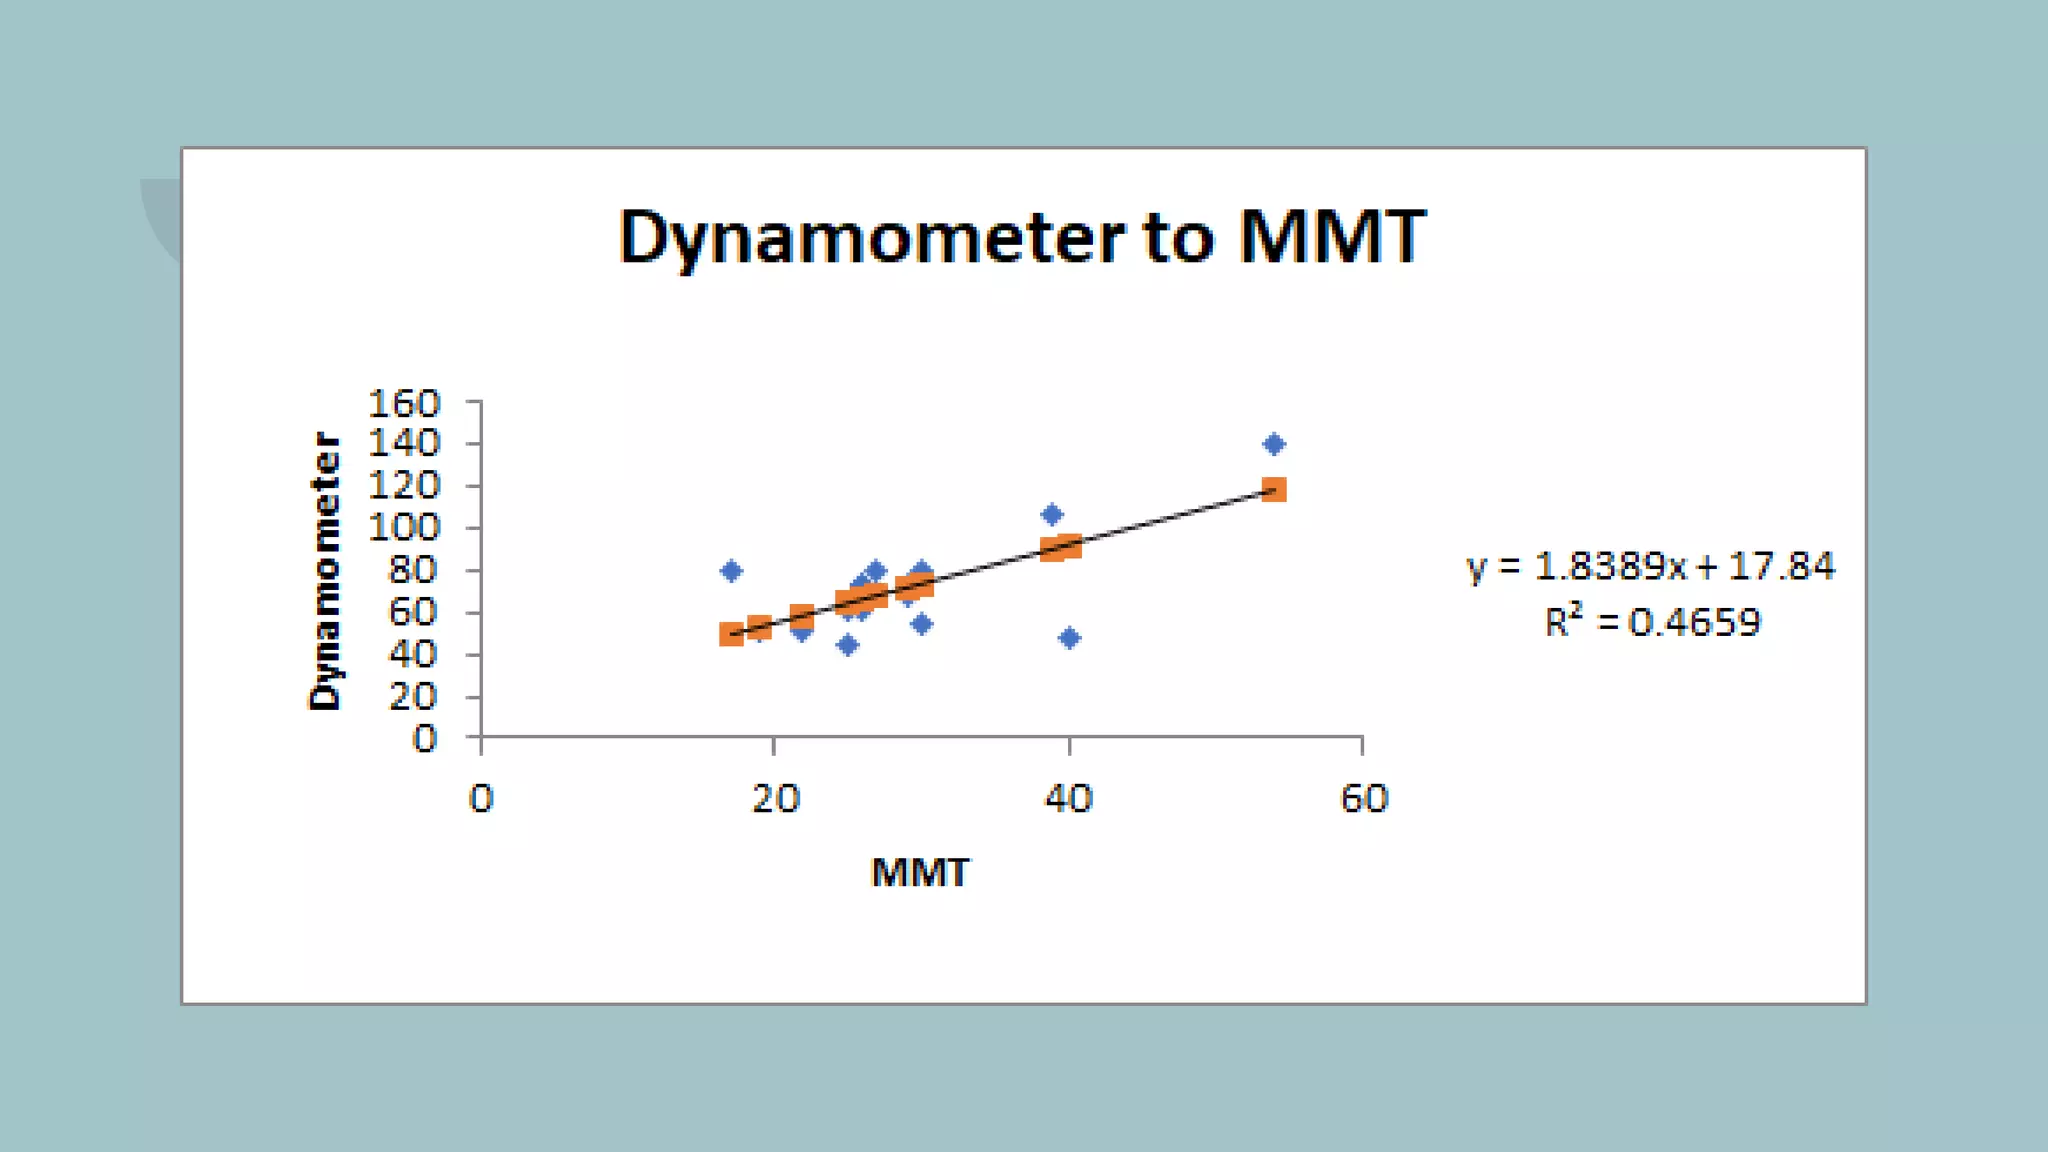
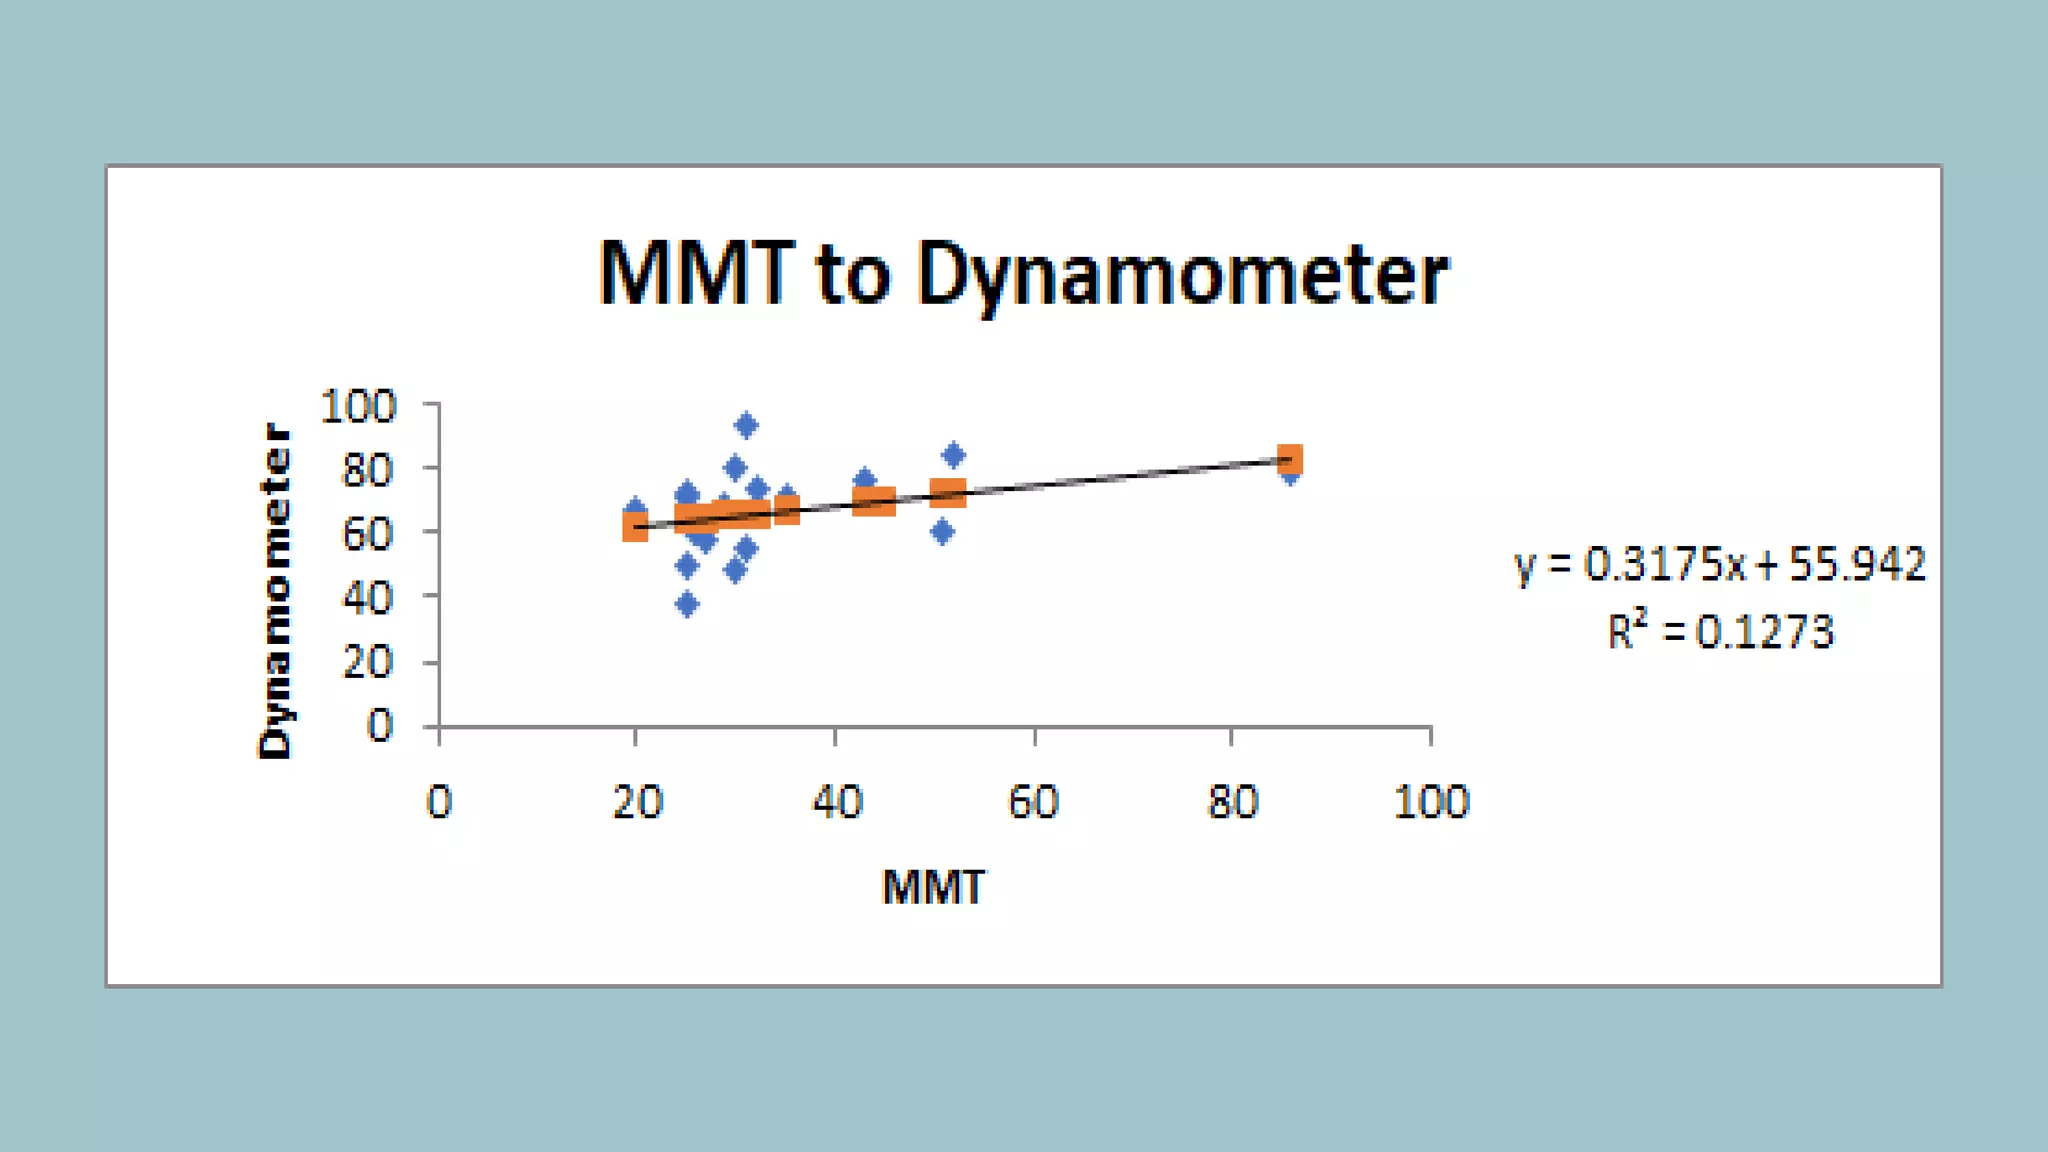
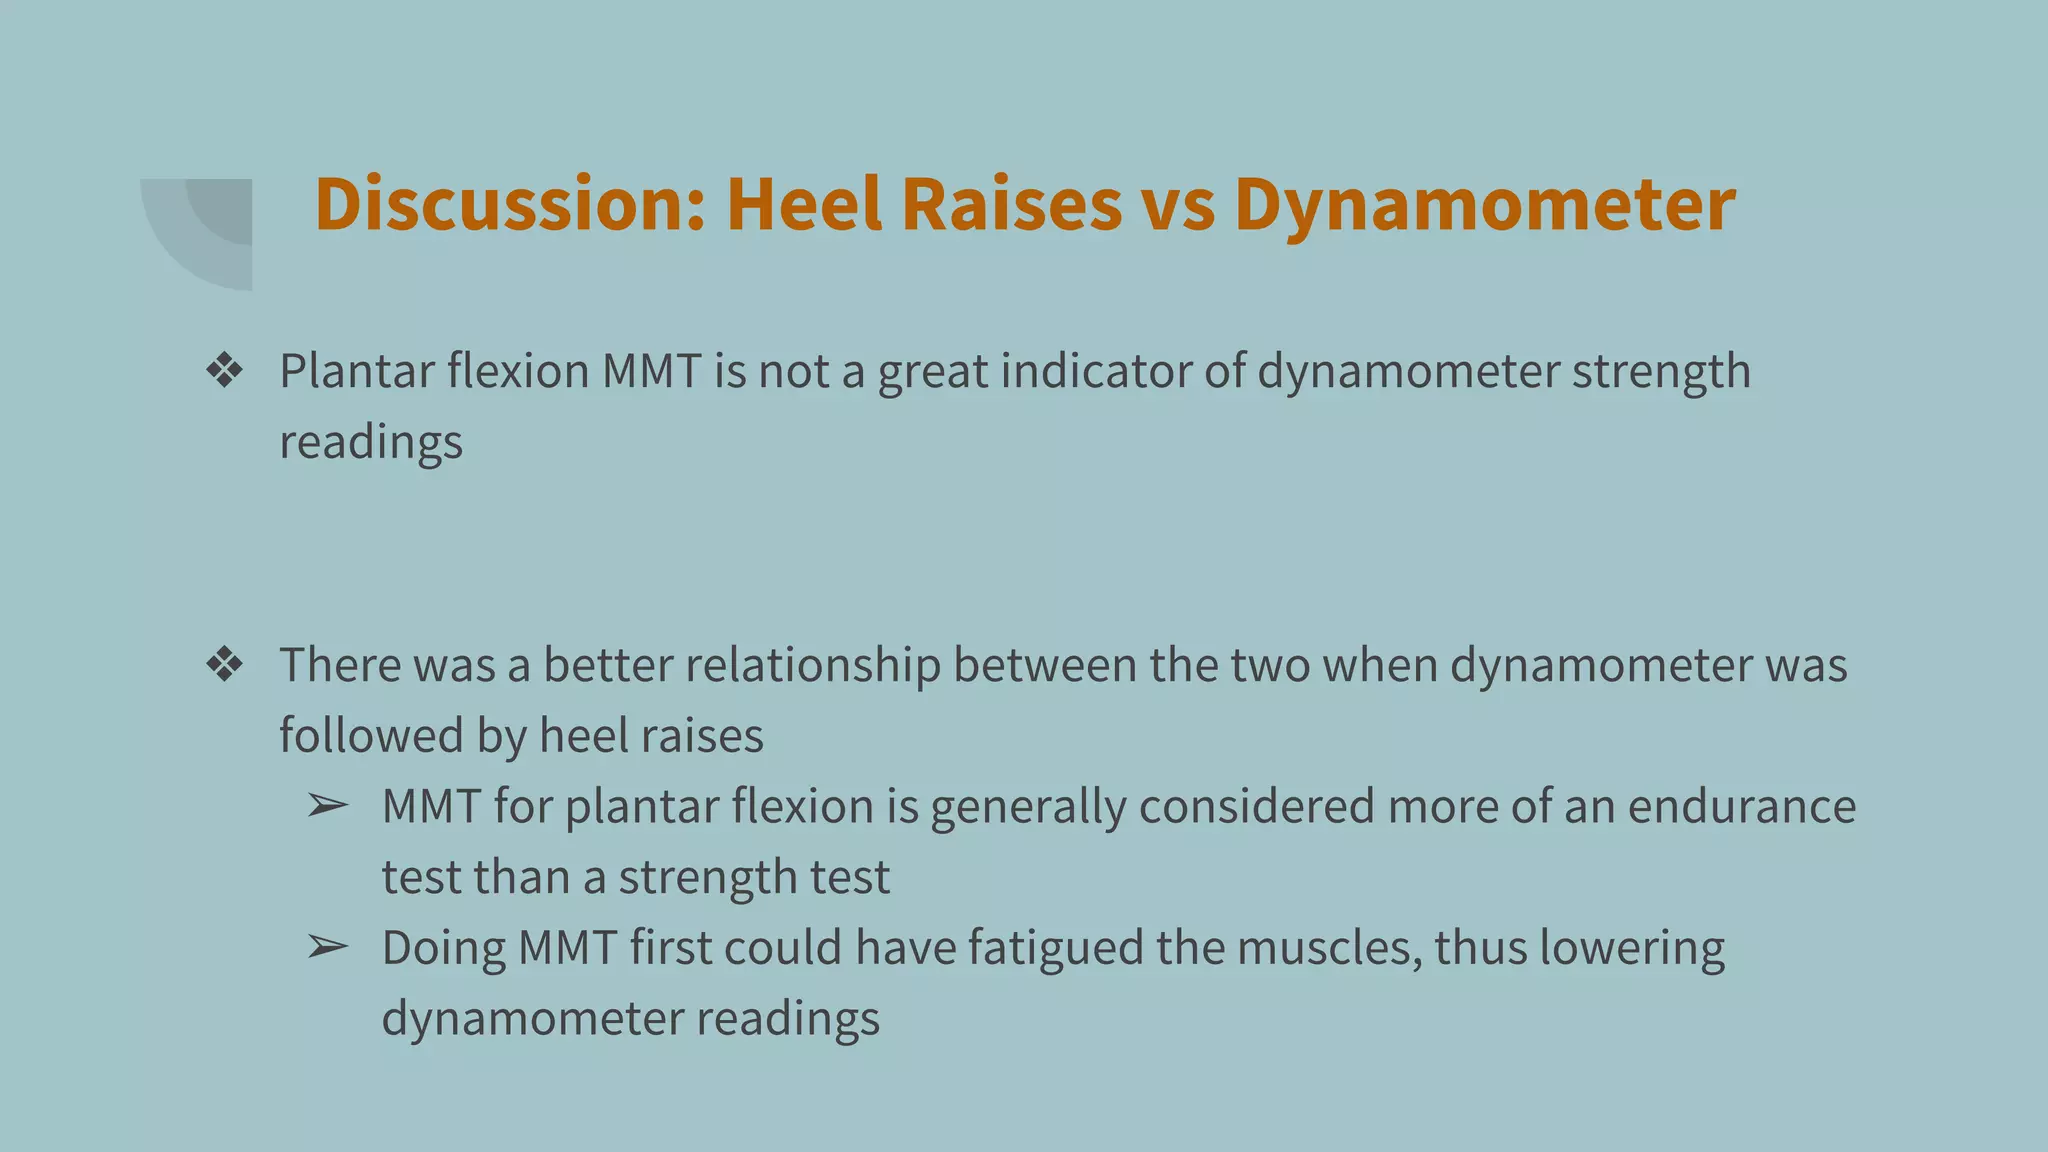
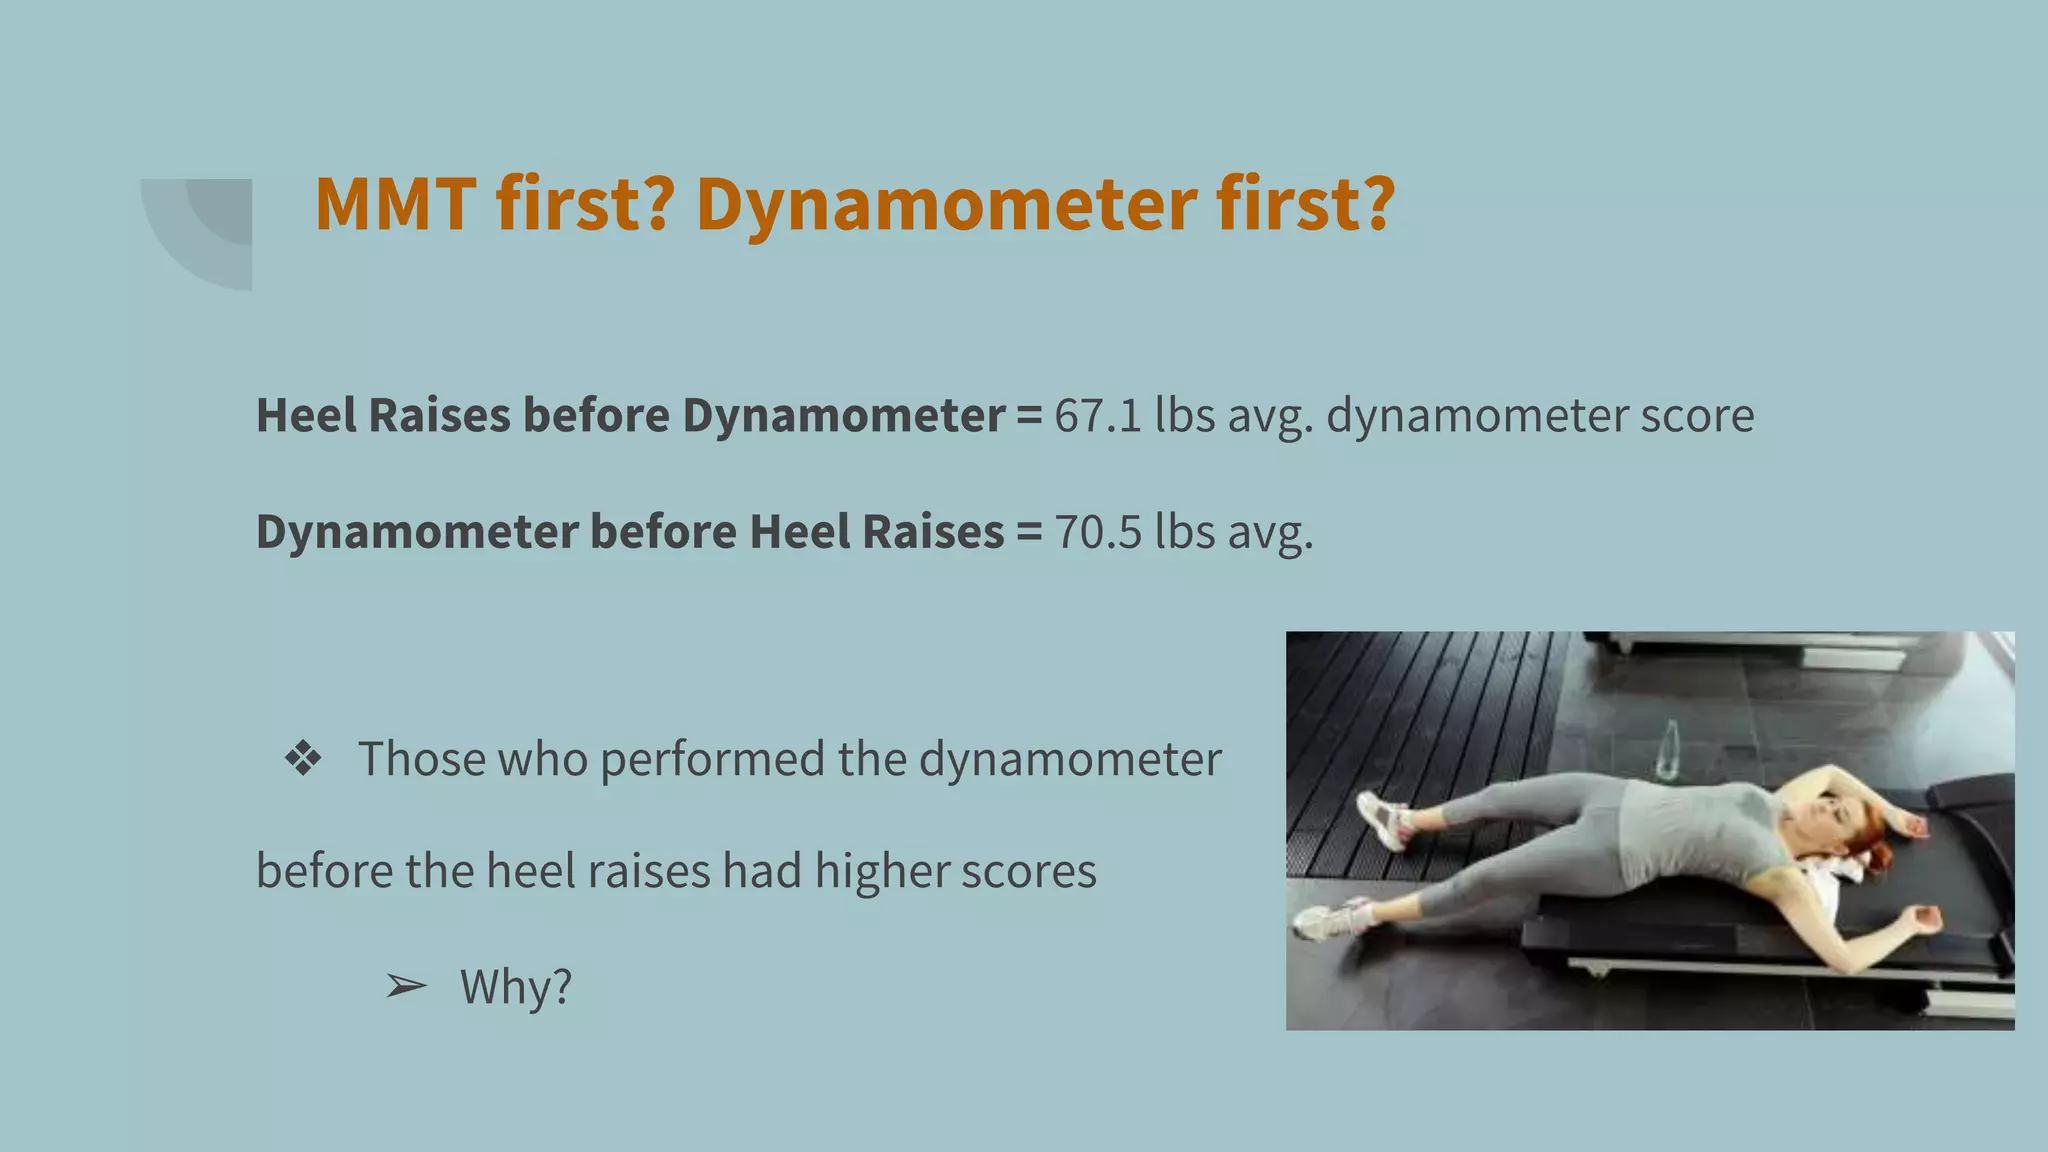
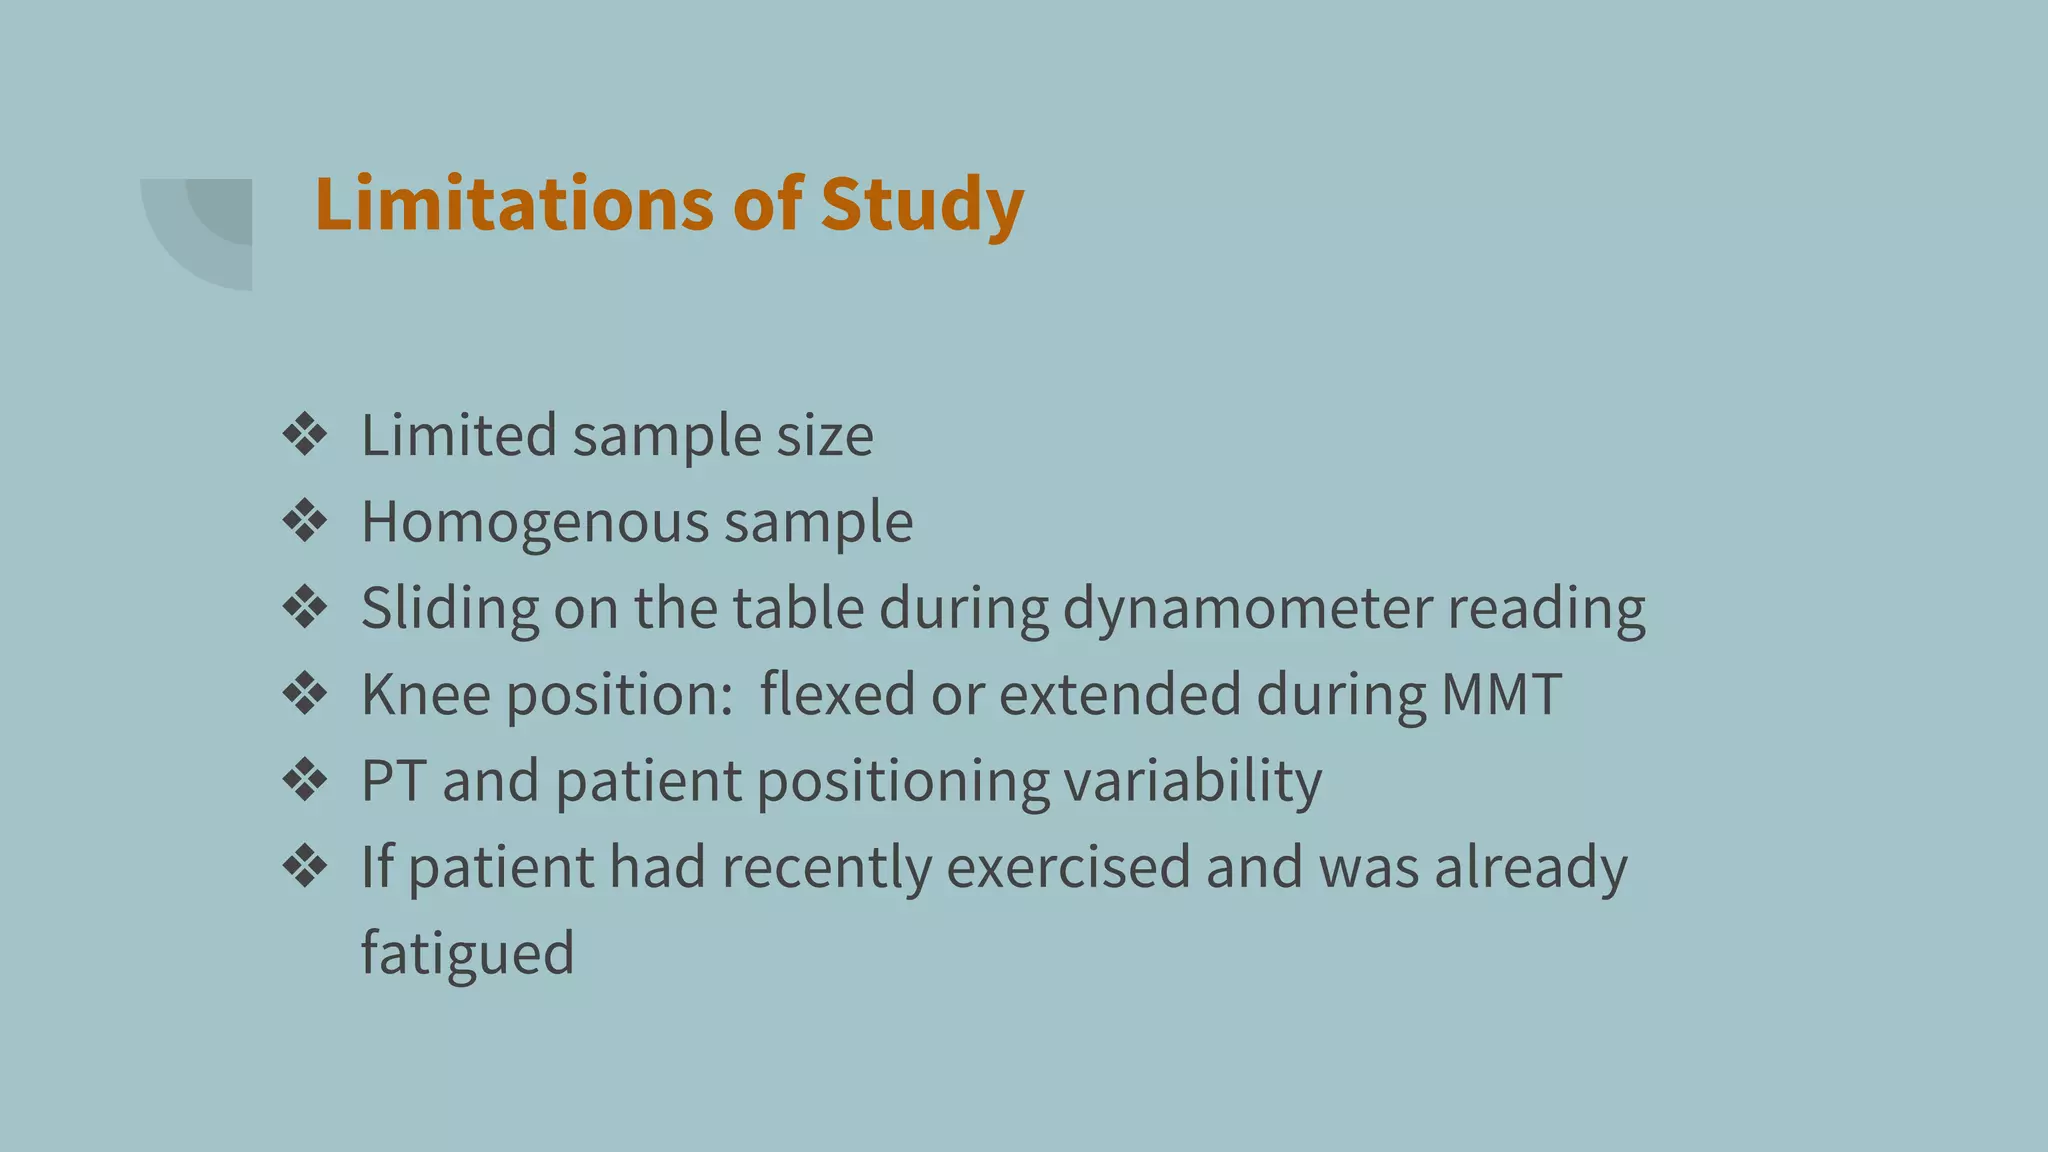
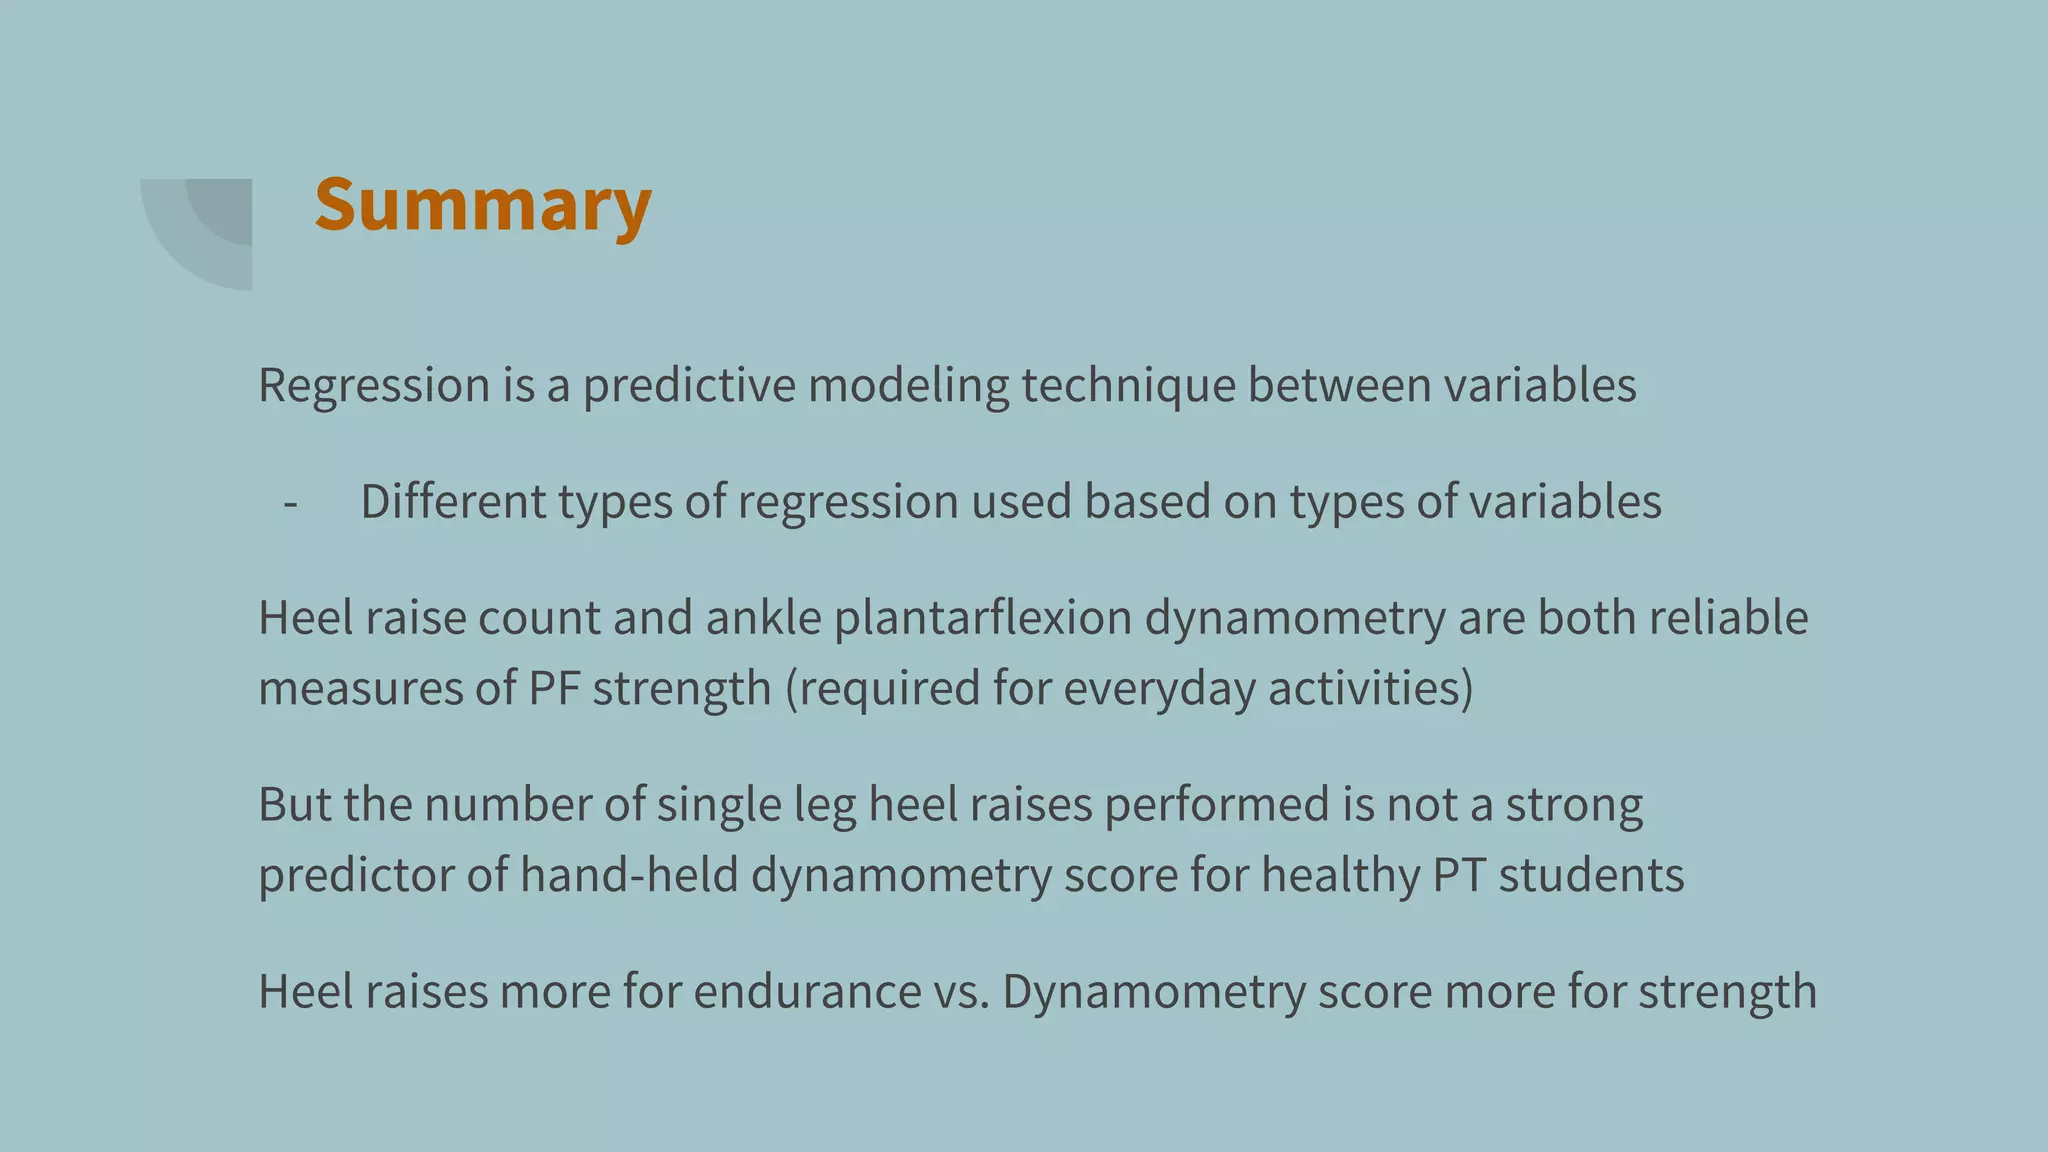
This video discusses regression analysis techniques and provides an example study comparing the number of single-leg heel raises to ankle plantarflexion strength as measured by dynamometry. Simple linear regression was used to analyze the relationship between the independent variable of heel raise count and dependent variable of dynamometry score. The results showed heel raise count was not a strong predictor of dynamometry score. Heel raises may be a better test of endurance while dynamometry provides a measure of strength.
The document provides an overview of regression analysis. It defines regression analysis as a technique used to estimate the relationship between a dependent variable and one or more independent variables. The key purposes of regression are to estimate relationships between variables, determine the effect of each independent variable on the dependent variable, and predict the dependent variable given values of the independent variables. The document also outlines the assumptions of the linear regression model, introduces simple and multiple regression, and describes methods for model building including variable selection procedures.
This document is a presentation by Dwaiti Roy on partial correlation. It begins with an acknowledgement section thanking various professors and resources that helped in preparing the presentation. It then provides definitions and explanations of key concepts related to partial correlation such as correlation, assumptions of correlation, coefficient of correlation, coefficient of determination, variates, partial correlation, assumptions and hypothesis of partial correlation, order and formula of partial correlation. Examples are provided to illustrate partial correlation. The document concludes with references and suggestions for further reading.
This document presents information about regression analysis. It defines regression as the dependence of one variable on another and lists the objectives as defining regression, describing its types (simple, multiple, linear), assumptions, models (deterministic, probabilistic), and the method of least squares. Examples are provided to illustrate simple regression of computer speed on processor speed. Formulas are given to calculate the regression coefficients and lines for predicting y from x and x from y.
This document discusses various statistical methods used to organize and interpret data. It describes descriptive statistics, which summarize and simplify data through measures of central tendency like mean, median, and mode, and measures of variability like range and standard deviation. Frequency distributions are presented through tables, graphs, and other visual displays to organize raw data into meaningful categories.
This document discusses correlation and regression analysis. It defines correlation analysis as examining the relationship between two or more variables, and regression analysis as examining how one variable changes when another specific variable changes in volume. It covers positive and negative correlation, linear and non-linear correlation, and how to calculate the coefficient of correlation. Regression analysis and regression equations are introduced for using a known variable to predict an unknown variable. Examples are provided to illustrate key concepts.
Please Subscribe to this Channel for more solutions and lectures
http://www.youtube.com/onlineteaching
Chapter 12: Analysis of Variance
12.1: One-Way ANOVA
This document provides an overview of various quantitative data analysis techniques including parametric and non-parametric statistics, descriptive statistics, contingency analysis, t-tests, ANOVA, correlation, and regression. It discusses assumptions and processes for each technique and how to interpret results. Computer software like SPSS and SAS can be used to analyze large, complex datasets.
The document provides an overview of different types of research designs including experimental, quasi-experimental, ex-post facto, correlational, and their key features. Experimental designs aim to test hypotheses and establish causation through random assignment and manipulation of independent variables. Quasi-experimental designs are similar but do not use random assignment. Ex-post facto designs examine causes of effects that have already occurred. Correlational designs measure relationships between non-manipulated variables. Different designs have advantages for different research questions depending on feasibility and need for control.
Thesis defense presentation of Justin Phillips (SDSU). "The Role of Relatedness and Autonomy in Motivation of Youth Physical Activity: A Self-Determination Perspective."
- Regression analysis is a statistical technique for modeling relationships between variables, where one variable is dependent on the others. It allows predicting the average value of the dependent variable based on the independent variables.
- The key assumptions of regression models are that the error terms are normally distributed with zero mean and constant variance, and are independent of each other.
- Linear regression specifies that the dependent variable is a linear combination of the parameters, though the independent variables need not be linearly related. In simple linear regression with one independent variable, the least squares estimates of the intercept and slope are calculated to minimize the sum of squared errors.
The document provides an introduction to regression analysis and performing regression using SPSS. It discusses key concepts like dependent and independent variables, assumptions of regression like linearity and homoscedasticity. It explains how to calculate regression coefficients using the method of least squares and how to perform regression analysis in SPSS, including selecting variables and interpreting the output.
Regression analysis mathematically and statistically describes the relationship between a set of independent variables and a dependent variable. This presentation describes the concept of regression and its types with suitable illustrations. This presentation also explains the regression analysis spss path and its interpretations.
Multiple regression analysis is a powerful technique used for predicting the unknown value of a variable from the known value of two or more variables.
This document discusses different measures of variability in data sets. It outlines that variability measures the spread of a data set and identifies the most common measures as range, variance, and standard deviation. Variance is calculated as the mean of the squared deviations from the mean. Standard deviation takes the square root of the variance and provides a measure of how far data points typically are from the average.
This chapter summary covers simple linear regression models. Key topics include determining the simple linear regression equation, measures of variation such as total, explained, and unexplained sums of squares, assumptions of the regression model including normality, homoscedasticity and independence of errors. Residual analysis is discussed to examine linearity and assumptions. The coefficient of determination, standard error of estimate, and Durbin-Watson statistic are also introduced.
Introduces and explains the use of multiple linear regression, a multivariate correlational statistical technique. For more info, see the lecture page at http://goo.gl/CeBsv. See also the slides for the MLR II lecture http://www.slideshare.net/jtneill/multiple-linear-regression-ii
- The document discusses simple linear regression analysis and how to use it to predict a dependent variable (y) based on an independent variable (x).
- Key points covered include the simple linear regression model, estimating regression coefficients, evaluating assumptions, making predictions, and interpreting results.
- Examples are provided to demonstrate simple linear regression analysis using data on house prices and sizes.
Partial Correlation, Multiple Correlation And Multiple Regression AnalysisSundar B N
This document discusses correlation and regression analysis. It defines partial correlation as assessing the relationship between two variables while controlling for the effect of a third variable. Multiple correlation is defined as measuring the strength of the relationship between a single dependent variable and two or more independent variables. Formulas are provided for partial correlation coefficients measuring the correlation between different pairs of variables while controlling for others. Multiple correlation coefficients are also defined as measuring the correlation between a dependent variable and the combination of multiple independent variables.
this presentation defines basics of regression analysis for students and scholars. uses, objectives, types of regression, use of spss for regression and various tools available in the market to calculate regression analysis
This document discusses statistical tests for comparing groups on continuous and categorical outcomes. For binary outcomes, it describes chi-square tests, logistic regression, McNemar's tests, and conditional logistic regression for independent and correlated groups. For continuous outcomes, it discusses t-tests, ANOVA, linear regression, paired t-tests, repeated measures ANOVA, mixed models, and non-parametric alternatives. It also provides examples of calculating odds ratios, standard errors, and performing hypothesis tests like the two-sample t-test.
- Regression analysis is a statistical tool used to examine relationships between variables and can help predict future outcomes. It allows one to assess how the value of a dependent variable changes as the value of an independent variable is varied.
- Simple linear regression involves one independent variable, while multiple regression can include any number of independent variables. Regression analysis outputs include coefficients, residuals, and measures of fit like the R-squared value.
- An example uses home size and price data from 10 houses to generate a linear regression equation predicting that price increases by around $110 for each additional square foot. This model explains 58% of the variation in home prices.
Covariance is a measure of how two random variables change together, taking any value from -∞ to +∞. Covariance can be affected by changing the units of the variables. Correlation is a scaled version of covariance that indicates the strength of the relationship between two variables on a scale of -1 to 1. Unlike covariance, correlation is not affected by changes in the location or scale of the variables and provides a standardized measure of their relationship. Correlation is therefore preferred over covariance as a measure of the relationship between two variables.
This document discusses the chi-square test of independence and how it can be used to determine if two variables are independent of each other. It provides an example using a contingency table to analyze the relationship between gender and voter turnout. The expected values for each cell are calculated based on the marginal totals. The chi-square statistic is then used to determine if the differences between observed and expected values are statistically significant, which would indicate the variables are dependent rather than independent.
The document discusses two types of educational research: descriptive research and survey research. Descriptive research aims to describe characteristics of a population or phenomenon and focuses on "what" rather than "why". Survey research involves collecting data through surveys or questionnaires. Key points covered include characteristics and methods of descriptive research such as observational studies and case studies; examples of descriptive research topics; advantages and disadvantages. Survey research types like cross-sectional and longitudinal surveys are defined, as are their purposes, uses and steps in conducting survey research.
This document provides an overview of data analysis and statistics concepts for a training session. It begins with an agenda outlining topics like descriptive statistics, inferential statistics, and independent vs dependent samples. Descriptive statistics concepts covered include measures of central tendency (mean, median, mode), measures of variability (range, standard deviation), and charts. Inferential statistics discusses estimating population parameters, hypothesis testing, and statistical tests like t-tests, ANOVA, and chi-squared. The document provides examples and online simulation tools. It concludes with some practical tips for data analysis like checking for errors, reviewing findings early, and consulting a statistician on analysis plans.
Automated Quantitative Measures of Forelimb Function in Rats and MiceInsideScientific
During this webinar Drew Sloan, PhD and Seth Hays, PhD discuss automated forelimb tasks for both rats and mice and applications of the quantitative data collected.
These new procedures are advancing discovery in basic neuroscience and offering deeper understanding of motor control and developing therapies for disease models such as traumatic brain injury, spinal cord injury, and Parkinson’s disease.
Dr. Drew Sloan demonstrates typical training and testing protocols for using the Vulintus MotoTrak behavioral system, including Isometric pull, supination and lever press tasks.
Following, Dr. Seth Hays shares his research which has used MotoTrak to investigate neuroplasticity-enhancing therapies for motor dysfunction, specifically looking at vagus nerve stimulation (VNS) as a method to promote plasticity.
The document provides a review of literature on motor control assessment. It discusses various aspects of motor control assessment including history taking, functional activity assessment, body structure and function assessment, outcome measures, and evaluation of specific areas like stability, mobility, strength, range of motion, and functional activity status. It also summarizes various studies that have evaluated methods and tools for motor control assessment like use of dynamometers, goniometers, and activity monitors.
The document provides an overview of a presentation on returning runners to training. It discusses current trends in running injuries, different components of running form, and methods for manipulating step rate and gait. It also reviews the history of coaching approaches and different types of runs. The presenter is a physical therapist and certified running coach who owns his own business providing running coaching.
Training load and injuries in football- lessons from research and practiseTorstein Dalen-Lorentsen
This document summarizes research on training load management in football. It discusses how monitoring training load and analyzing the data can inform decision making to find the optimal load for each player. While acute:chronic workload ratios are often used, the evidence for their ability to prevent injuries is limited due to poor study quality and lack of randomized controlled trials. Training load must be considered together with other individual factors, and load management aims to balance training and recovery rather than precisely predict or prevent health problems.
Functional assessment measures an individual's ability to perform tasks over time. It is important in physiotherapy to develop treatment plans. Current measures include impairment tests of body parts, self-report measures of pain and function, and physical performance measures integrating multiple abilities. Physical performance measures are increasingly used and compare to impairment tests which measure isolated components. Future directions include investigating combinations of assessments to best predict function and injury, and considering psychological and social factors. Research with long-term studies is still needed.
Pre-Operative and Post-Operative Assessments.pptICDDelhi
Dr. Mansoor Alam is a child developmental specialist from ICD, New Delhi. He is a medicine graduate with specialization in Developmental Disability Management. After his graduation, he joined Spastic Society of Northern India, New Delhi to have a Post-Graduation Diploma in Developmental Therapy under RCI. Later, he went to Bobath Centre in London, (United Kingdom) to have specialized training in Bobath Approach to the treatment of Children with Cerebral Palsy, which is popularly known as Neurodevelopment Treatment (NDT). While, he was in Sydney, Australia, he did an advance course on the Use of Botox in Spasticity Management. He is one of the few professionals in India who attended Gait Analysis Course in Australia. To have in-depth knowledge to work with children neurodevelopmental disabilities, he pursued specialized training programs on GMA (General Movements Assessment), Constrained Induced Manual Therapy (CIMT), Early Intervention, Sensory Integration Therapy, Clinical Pathology and Acupuncture.
He has been considered as one of the first combination therapists in India who bridged the gap between medical and rehabilitation science. He has supported more than 200 organizations technically to work scientifically with children with developmental disabilities. He has mentored more than 3000 professionals to work and lead in the field of Childhood Disability. He has conducted more than 50 workshops and conferences in India and abroad. He has presented his works in England, Australia and Pakistan. More than 4000 articles in different Journals / Websites / Books / Research Papers have mentioned his work and his website (www.icddelhi.org)
He can be contacted at:
Institute for Child Development, C-27, Malviya Nagar, New Delhi-110017
Landline No: 011-41012124, Mobile No: +91-7838809241
Mail: helpicd@gmail.com, Website: www.icddelhi.org
The document discusses principles of manual muscle testing (MMT). It describes how MMT is used to measure muscle strength by applying external loads and gravity. There are different grading scales for MMT, including the Medical Research Council scale and Daniels and Worthingham scale. Proper positioning, stabilization, and application of resistance are important for standardized MMT. Factors like joint position, type of muscle contraction, and distance of applied force can influence strength measurements.
This document discusses the importance of data quality assurance in gait analysis. It emphasizes that gait analysis requires both scientific understanding and practical skills. Staff must receive training in measurement techniques, and centers should implement quality assurance measures like repeatability studies to evaluate measurement error. Vigilance is also important to check for errors in the data during and after analysis. Ensuring accurate, consistent data collection performed by competent practitioners is vital for gait analysis to provide useful clinical information.
This is Dr. Mike Young's presentation from the 2016 Child to Champion Conference on Velocity Based Training. In this lecture, Dr. Young presented the drawbacks of traditional mass-based loading and discussed the potential benefits of using velocity based metrics such as average and peak velocity and power in the training of athletes. Mike also provides insight in to successful use of sport technology to increase compliance and usability.
Strength is the amount of force a muscle can exert against an external load, while power combines strength and speed of movement. Power is assessed manually through tests of muscle function and strength or instrumentally using devices like dynamometers. Manual muscle testing grades strength on a scale from 0 to 5 based on the ability to overcome gravity and resist pressure. Various instruments can also objectively measure strength of individual muscles or muscle groups. One-repetition maximum testing determines the maximum weight that can be lifted for a single repetition to assess overall muscular strength.
Hip Muscle Strength Predicts Non-contact ACL Injury in Male and Female Athlet...Rachel Straub
Background: Prospective studies have reported that abnormal movement patterns at the trunk, hip, and knee are associated with non-contact ACL injuries. Impaired hip strength may underlie these abnormal movement patterns, suggesting that diminished hip strength may increase the risk of non-contact ACL injury.
Purpose: To determine if baseline hip strength predicts future non-contact ACL injury in athletes.
Study Design: Prospective cohort study.
Methods: Prior to the start of the competitive season, isometric hip strength (external rotator and abductor) was measured bilaterally using a hand-held dynamometer in 501 competitive athletes (138 females and 363 males) participating in various sports. During the sport seasons, ACL injury status was recorded, and injured athletes were further classified based on the mechanism of injury (non-contact vs. contact). Postseason, logistic regression was used to determine whether baseline hip strength predicted future non-contact ACL injury. Receiver operating characteristic (ROC) curves were constructed independently for each strength measure to determine the clinical cut-off value to distinguish between a high-risk and low-risk outcome.
Results: A total of 15 non-contact ACL injuries were confirmed (6 female, 9 male), for an overall annual incidence of 3.0% (2.5% for males and 4.3% for females). Baseline hip strength measures (external rotator and abductor) were significantly lower in injured athletes compared to non-injured athletes (p = 0.003 and p < 0.001, respectively). Separate logistic regression models indicated impaired hip strength increased future injury risk [external rotator: OR = 1.23 (95% CI: 1.08, 1.39), p = 0.001; abductor: OR = 1.12 (95% CI: 1.05, 1.20), p = 0.001]. Clinical cutoffs to define high risk were established as external rotator strength ≤ 20.3% body weight (BW) or abductor strength ≤ 35.4% BW.
Conclusion: Measures of preseason isometric hip abductor and external rotator strength independently predicted future non-contact ACL injury status in competitive athletes. Our data suggest that screening procedures to assess ACL injury risk should include an assessment of isometric hip abductor and/or external rotator strength.
Ratio indicies in football injury and performance prediction researchGregAtki
Some suggested explorations on ratio indicies that might be used as exposures for prediction of injury and performance outcomes in football (Soccer) research
The document provides guidelines for physiotherapists on how to properly perform manual muscle testing of the upper and lower extremities, including defining different muscle grades, techniques for administering tests, basic principles like taking time, providing clear instructions to patients, and ensuring consistency. The goal is to objectively evaluate muscle strength to inform treatment planning and monitor patient progress.
This study aimed to determine the intrarater reliability of manual muscle testing (MMT) and hand-held dynametric muscle testing (DMT) by having a physical therapist perform both types of tests on the same muscle groups for 11 patients on two separate occasions. The results found high correlation coefficients between tests for most muscle groups with both MMT and DMT, indicating that both methods demonstrate reliability under the conditions of this study. However, some limitations exist for each testing method.
Pulse Wave Velocity: Theory, Applications, Methods, and Future DirectionsInsideScientific
Lee Stoner, PhD and Gabriel Zieff, MA present a complete, in-depth overview of their research involving Pulse Wave Velocity (PWV) in a variety of different applications and a deep dive into the methods they use to record high-quality, repeatable data.
Arguably, the “gold-standard” method for noninvasive assessment of cardiovascular disease risk is pulse wave velocity. The PWV is widely used in both epidemiological and physiological studies to assess arterial stiffness, a construct dependent on the functional and structural characteristics of a vessel. PWV is calculated by measuring the transit time of the arterial waveform between two points of a measured distance. The most widely studied path is between the carotid and femoral arteries, which represents the aorto-illiac pathway. Traditionally, these measurements are made using tonometers, which are highly sensitive pressure transducers. However, alternative approaches to tonometry are available, and pathways other than the aorta can be measured. These alternative approaches may be better suited for use with certain populations or study designs. The focus of the presentation is to assist the audience in identifying the correct research tool for their particular research paradigm. Specifically, these experts outline the theoretical principles underlying PWV, as well as the importance of this measure to both epidemiological and physiological studies. Subsequently, they highlight some of the different approaches for measuring PWV, including technical considerations. This is followed by discussion pertaining to the identification of the appropriate PWV measure for the specific study design and populations of interest. This includes consideration of internal and external validity. They end the session by providing some tips to facilitate high-quality PWV assessments.
Key Topics Include:
- Meaning and clinical importance of pulse wave velocity
- How to measure and interpret pulse wave velocity
- Considerations for internal- and external-validity
- Considerations for the measurement of pulse wave velocity of various study designs and populations
Biomechanics- Basic fundamentals and principles.pptxAfaf Mohammed
Introduction
Physical principles
Terminologies
Tooth movement
M/F
Newton's laws
Characteristics of force
Equivalent force system
Equilibrium principle
Statically determinate vs. Indeterminate systems
One couple
Two couple
Conclusion
Bibliography
The objective of this in-service presentation was to provided inpatient physical therapists and occupational therapists with the clinical decision making skills to properly evaluate common orthopedic dysfunctions encountered in the acute care setting.
Similar to Regression Analysis Research Presentation (20)
Travel vaccination in Manchester offers comprehensive immunization services for individuals planning international trips. Expert healthcare providers administer vaccines tailored to your destination, ensuring you stay protected against various diseases. Conveniently located clinics and flexible appointment options make it easy to get the necessary shots before your journey. Stay healthy and travel with confidence by getting vaccinated in Manchester. Visit us: www.nxhealthcare.co.uk
NAVIGATING THE HORIZONS OF TIME LAPSE EMBRYO MONITORING.pdfRahul Sen
Time-lapse embryo monitoring is an advanced imaging technique used in IVF to continuously observe embryo development. It captures high-resolution images at regular intervals, allowing embryologists to select the most viable embryos for transfer based on detailed growth patterns. This technology enhances embryo selection, potentially increasing pregnancy success rates.
Summer is a time for fun in the sun, but the heat and humidity can also wreak havoc on your skin. From itchy rashes to unwanted pigmentation, several skin conditions become more prevalent during these warmer months.
5-hydroxytryptamine or 5-HT or Serotonin is a neurotransmitter that serves a range of roles in the human body. It is sometimes referred to as the happy chemical since it promotes overall well-being and happiness.
It is mostly found in the brain, intestines, and blood platelets.
5-HT is utilised to transport messages between nerve cells, is known to be involved in smooth muscle contraction, and adds to overall well-being and pleasure, among other benefits. 5-HT regulates the body's sleep-wake cycles and internal clock by acting as a precursor to melatonin.
It is hypothesised to regulate hunger, emotions, motor, cognitive, and autonomic processes.
Are you looking for a long-lasting solution to your missing tooth?
Dental implants are the most common type of method for replacing the missing tooth. Unlike dentures or bridges, implants are surgically placed in the jawbone. In layman’s terms, a dental implant is similar to the natural root of the tooth. It offers a stable foundation for the artificial tooth giving it the look, feel, and function similar to the natural tooth.
Discover the benefits of homeopathic medicine for irregular periods with our guide on 5 common remedies. Learn how these natural treatments can help regulate menstrual cycles and improve overall menstrual health.
Visit Us: https://drdeepikashomeopathy.com/service/irregular-periods-treatment/
How to Control Your Asthma Tips by gokuldas hospital.Gokuldas Hospital
Respiratory issues like asthma are the most sensitive issue that is affecting millions worldwide. It hampers the daily activities leaving the body tired and breathless.
The key to a good grip on asthma is proper knowledge and management strategies. Understanding the patient-specific symptoms and carving out an effective treatment likewise is the best way to keep asthma under control.
Breast cancer: Post menopausal endocrine therapyDr. Sumit KUMAR
Breast cancer in postmenopausal women with hormone receptor-positive (HR+) status is a common and complex condition that necessitates a multifaceted approach to management. HR+ breast cancer means that the cancer cells grow in response to hormones such as estrogen and progesterone. This subtype is prevalent among postmenopausal women and typically exhibits a more indolent course compared to other forms of breast cancer, which allows for a variety of treatment options.
Diagnosis and Staging
The diagnosis of HR+ breast cancer begins with clinical evaluation, imaging, and biopsy. Imaging modalities such as mammography, ultrasound, and MRI help in assessing the extent of the disease. Histopathological examination and immunohistochemical staining of the biopsy sample confirm the diagnosis and hormone receptor status by identifying the presence of estrogen receptors (ER) and progesterone receptors (PR) on the tumor cells.
Staging involves determining the size of the tumor (T), the involvement of regional lymph nodes (N), and the presence of distant metastasis (M). The American Joint Committee on Cancer (AJCC) staging system is commonly used. Accurate staging is critical as it guides treatment decisions.
Treatment Options
Endocrine Therapy
Endocrine therapy is the cornerstone of treatment for HR+ breast cancer in postmenopausal women. The primary goal is to reduce the levels of estrogen or block its effects on cancer cells. Commonly used agents include:
Selective Estrogen Receptor Modulators (SERMs): Tamoxifen is a SERM that binds to estrogen receptors, blocking estrogen from stimulating breast cancer cells. It is effective but may have side effects such as increased risk of endometrial cancer and thromboembolic events.
Aromatase Inhibitors (AIs): These drugs, including anastrozole, letrozole, and exemestane, lower estrogen levels by inhibiting the aromatase enzyme, which converts androgens to estrogen in peripheral tissues. AIs are generally preferred in postmenopausal women due to their efficacy and safety profile compared to tamoxifen.
Selective Estrogen Receptor Downregulators (SERDs): Fulvestrant is a SERD that degrades estrogen receptors and is used in cases where resistance to other endocrine therapies develops.
Combination Therapies
Combining endocrine therapy with other treatments enhances efficacy. Examples include:
Endocrine Therapy with CDK4/6 Inhibitors: Palbociclib, ribociclib, and abemaciclib are CDK4/6 inhibitors that, when combined with endocrine therapy, significantly improve progression-free survival in advanced HR+ breast cancer.
Endocrine Therapy with mTOR Inhibitors: Everolimus, an mTOR inhibitor, can be added to endocrine therapy for patients who have developed resistance to aromatase inhibitors.
Chemotherapy
Chemotherapy is generally reserved for patients with high-risk features, such as large tumor size, high-grade histology, or extensive lymph node involvement. Regimens often include anthracyclines and taxanes.
STUDIES IN SUPPORT OF SPECIAL POPULATIONS: GERIATRICS E7shruti jagirdar
Unit 4: MRA 103T Regulatory affairs
This guideline is directed principally toward new Molecular Entities that are
likely to have significant use in the elderly, either because the disease intended
to be treated is characteristically a disease of aging ( e.g., Alzheimer's disease) or
because the population to be treated is known to include substantial numbers of
geriatric patients (e.g., hypertension).
3. Objectives
1. Discuss relevant concepts relating to Regression Analyses
2. Understand the methods of the study
3. Adequately interpret study results
4. Understand the findings of the study
5. Understand the clinical implications of the findings
6. Apply concepts through completion of a quiz!
4. Regression - What is It?
❖ Predictive modeling technique between variables
➢ Is the value of the dependent variable affected by the
independent variable?
❖ Line of Best Fit: y=ax+b → good predictor for future data points
❖ Correlation does not imply causation!
5. Main Regression Analysis Techniques:
Linear vs. Logistic
❖ Forms of Predictive Analysis:
➢ Linear
➢ Logistic
❖ When do you use Linear vs. Logistic?
➢ Depends on the type of variables you have
6. Linear Regression
❖ Used when…
➢ Dependent variable is continuous
➢ Independent variable may be continuous or discrete
❖ Based upon the type of dependent variable
7. Logistic Regression
❖ Used when…
➢ Dependent variable is dichotomous
➢ Independent variable may be continuous or discrete
❖ Based upon the type of dependent variable
8. Other Types of Regression Analysis Techniques
❖ Simple Regression
❖ Multiple Regression
❖ Multivariate Regression
9. Regression Analysis Techniques:
Simple Regression
❖ Used when…
➢ 1 independent variable and 1 dependent variable
❖ Can be linear or logistic
❖ Based upon the number of independent and type of dependent
variables
10. Regression Analysis Techniques:
Multiple Regression
❖ Used when…
➢ 2 or more independent variables and 1 dependent variable
❖ Can be linear or logistic
❖ Based upon the number of independent and type of dependent
variables
11. Regression Analysis Techniques:
Multivariate Regression
❖ Used when…
➢ 1 independent variable and 2 or more dependent variables
❖ Can be linear or logistic
❖ Based upon the number and type of dependent variables
12. R2 = Coefficient of Determination
❖ Measure of how closely data falls on the line of best fit
❖ Always between 0 and 1.0 (0-100%)
➢ The higher the number = the better the predictive equation explains your
data’s variance
❖ However… a low R2 is not always bad, and a high R2 is not always
good!
http://blog.minitab.com/blog/adventures-in-statistics-2/regression-analysis-how-do-i-interpret-r-squared-and-assess-the-goodness-of-fit
13. R2 Example
❖ Strength vs ER ROM
❖ Appears that strength is a
much better predictor of
pitch speed than ER ROM
So, if a pitcher has a lot of
strength, but is lacking ER ROM,
would you draft him?
14. Regression Example: What Kind Is It?
Independent: Strength of external rotator muscles
Dependent: Pitch speed
Question: How well does strength of external rotator
muscles predict pitch speed?
15. Regression Example: What Kind Is It?
Independent: Strength of external rotator muscles
Dependent: Any change in pitch speed
Question: Does strength of the external rotators predict a
change in pitch speed (yes or no)?
16. Regression Example: What Kind Is It?
Independent: Strength of external rotators AND ROM of external rotators
Dependent: Pitch speed
Question: How well do strength and range of motion of external rotators
predict pitch speed?
17. Regression Example: What Kind Is It?
Independent: Strength of external rotators AND ROM of external rotators
Dependent: Any change in pitch speed
Question: Do strength and range of motion of external rotators predict a
change in pitch speed (yes or no)?
18. Regression Example: What Kind Is It?
Independent: Strength of external rotator muscles
Dependent: Pitch speed AND pitch accuracy
Question: How well does strength of external rotators predict pitch speed
and pitch accuracy?
19. Regression Example: What Kind Is It?
Independent: Strength of external rotator muscles
Dependent: Change in pitch speed AND change in accuracy
Question: Does strength of the external rotators predict a change in both
pitch speed and accuracy (yes or no)?
21. Clinical Question
Does the number of single-leg heel raises predict plantar
flexion strength measured by a hand-held dynamometer?
=
22. Hypothesis
Null: Number of heel raises will fail to predict with reasonable accuracy
hand-held dynamometry results for ankle plantar flexor strength.
Alternative: Number of heel-raises will predict with reasonable accuracy
hand-held dynamometry results for ankle plantarflexor strength.
23. Participants
❖ 37 healthy student PTs from GWU DPT Program
❖ Exclusion Criteria: any history of...
➢ Cardiovascular disease
➢ DM
➢ Renal disease
➢ Neurological problems
➢ Injury of selected LE within past 2 wks
➢ Surgical history in selected LE
➢ Cancer
➢ < 20 y/o or > 45 y/o
24. Procedure
❖ 8 total investigators
❖ Method creation for data collection
❖ Performance of data collection
➢ Groups of 4 taken to testing room
➢ Randomized → start at heel raise station OR dynamometry station
➢ Self-selected testing leg
❖ Analysis of collected data to determine linear regression of variables
❖ Determination of clinical relevance of results
25. Dynamometry
❖ One rater recording intake data
❖ One rater performing dynamometry testing
➢ Microfet2 by Hoggan
➢ Pt in supine, shoes off, ball of foot against dynamometer
➢ Dynamometer held against wall
➢ No HHA allowed
➢ 3 trials → recorded best of 3
➢ Participants blinded to results
26. Heel Raises
❖ Two separate MMT stations
➢ One rater & one recorder per station
➢ Pt performed single-leg heel raises to failure on
selected leg with shoes off
➢ Allowed 2 fingers on chair for balance
27. Data Analysis
❖ We decided simple linear regression was appropriate for the data we
collected and for answering our clinical question
Independent variable: heel raises (discrete)
Dependent variable: dynamometer (continuous)
❖ 1 discrete independent variable and 1 continuous dependent
variable = simple linear regression
32. Discussion: Heel Raises vs Dynamometer
❖ Plantar flexion MMT is not a great indicator of dynamometer strength
readings
❖ There was a better relationship between the two when dynamometer was
followed by heel raises
➢ MMT for plantar flexion is generally considered more of an endurance
test than a strength test
➢ Doing MMT first could have fatigued the muscles, thus lowering
dynamometer readings
34. MMT first? Dynamometer first?
Heel Raises before Dynamometer = 67.1 lbs avg. dynamometer score
Dynamometer before Heel Raises = 70.5 lbs avg.
❖ Those who performed the dynamometer
before the heel raises had higher scores
➢ Why?
35. Clinical Implications
❖ Deciding between the use of MMT or the use of dynamometer
could depend upon why you are testing the plantar flexors
➢ If you are looking to test pure strength of plantar flexors,
dynamometer may be best
➢ If you are looking to test endurance of plantar flexors, MMT
may be best
❖ Plantar flexors are important for walking, running, and other
endurance activities so testing them with MMT may be more
clinically and functionally relevant than using dynamometer
36. Limitations of Study
❖ Limited sample size
❖ Homogenous sample
❖ Sliding on the table during dynamometer reading
❖ Knee position: flexed or extended during MMT
❖ PT and patient positioning variability
❖ If patient had recently exercised and was already
fatigued
37. Summary
Regression is a predictive modeling technique between variables
- Different types of regression used based on types of variables
Heel raise count and ankle plantarflexion dynamometry are both reliable
measures of PF strength (required for everyday activities)
But the number of single leg heel raises performed is not a strong
predictor of hand-held dynamometry score for healthy PT students
Heel raises more for endurance vs. Dynamometry score more for strength
38. References
1. Harris-Love, MO., Shrader, JA., Davenport, TE., Joe, G., Rakocevic, G., McElroy, B., Dalakas M. Are
repeated single-limb heel raises and manual muscle testing associated with peak plantar-flexor force in
people with inclusion body myositis? Phys Ther. 2014; 94(4): 543-552.
2. Marmon, A., Pozzi, F., Alnahdi, A., Zeni, J. The validity of plantarflexor strength measures obtained
through hand-held dynamometry measurements of force. International Journal of Sports Physical
Therapy. 2013;8(6): 820-827.
3. Mattacola, C., Downar, S. Isometric muscle-force measurements obtained by handheld dynamometry.
Athletic Therapy Today. 2003;8(4): 38-40.
4. Mentiplay, B., Perraton, L., Bower, K., Adair, B., Pua, Y., Williams, G., McGaw, R., Clark, R.
Assessment of lower limb muscle strength and power using hand-held and fixed dynamometry: A
reliability and validity study. PLoS ONE. 2015; 10(10): 1-18.
5. Stark, T., Walker, B., Phillips, JK., Fejer, R., Beck, R. Hand-held dynamometry correlation with the
gold standard isokinetic dynamometry: A systematic review. American Academy of Physical Medicine
and Rehabilitation. 2011;3: 472-479.
6. Hislop H, Avers D, Brown M. Testing the muscles of the lower extremity. In: Hislop H, Avers D,
Brown M. 9th ed. Saint Louis, MO: Elsevier Saunders. 2014.
Editor's Notes
Does the number of heel raises predict the strength when measured by dynamometer?
Polynomial, step-wise, ridge, lasso, elsticnet: TONS of regression techniques we can utilize
http://www.restore.ac.uk/srme/www/fac/soc/wie/research-new/srme/modules/mod4/quizb/Logistic_versus_linear.jpg
Continuous: infinite amount of possibilities (e.g. dynamometer because you can have 50.75lbs)
Discrete: finite number (e.g. heel raises because you can’t have 20.32 heel raises)
Continuous: infinite amount of possibilities (e.g. dynamometer because you can have 50.75lbs)
Discrete: finite number (e.g. heel raises because you can’t have 20.32 heel raises)
Dichotomous: yes or no
Correlation: just shows a linear relationship. As one value goes up, so does the second value, but you can’t use that to predict other values.
Regression: uses a line of best fit to predict that linear relationship. The line gives an equation of best fit that we can then use to predict future values of this relationship.
Left: 38.7%
Right: 87.4%
Regression model on right accounts for 87.4% of variance in data, while left is only 38.7
THe higher the number, the more variance in the data is explained by the line of best fit
Shows a stronger relationship between dependent and independent variable
If R2 = 1.0, then the equation line would explain all variance.All of the points would fit onto the line of best fit and equation would predict all future data points.
However, not all good/bad… Some predictors will usually give low predictive quality, such as human behavior, but still be statistically significant.
Higher results could indicate too much bias and actually not be a good representation of the population
R2 for strength and pitch speed linear regression is .98, meaning that 98% of the variance in the data is explained by strength and suggesting that the equation will be a good predictor for future pitchers’ speed
However, this could indicate bias → are there other variables influencing the results that were not accounted for? Have to
R2 for ROM and pitch speed is pretty low, indicating there is not a good predictive relationship between ROM and pitch speed and that there are probably many other variables that are influencing the pitch speed.
Now, how many of you are feeling some regression aggression and are as confused as we were? Jessica is going to try to help make things a little less confusing with some examples.
Simple Linear Regression
1 Independent variable, dependent variable is continuous
Application: for a recruitment tool for baseball teams
Simple Logistic Regression -
the dependent variable is dichotomous (yes or no, it either does or it doesn’t)
1 independent variable
Multiple Linear Regression - because there are now two independent variables and the dependent variable is continuous
Multiple Logistic Regression - because there are now TWO independent variables and the dependent variable is dichotomous
Multivariate Linear Regression - because there are now two dependent variables that are continuous
Multivariate Logistic Regression - 1 independent and 2 dependent variables
Diana
Discuss Independent vs dependent
Independent is heel raises
Dependent is dynamometer
Questionnaire was provided to ensure the participants met inclusion/exclusion criteria prior to the study
KG
Independent: Heel raises (discrete)
Dependent: Dynamometer (continuous)
The type of data we have indicates the need for linear regression
Because there is 1 dependent variable it is also considered univariate
Rachael
R2 is 0.1607 which is pretty low for a whole class prediction, when determining if heel raises can predict dynamometer strength.
Higher the r2 the better the linear regression line explains your data (more predictive relationship between dependent and independent variable)
84% other extraneous variables affecting our data
R is 0.4659 which is not great, but it is okay - This group started with Dynamometer station first and moved to MMT station second.
Orange dots are the data points that fit onto the regression line
Blue are data points that do not fit onto the regression line
R squared is 0.1273 which is not very good. This group started with heel raises first and moved to dynamometer second. This could suggest that other variables, such as fatigue, were influencing the data prediction equation.
Rachael
Ask the class WHY? Likely was fatigued after the heel raises
Our results do not suggest that either test is “bad”, per se, it just suggests that these two tests are not great predictors of each other in our test setting.
However, we will probably still want to use both types of measurement in the clinic depending on what we are testing. If you want to test strength, probably the dynamometer is the best choice, while the heel raise MMT is a better choice for endurance of the plantar flexor muscles.
There are potentially still clinicians who do not understand this though. For example, a patient comes in and is complaining that they are fatiguing after climbing stairs to their apartment on the 15th floor of a building, and the PT uses a dynamometer once to test their PF strength. This reading suggests above average PF strength, so the PT ignores the fatigue factor of the gastroc. Ideally, the PT should have used a heel raise test because that tests endurance which is what is needed to climb that many stairs, whereas the dynamometer only tested the one rep max strength of the muscle.
Homogenous sample may not transfer to other populations