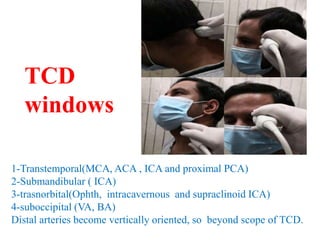
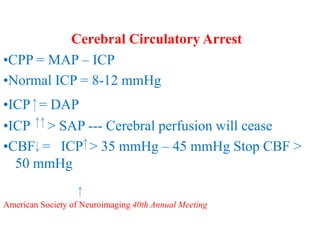
Trans-Cranial Doppler (TCD) is a non-invasive ultrasound technique used to evaluate cerebral blood flow velocities. There are two main types of TCD devices - non-duplex devices which identify arteries "blindly" based on Doppler shift and duplex devices which combine Doppler with B-mode imaging to directly visualize arteries. TCD allows evaluation of intracranial steno-occlusive disease, vasospasm, aneurysms, and other conditions. It can detect elevated velocities indicative of stenosis but has limitations including operator dependence and inability to image distal arteries. TCD is useful for monitoring conditions like sickle cell disease where elevated velocities increase stroke risk.

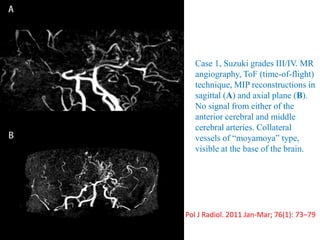
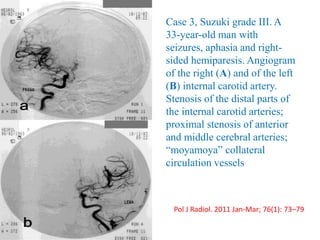
![MEAN FLOW VELOCITY
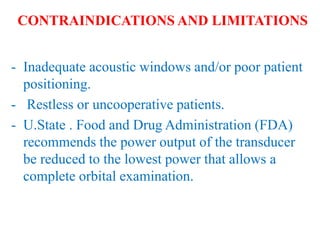
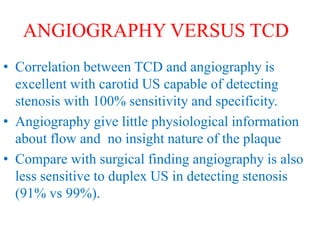
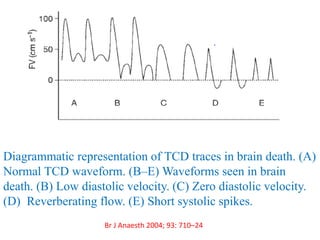
Mean flow velocity (MFV) is a central parameter in
TCD and is equal to [PSV + (EDV x 2)]/3.
When MFV is increased, it may indicate stenosis,
vasospasm, or hyper dynamic flow.
A decreased value may indicate hypotension, decreased
CBF, ICP, or brain stem death.
Focal arterial stenosis or vasospasm is represented by an
increased MFV within a 5–10 mm segment, usually
by 30 cm/s compared with the asymptomatic side.](https://image.slidesharecdn.com/tcd-200703193926/85/TRANS-CRANIAL-DOPPLER-23-320.jpg)

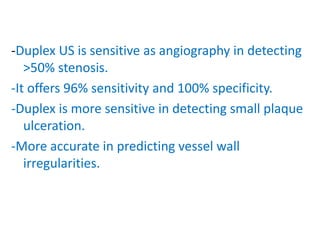

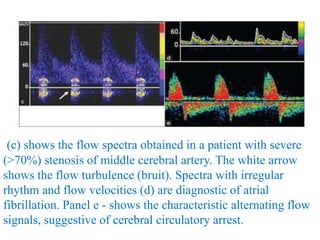


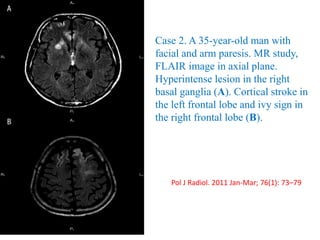


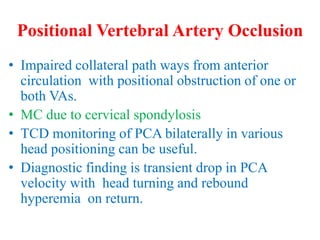

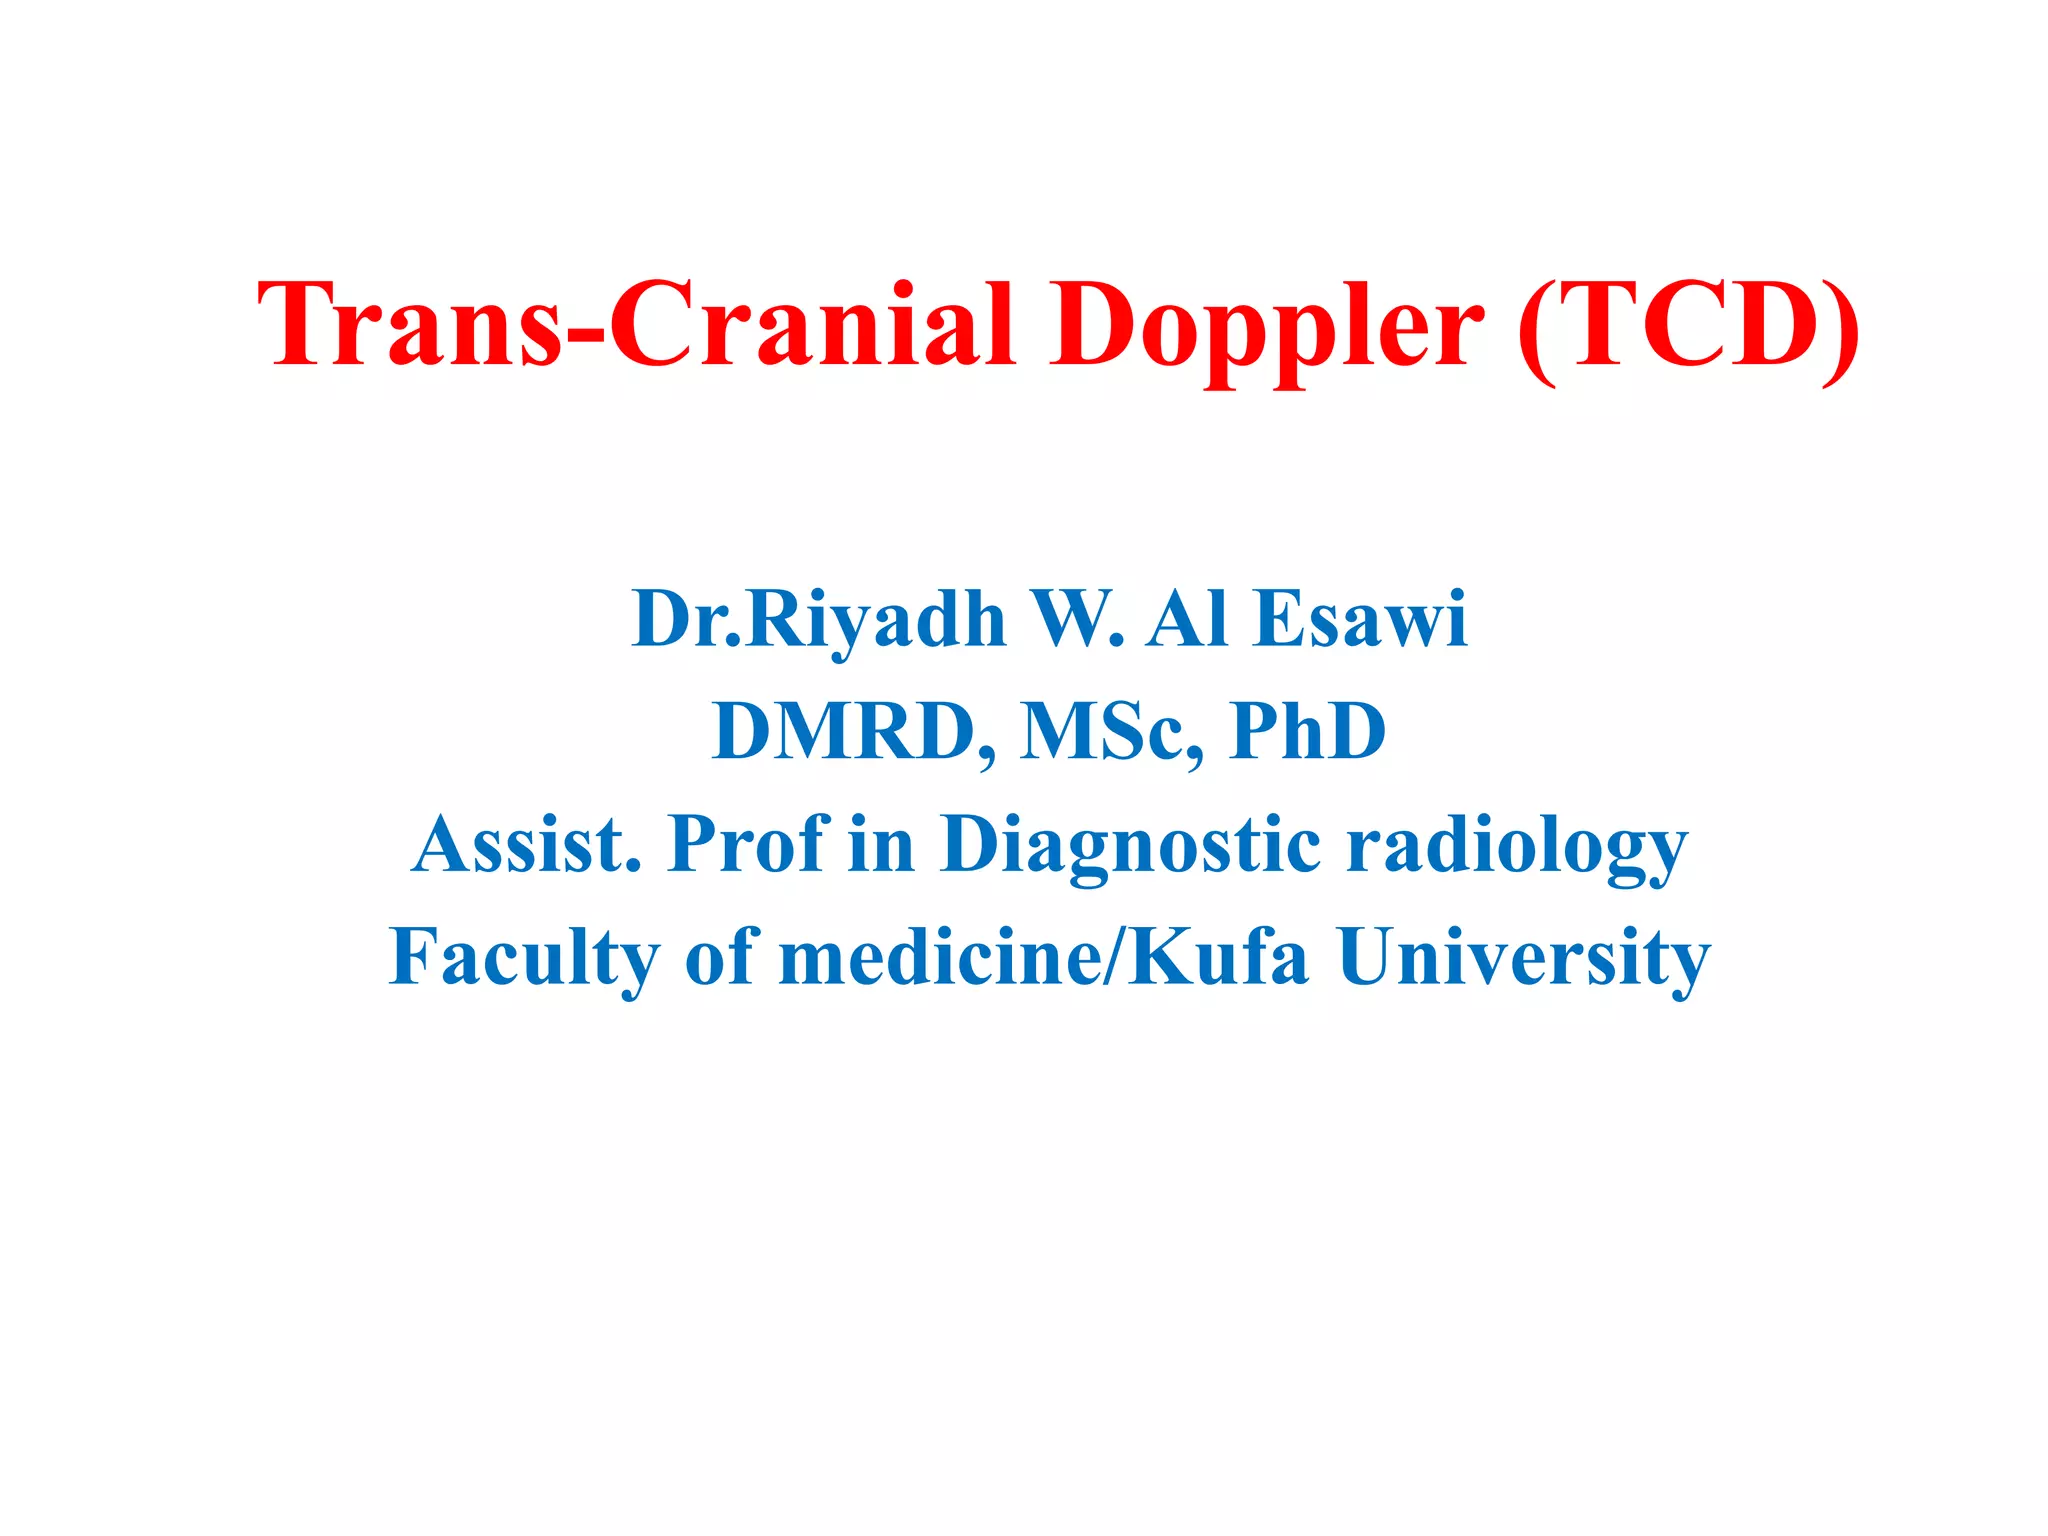
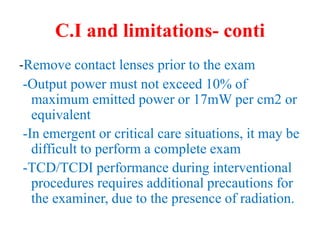
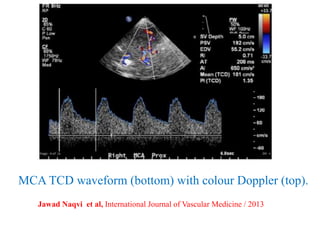
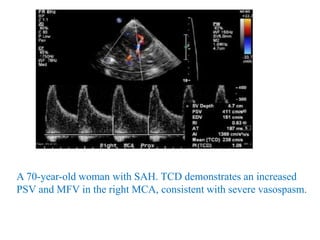
![Transcranial Doppler demonstrates pulsatile flow in the right-middle cerebral artery in a 40-
year-old patient following subarachnoid hemorrhage and vasospasm. At a depth of 58 mm
(near the origin of the middle cerebral artery [MCA]), a markedly elevated peak systolic
flow velocity of approximately 251 cm/s and a mean velocity of approximately 164 cm/s
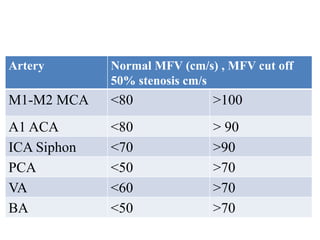
indicates severe MCA stenosis. Normal peak and mean MCA flow velocities are
approximately 100 cm/s and 50 cm/s, respectively.](https://image.slidesharecdn.com/tcd-200703193926/85/TRANS-CRANIAL-DOPPLER-49-320.jpg)
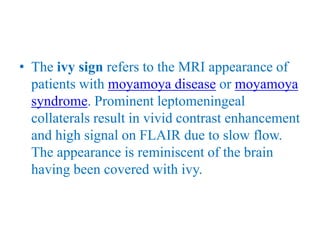
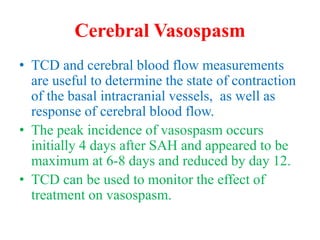
![approximately 25% of SAH patients developing delayed ischemic
deficits due to vasospasm.
TCD identifies MCA and BA vasospasm with a high sensitivity and
specificity [39]. A systematic review of 26 studies comparing TCD
with angiography found that MCA MFV >120 cm/s was 99%
specific and 67% sensitive to angiographic vasospasm of ≥25%
[64]. In a retrospective study of 101 patients, MCA MFV
>120 cm/s was 72% specific and 88% sensitive for ≥33%
angiographic vasospasm with a negative predictive value (NPV) of
94% for MFV <120 cm/s [65]. In the same study, MFV >200 cm/s
was 98% specific and 27% sensitive with a positive predictive
value (PPV) of 87% for angiographic vasospasm of ≥33% [65].
Therefore, MFV <120 cm/s and >200 cm/s may accurately predict
absence and presence of angiographic MCA, vasospasm,
respectively](https://image.slidesharecdn.com/tcd-200703193926/85/TRANS-CRANIAL-DOPPLER-51-320.jpg)


![Mechanical thrombectomy in acute stroke [Autosaved].pptx](https://cdn.slidesharecdn.com/ss_thumbnails/mechanicalthrombectomyinacutestrokeautosaved-230102142009-fe15766f-thumbnail.jpg?width=640&height=640&fit=bounds)


![PERI-PROSTHETIC FRACTURE NAIL-PLATE CONSTRUCT [NPC].pptx](https://cdn.slidesharecdn.com/ss_thumbnails/drarunkumardrmohamedashrafperiprostheticfrasturenail-plateconstructnpc-260209164459-7e9d15a1-thumbnail.jpg?width=640&height=640&fit=bounds)


