Downloaded 396 times


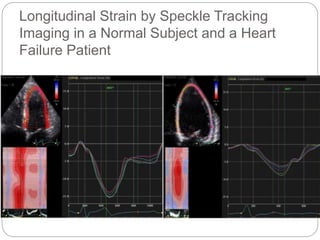


This document discusses strain and strain rate imaging techniques used to quantify regional myocardial function. It describes various methods to measure strain, including tissue Doppler, 2D speckle tracking, and cardiac MRI. It outlines normal values and patterns of strain in healthy individuals and how strain is altered in various cardiac diseases, such as coronary artery disease, heart failure, cardiomyopathies, and congenital heart disease. Strain imaging can identify myocardial scar, viability, dysfunction, and response to treatments.


