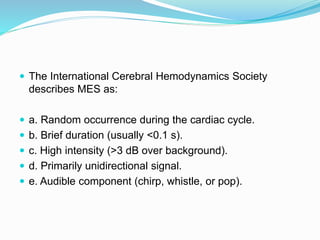
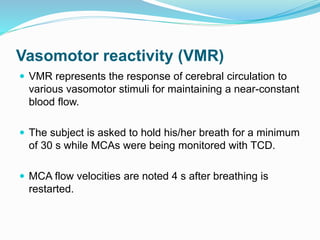
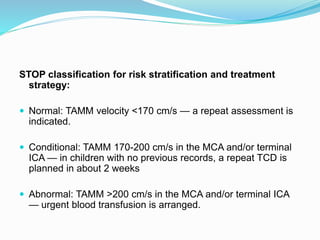
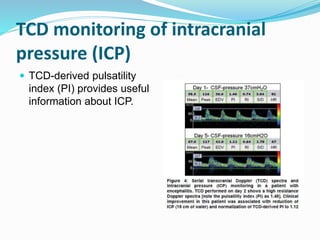
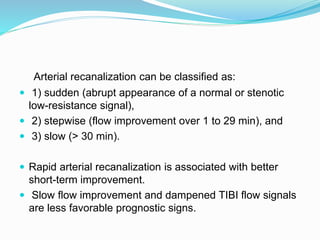
Trans-cranial Doppler (TCD) ultrasonography is used to evaluate blood flow velocities in the basal intracerebral arteries. It was introduced in 1982 and has since been used for applications like detecting vasospasm after subarachnoid hemorrhage, monitoring stroke risk in sickle cell disease, and as a supplementary test for confirming brain death. TCD uses acoustic windows to insonate arteries like the middle cerebral artery, assessing flow parameters like peak systolic velocity to evaluate stenosis or vasomotor reactivity. It can also detect embolic signals and changes in flow patterns associated with conditions like atrial fibrillation or cerebral circulatory arrest.
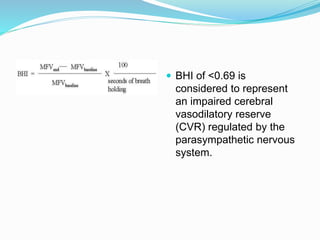
![ Scanning protocol and algorithm if cerebral circulatory arrest is
suspected:
a. Document arterial blood pressure at the time of TCD
examination.
b. Assess both MCAs (starting depth 50 mm) and BA (80 mm).
c. Positive MCA or BA end-diastolic flow is found = No cerebral
circulatory arrest.
d. Absent end-diastolic flow = Uncertain cerebral circulatory
arrest (too early or too late).
e. Reversed minimal end-diastolic flow = Possible cerebral
circulatory arrest [continue monitoring, document diastolic
blood pressure (BP) ≥50 mmHg].
f. Reverberating flow = Probable cerebral circulatory arrest
(confirm in both MCAs at 50-60 mm and BA at 80-90 mm).](https://image.slidesharecdn.com/transcranialdoppler-170703080732/85/Transcranial-doppler-46-320.jpg)


![Mechanical thrombectomy in acute stroke [Autosaved].pptx](https://cdn.slidesharecdn.com/ss_thumbnails/mechanicalthrombectomyinacutestrokeautosaved-230102142009-fe15766f-thumbnail.jpg?width=640&height=640&fit=bounds)


![DUAL AND TRIPLE ANTITHROMBOTIC THERAPY FOR SECONDARY STROKE [Autosaved].pptx](https://cdn.slidesharecdn.com/ss_thumbnails/dualandtripleantithrombotictherapyforsecondarystrokeautosaved-230904113552-c3502b37-thumbnail.jpg?width=640&height=640&fit=bounds)


