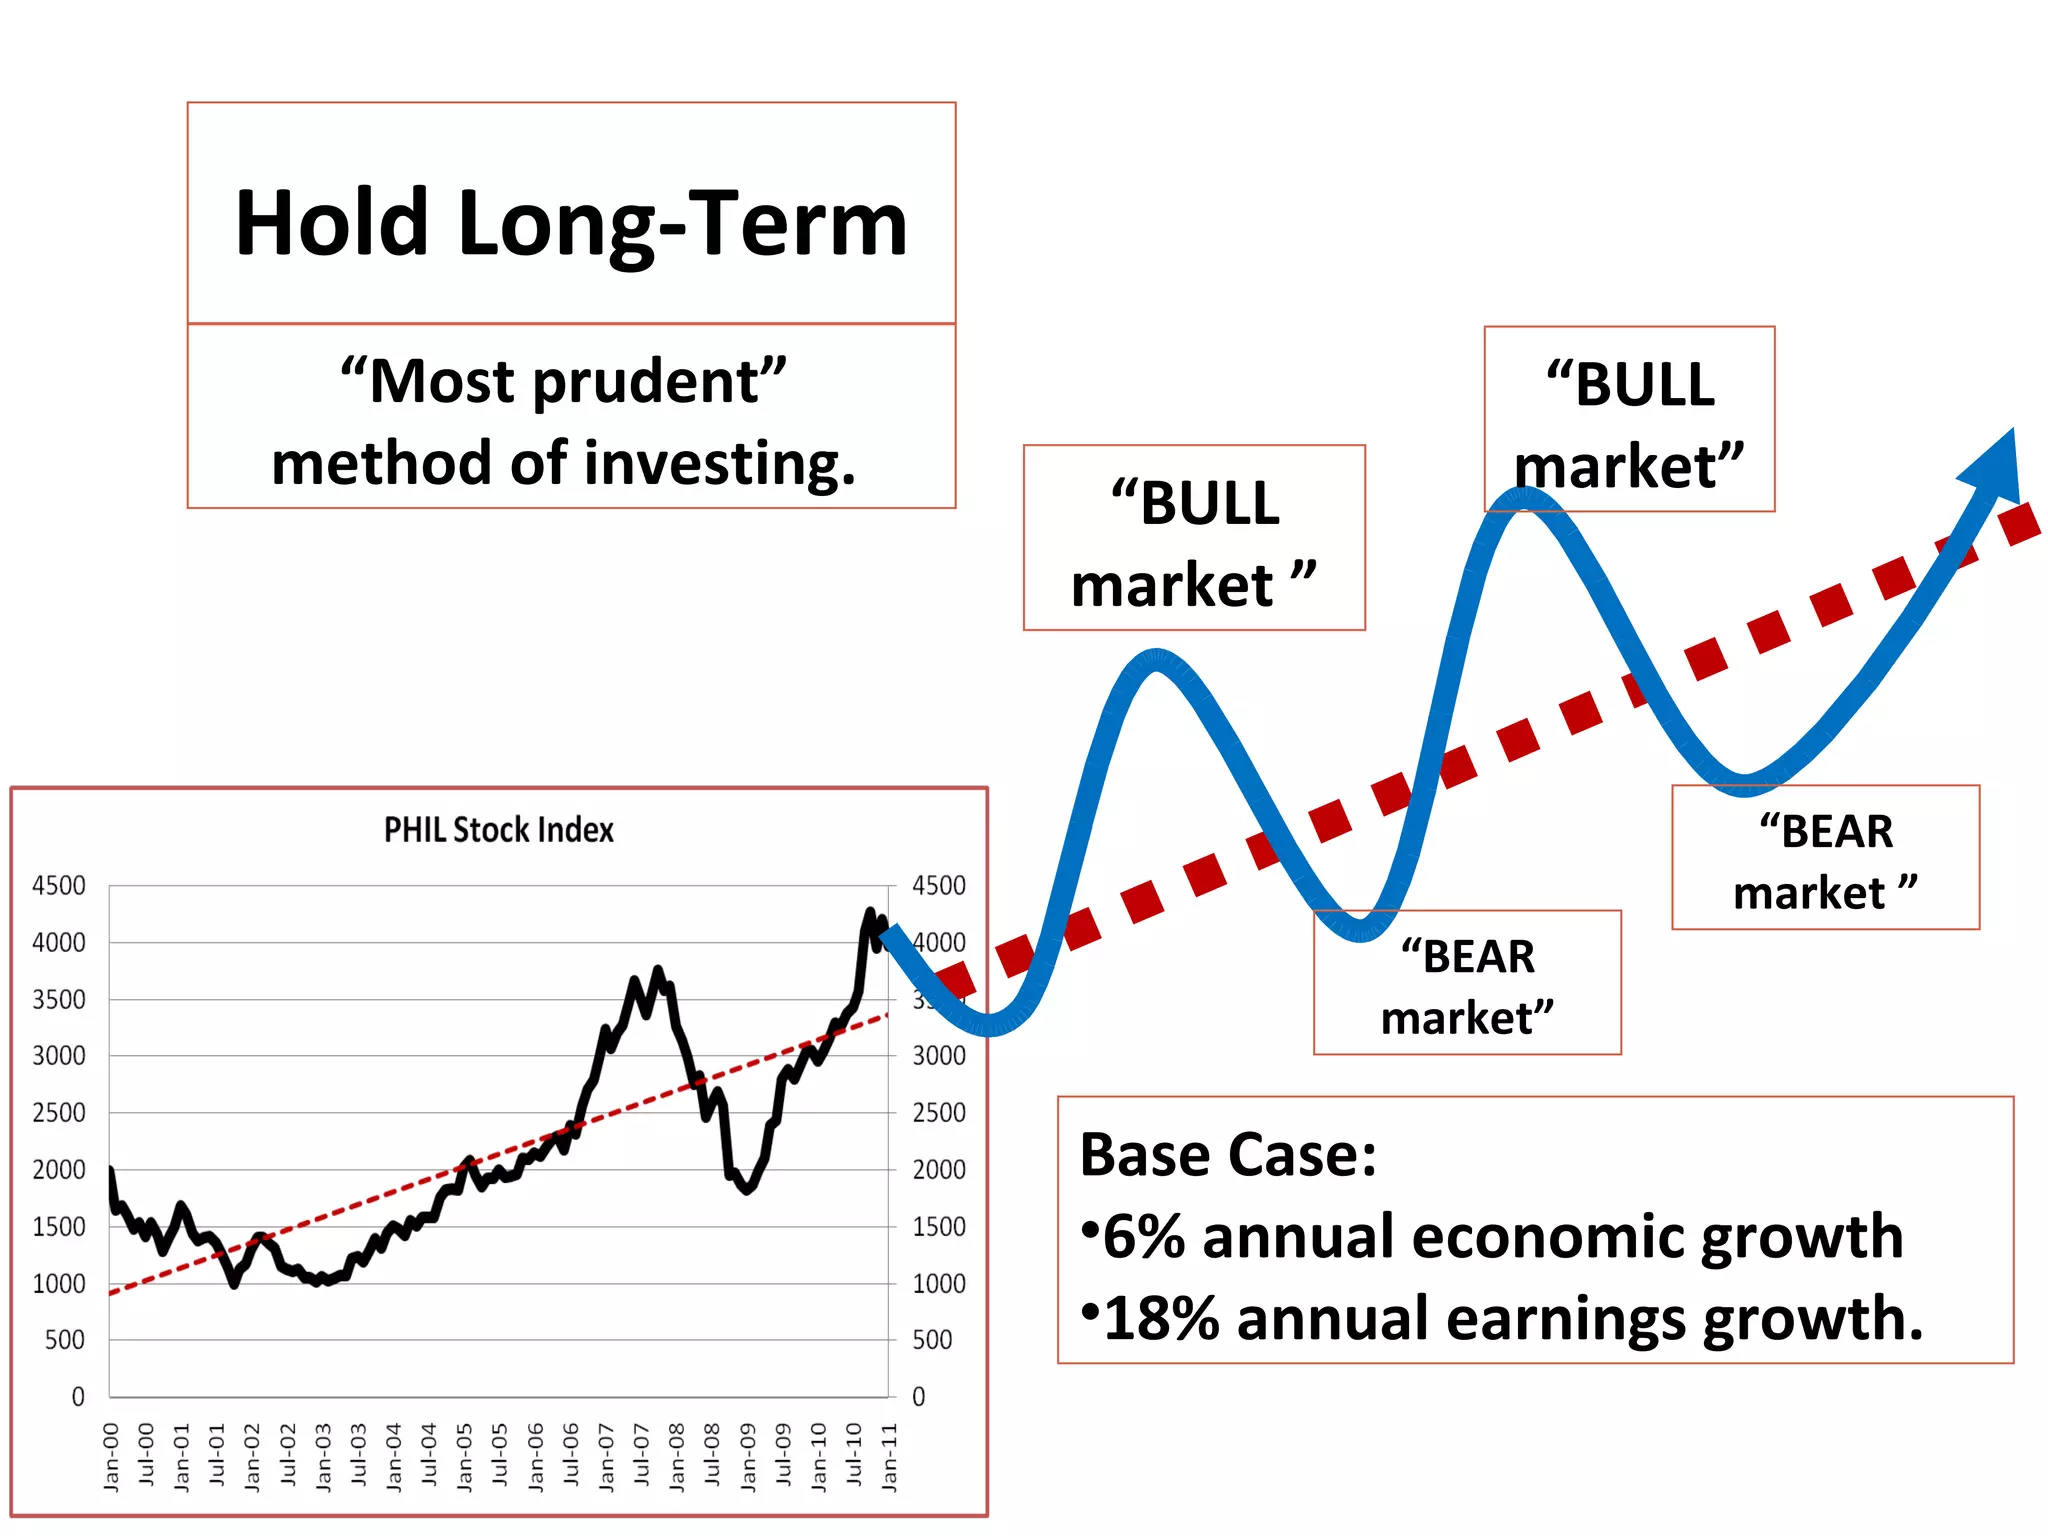
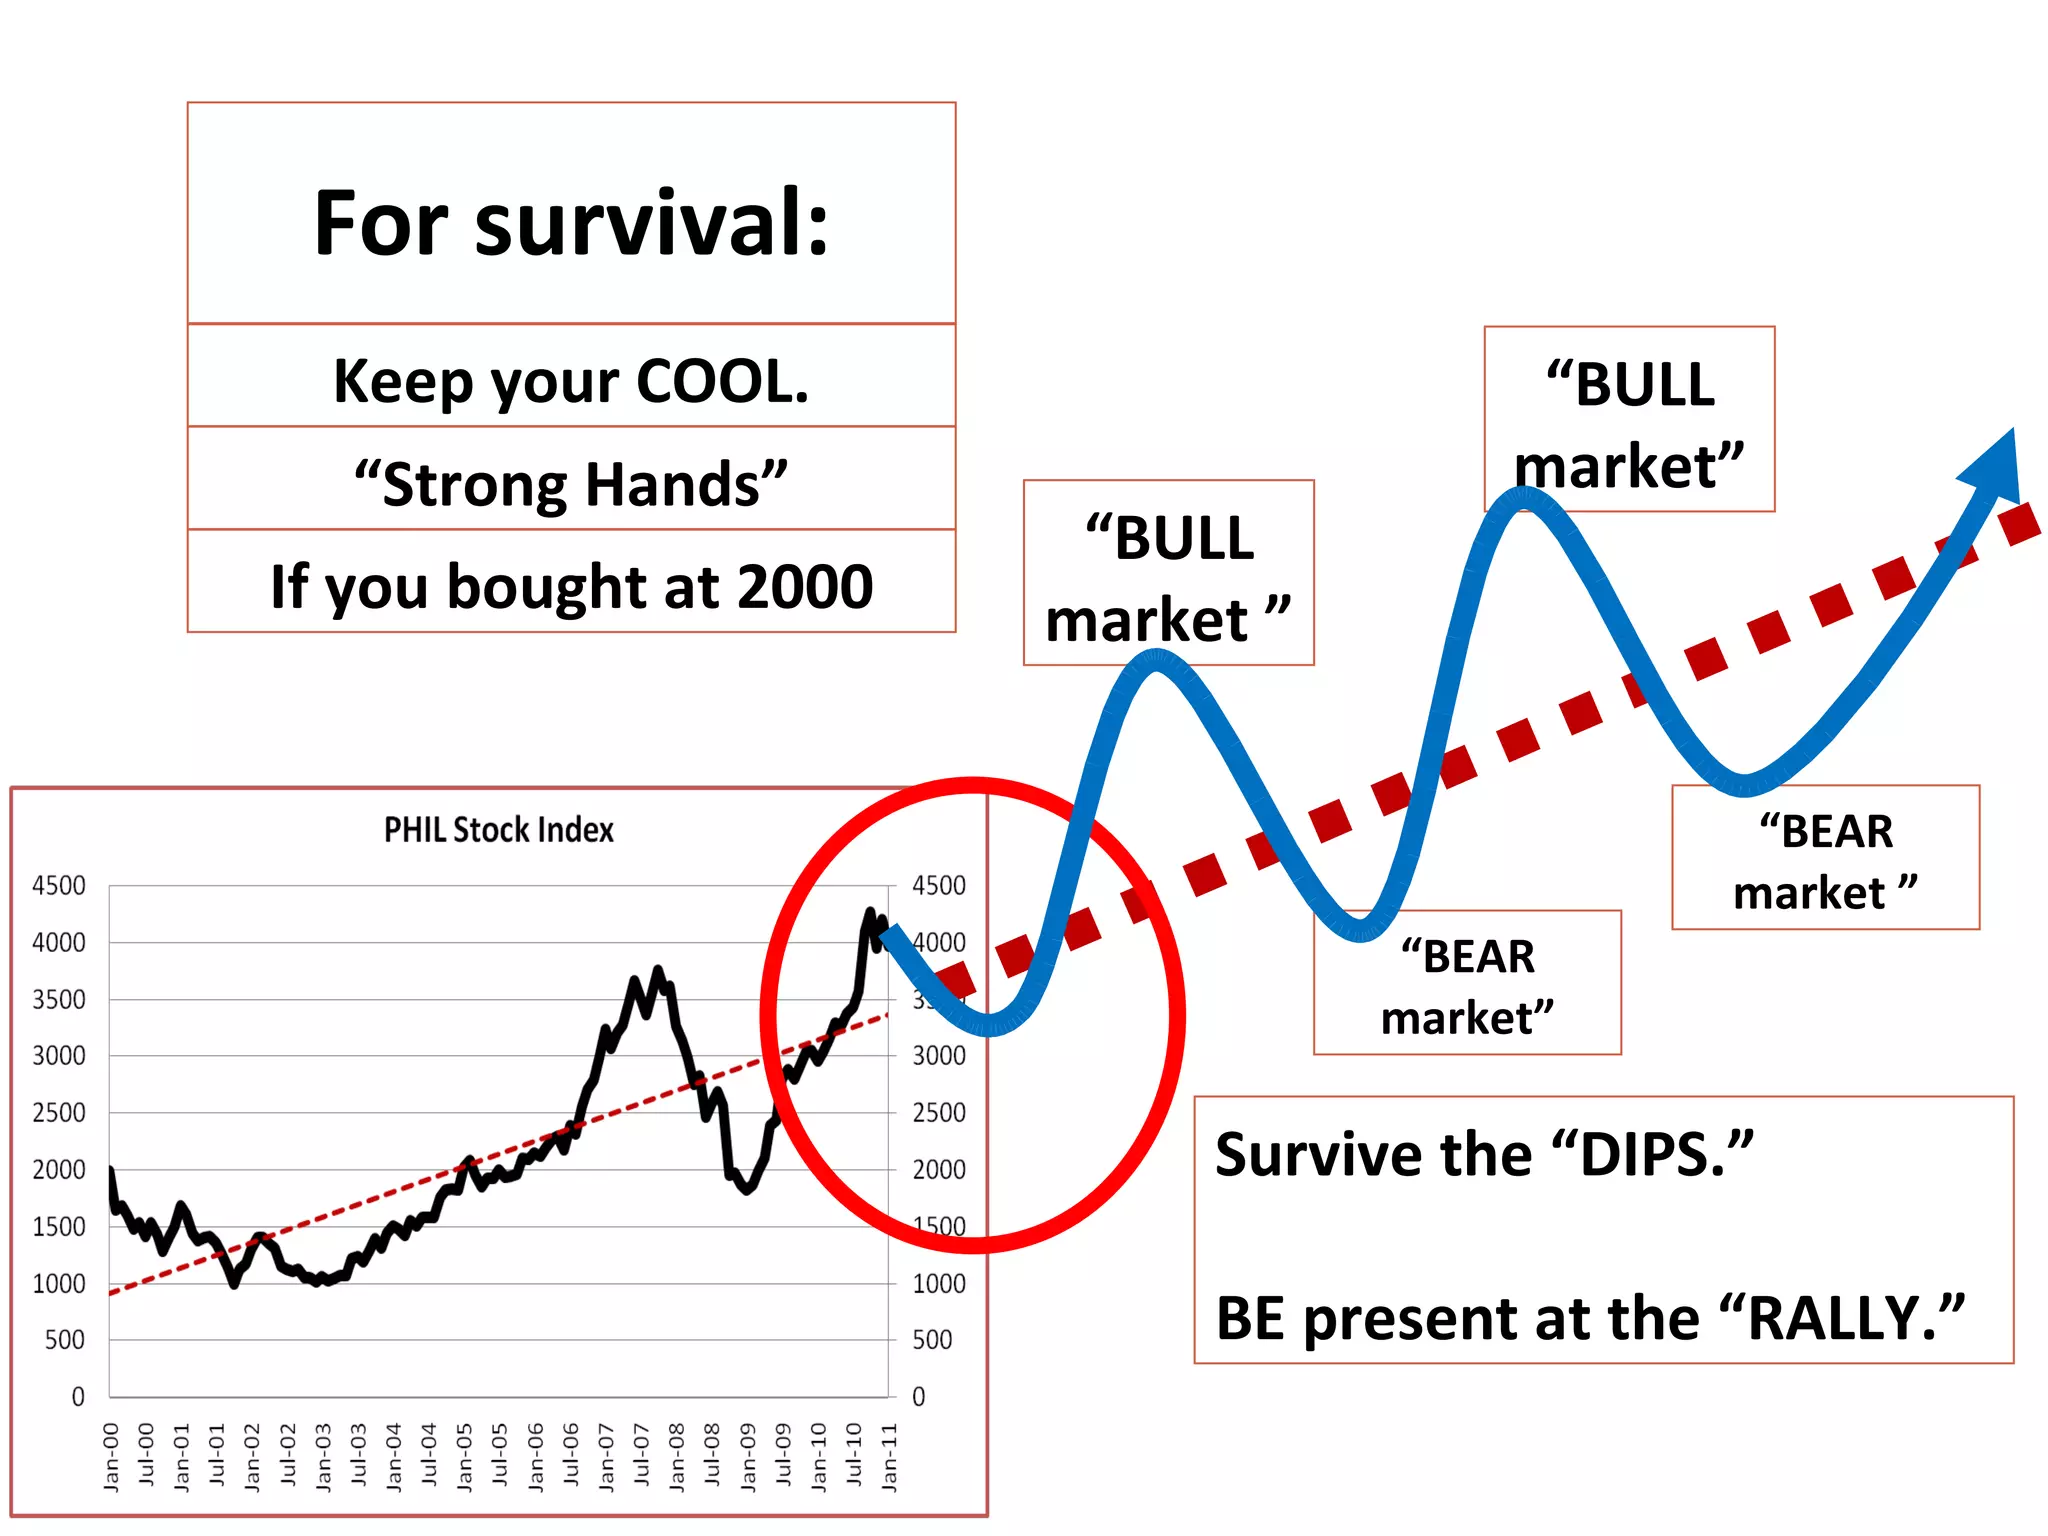
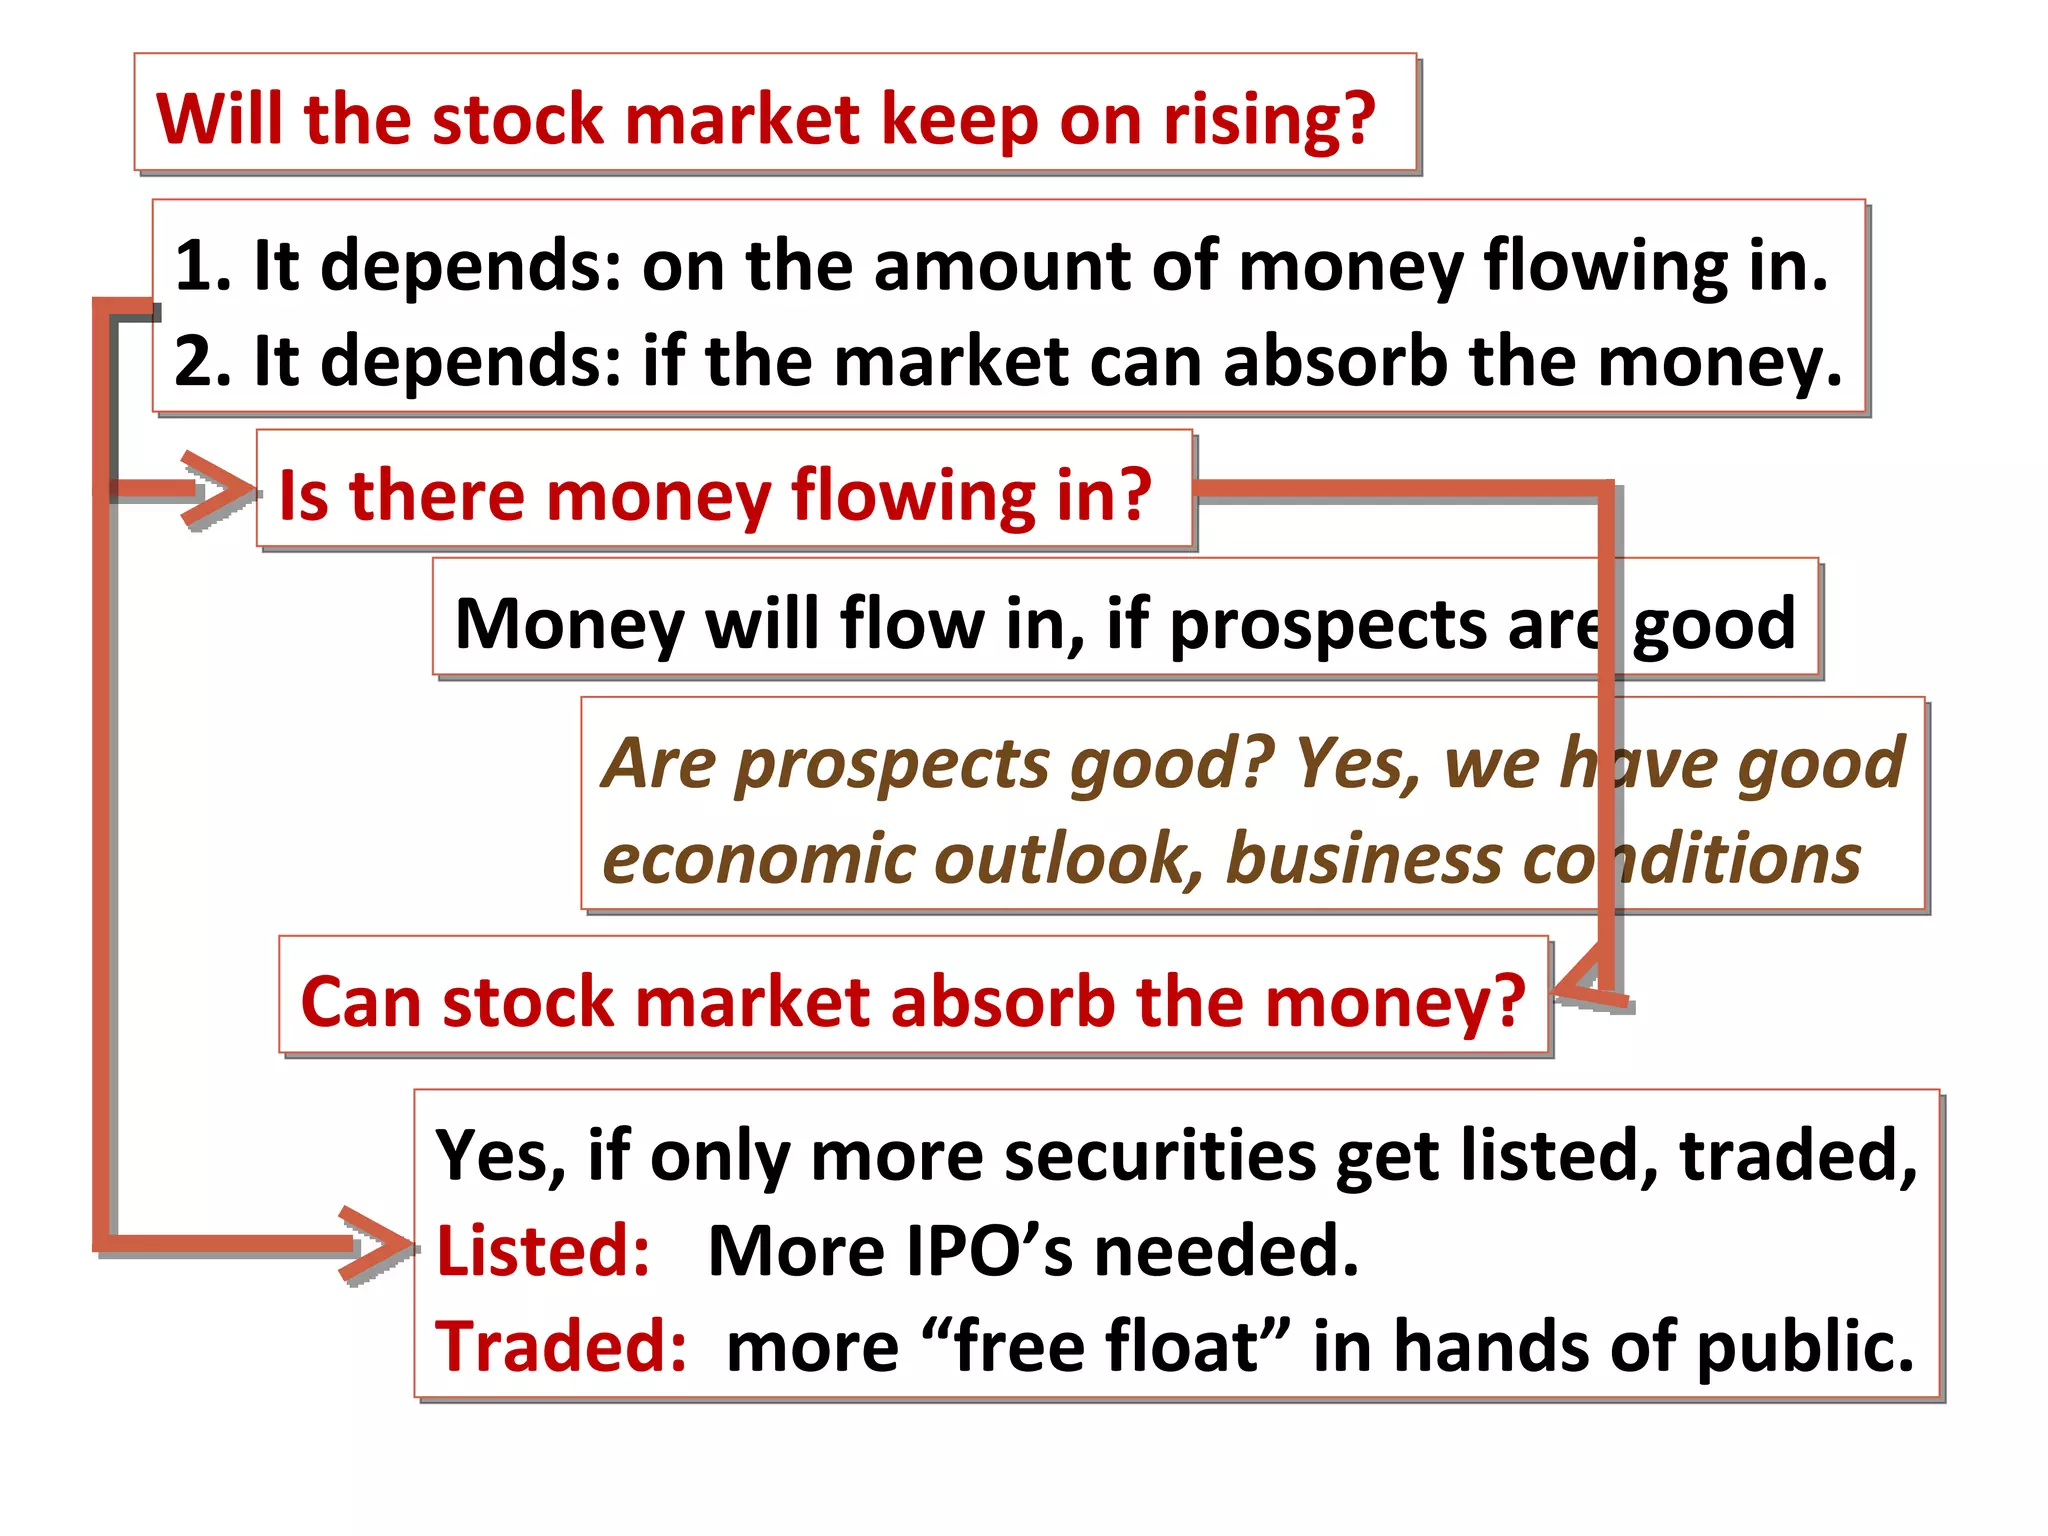
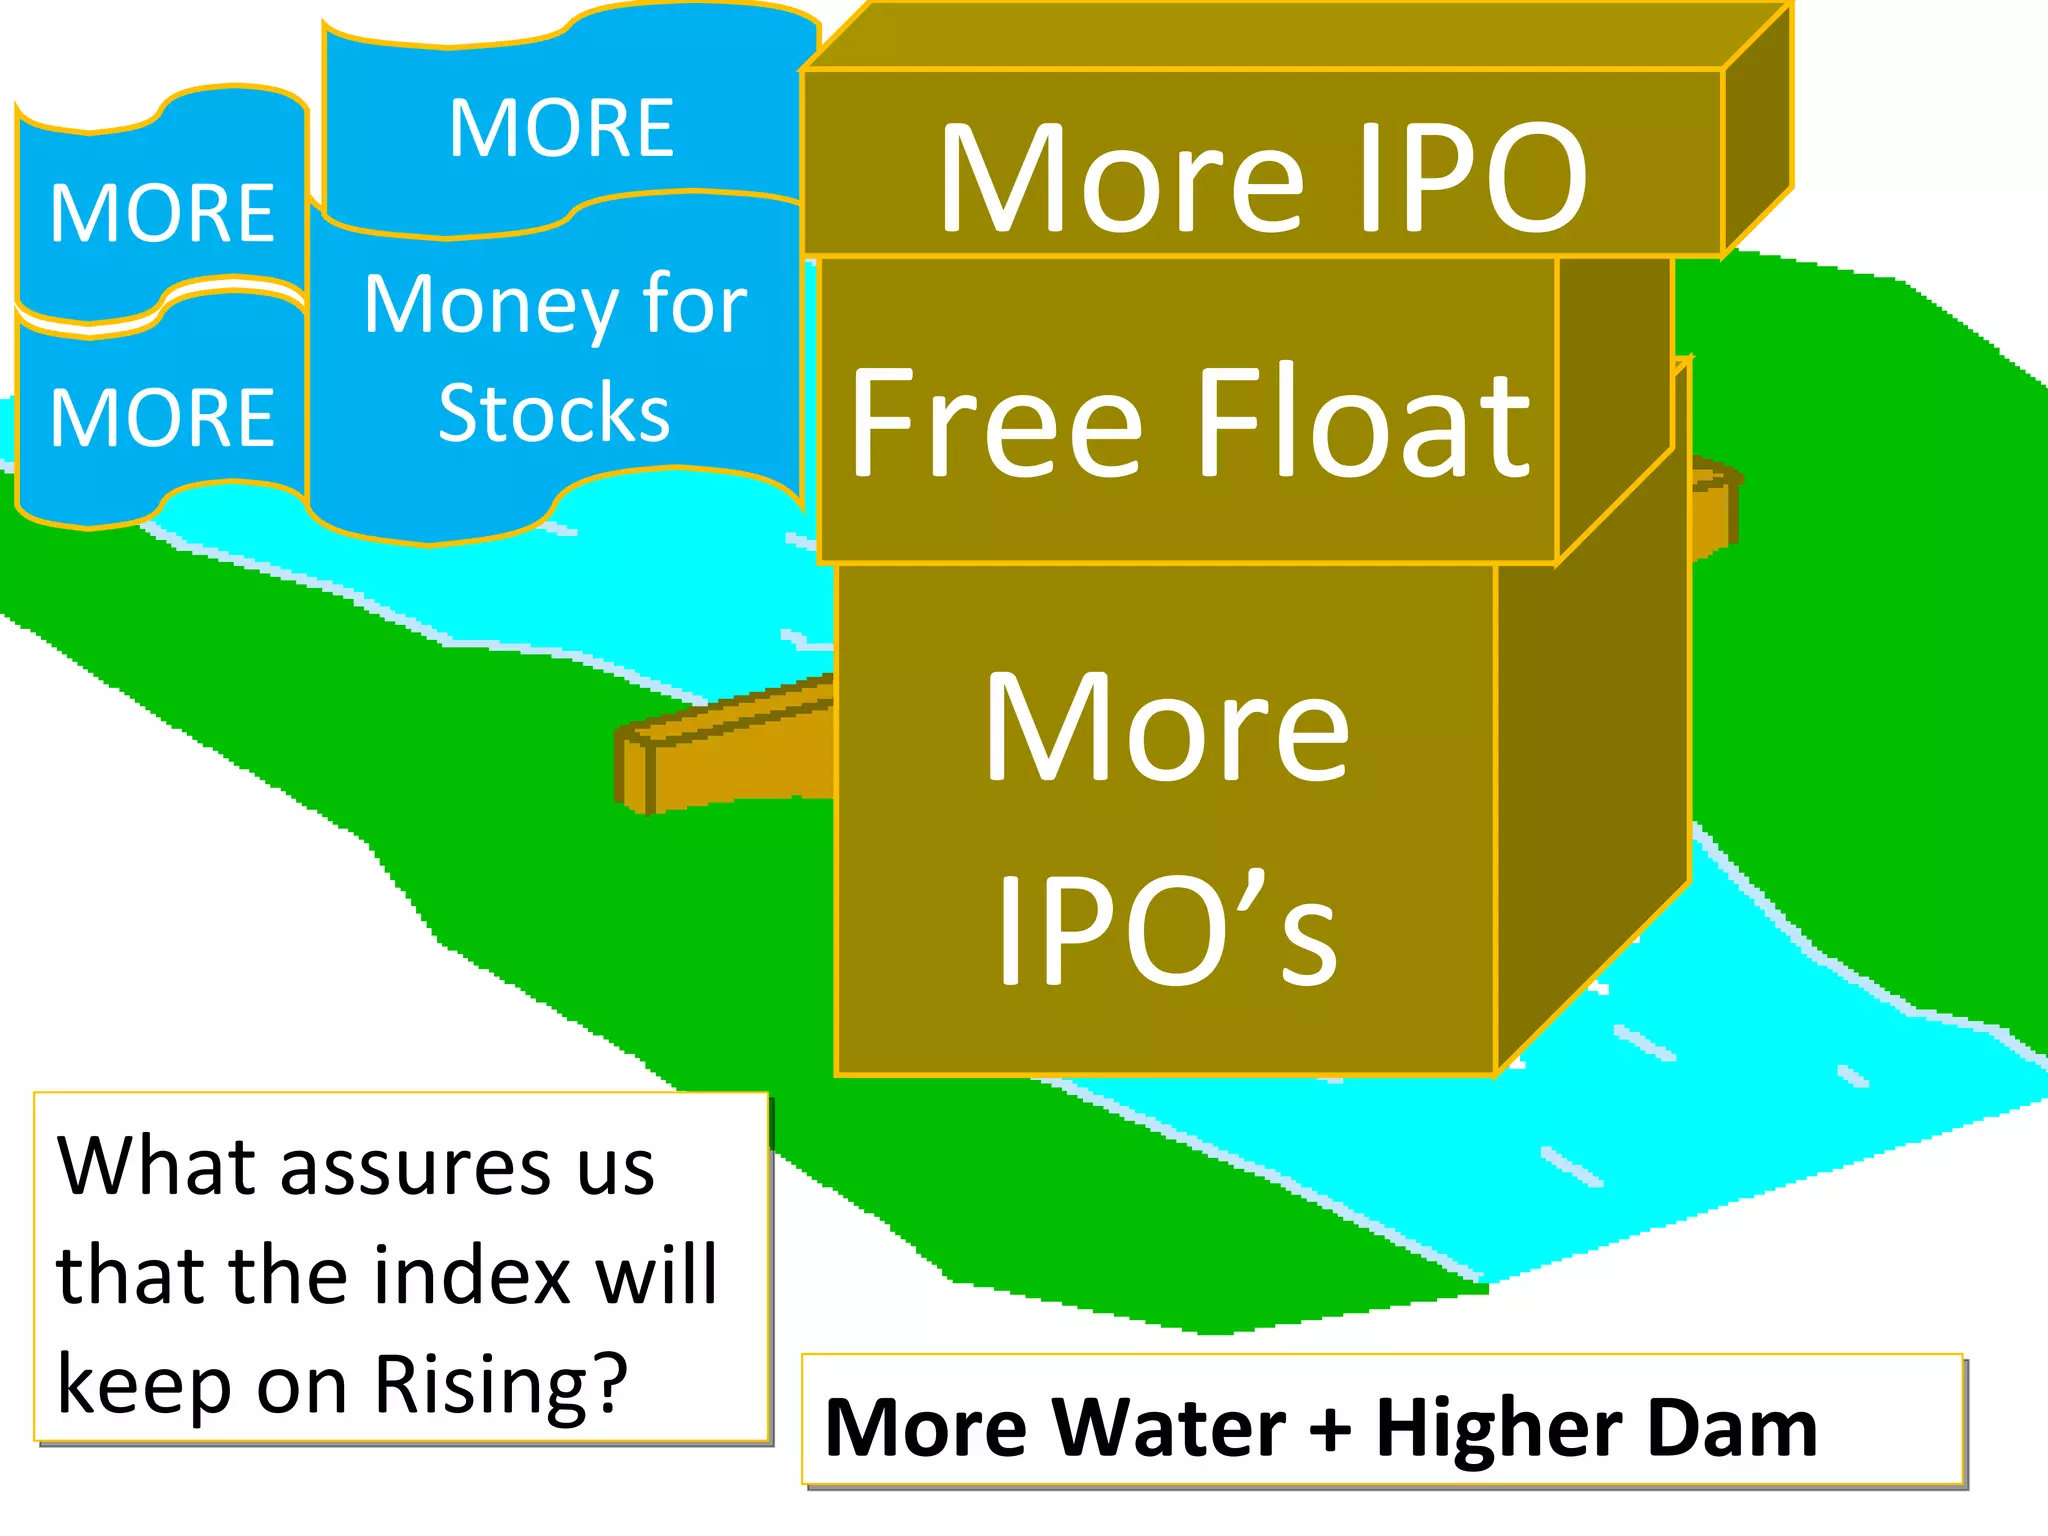
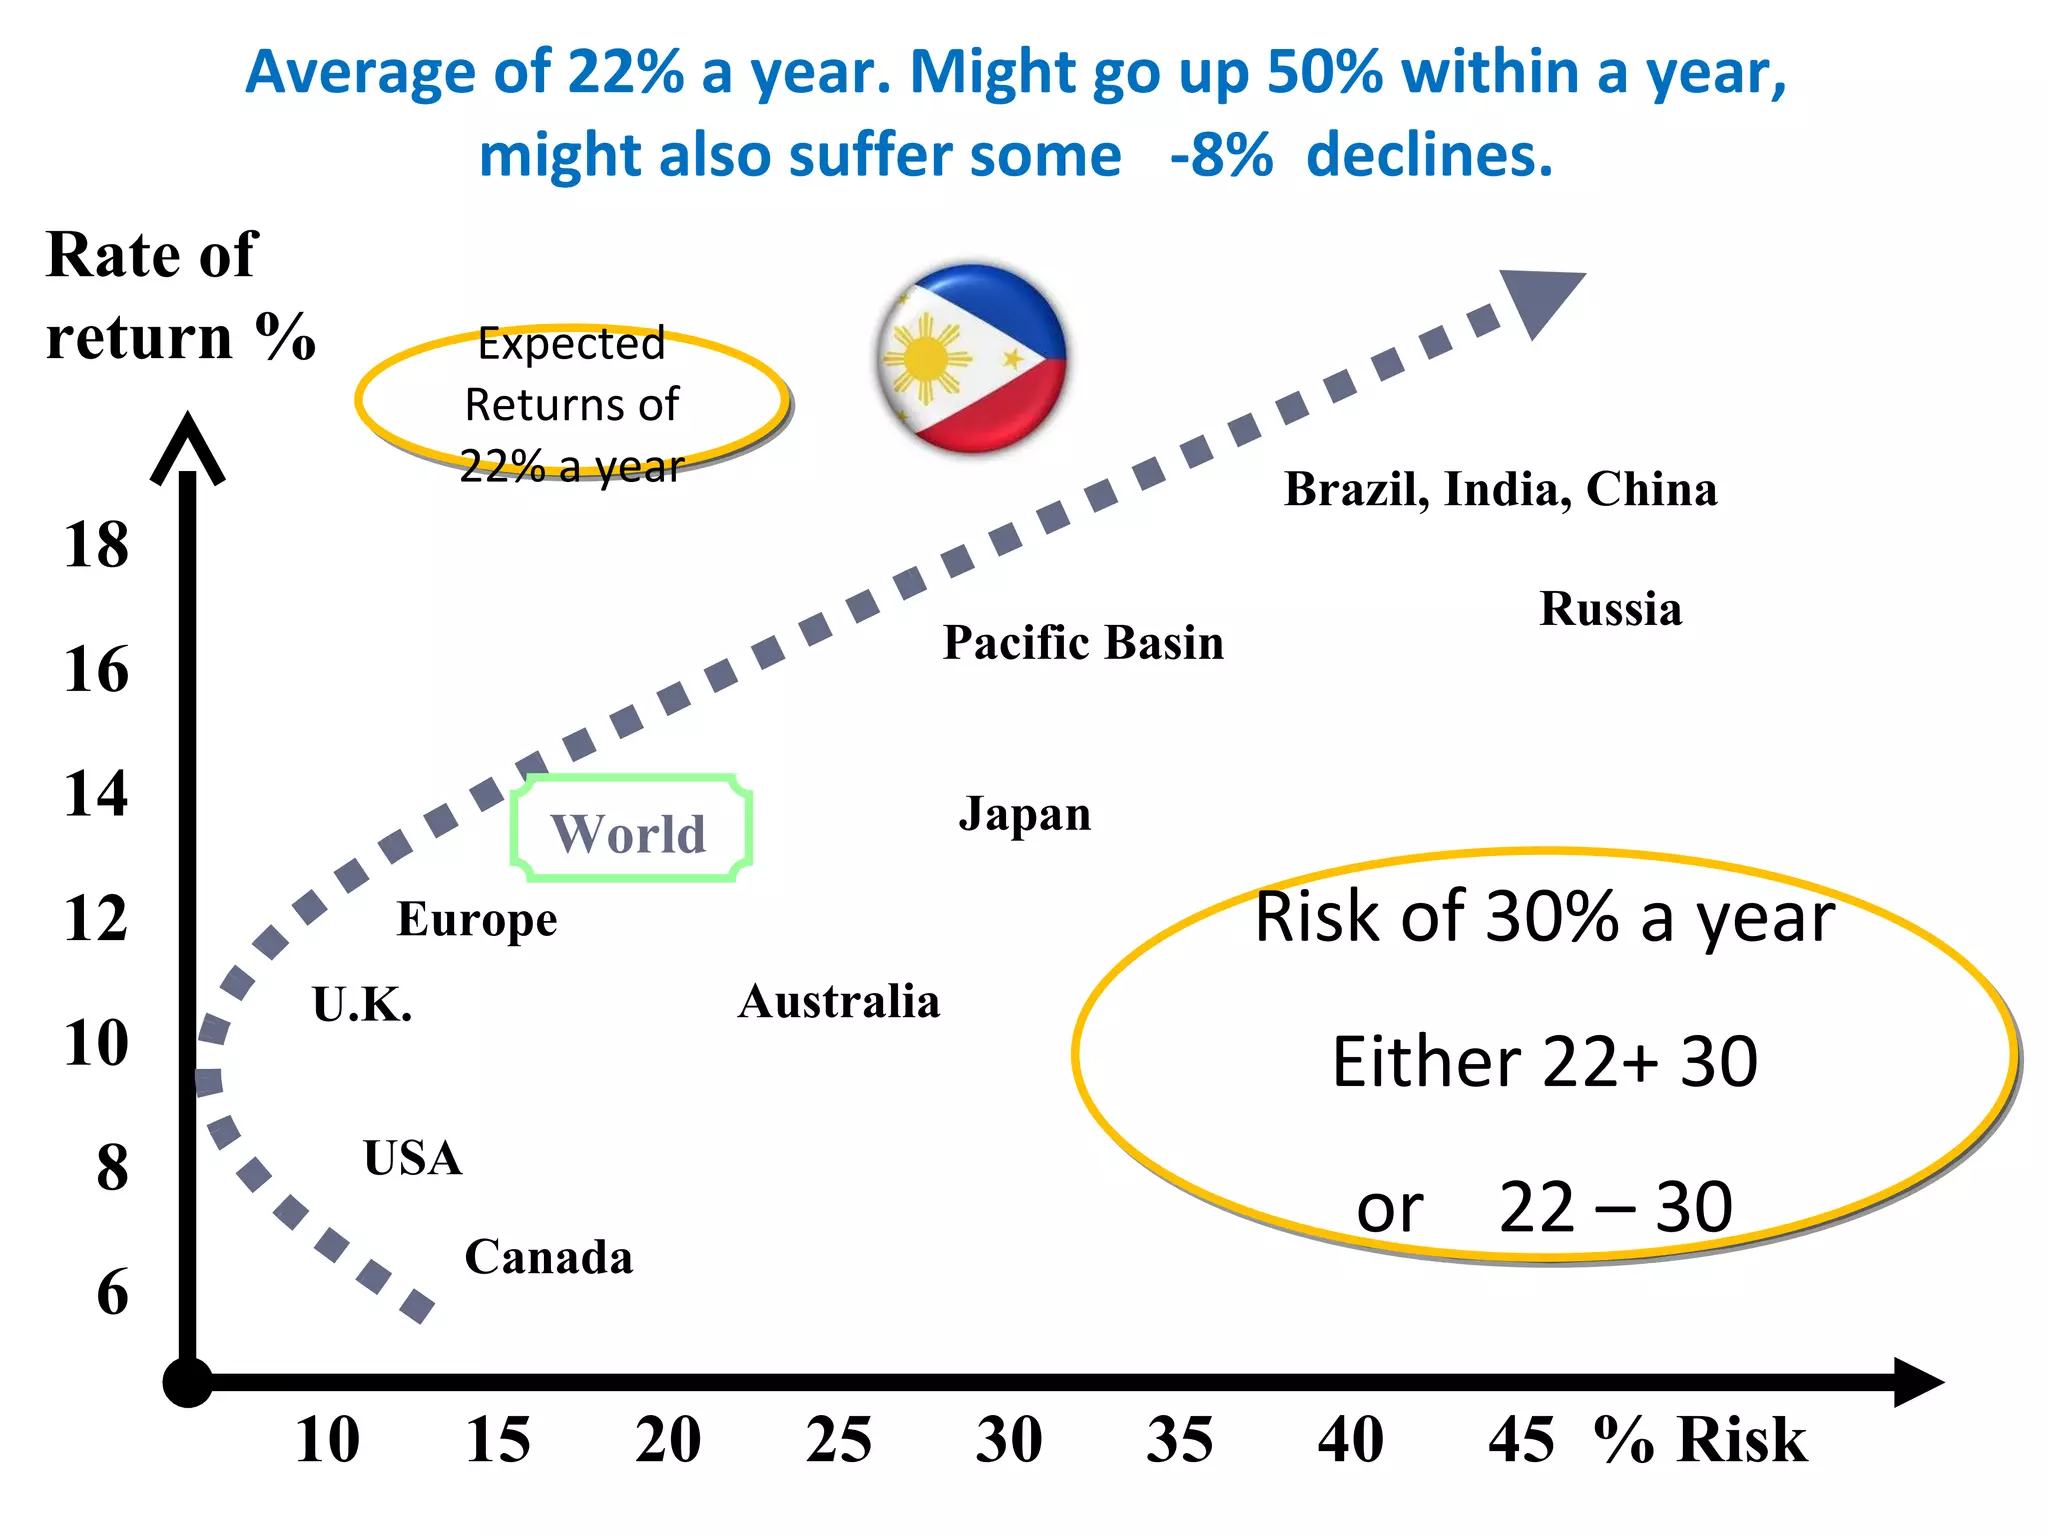
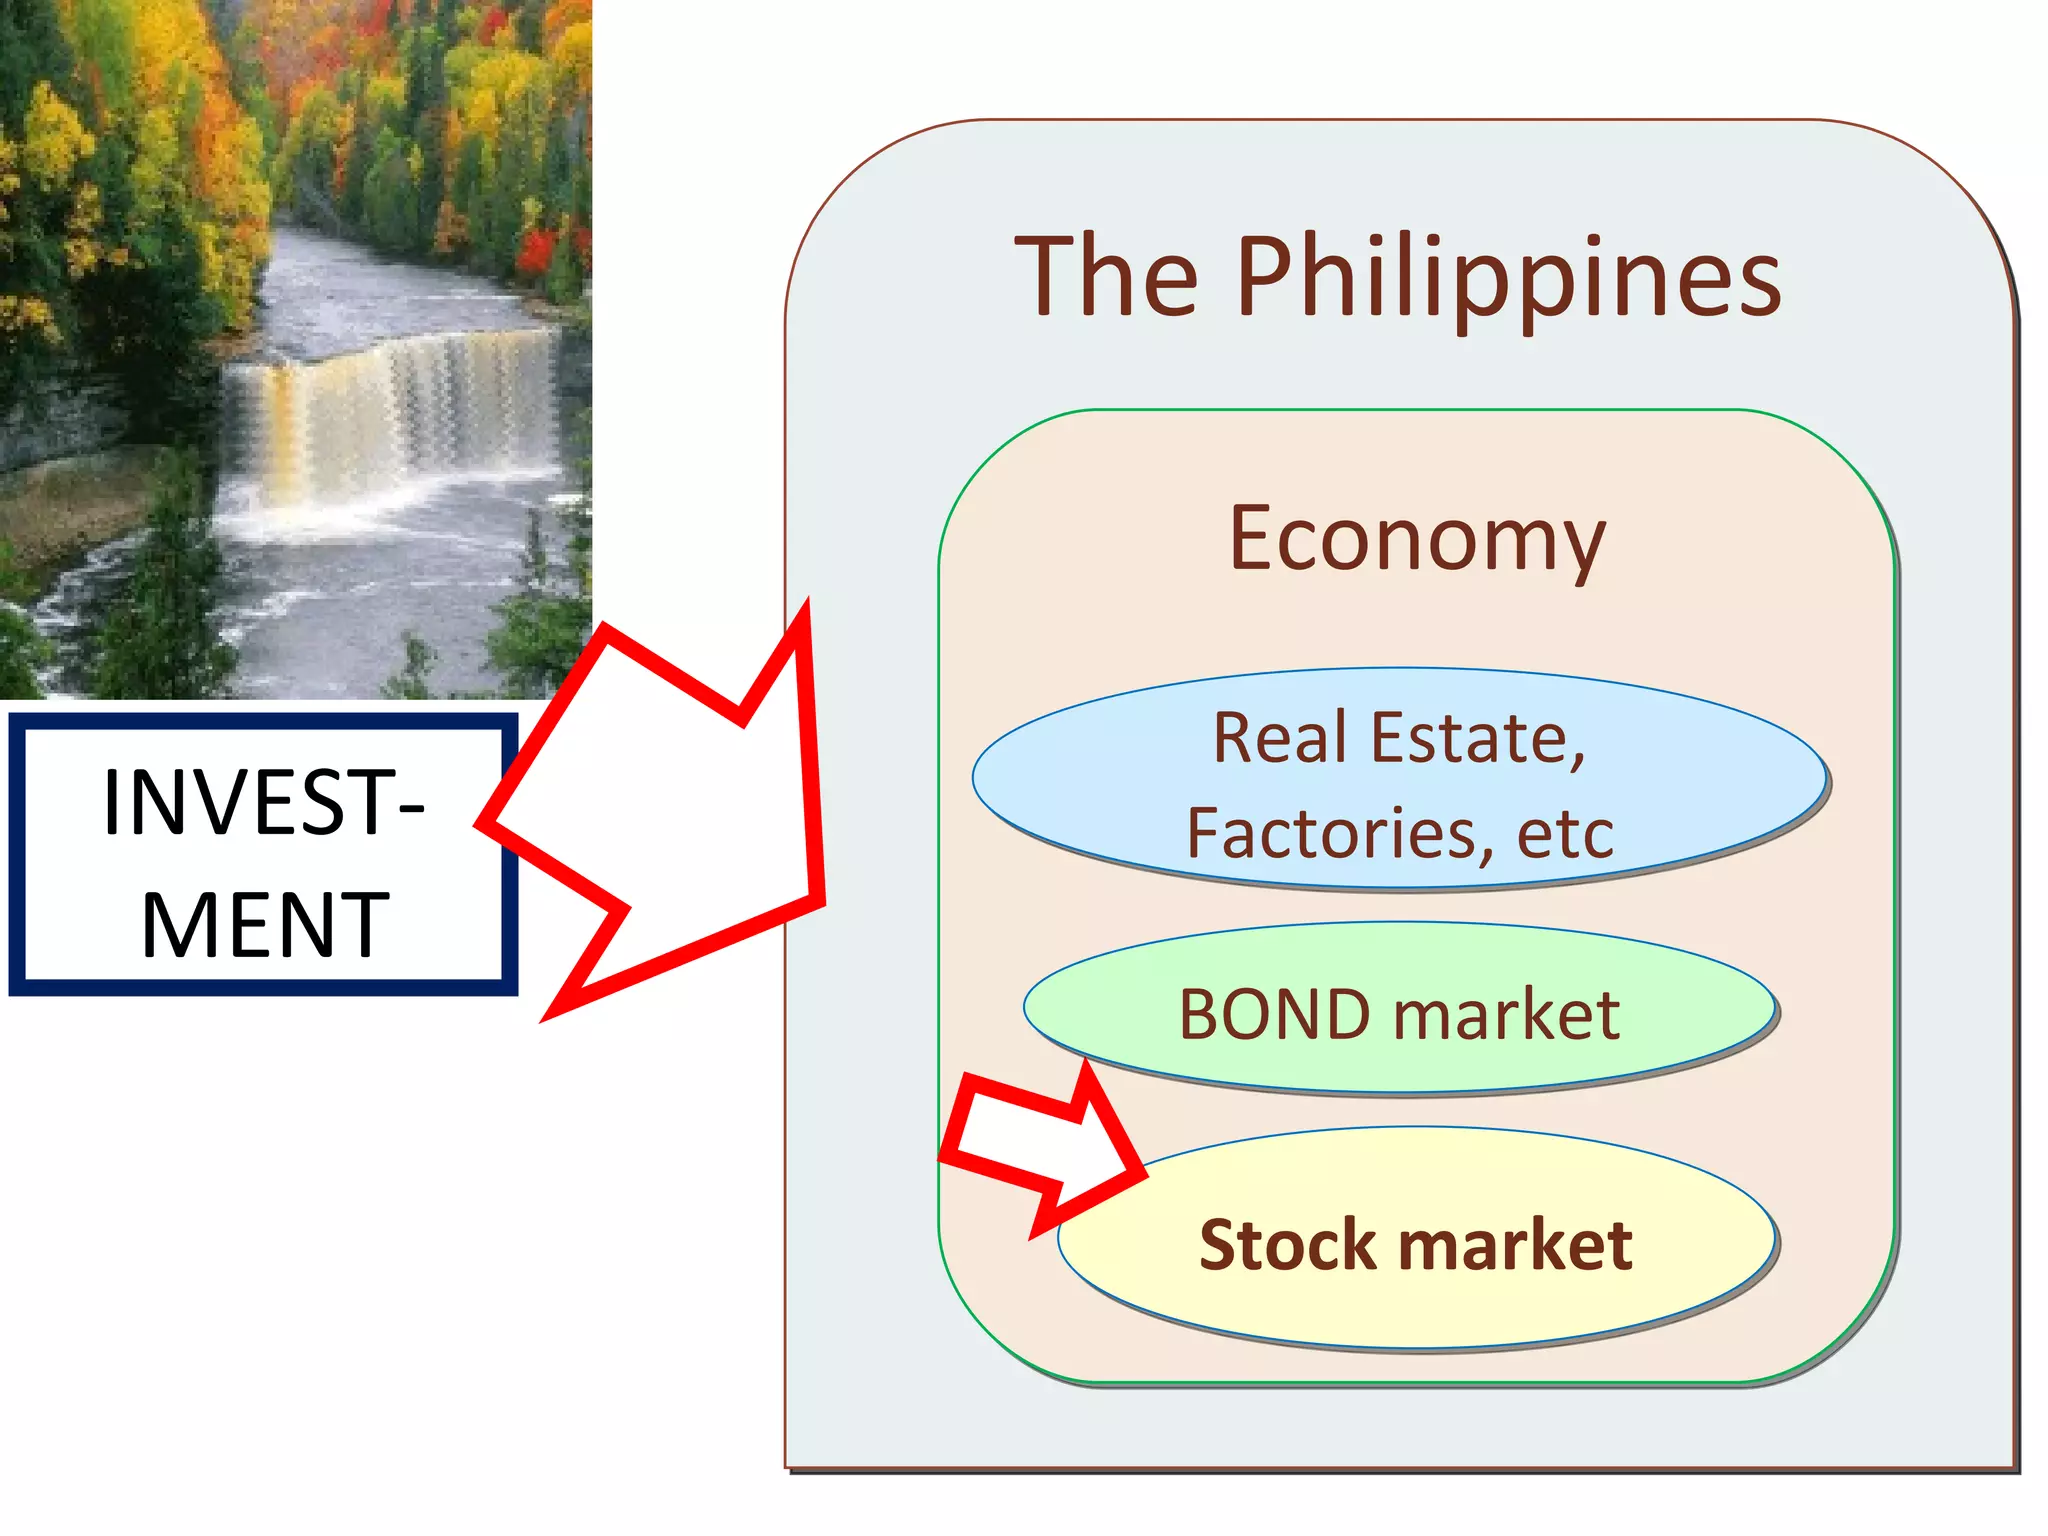
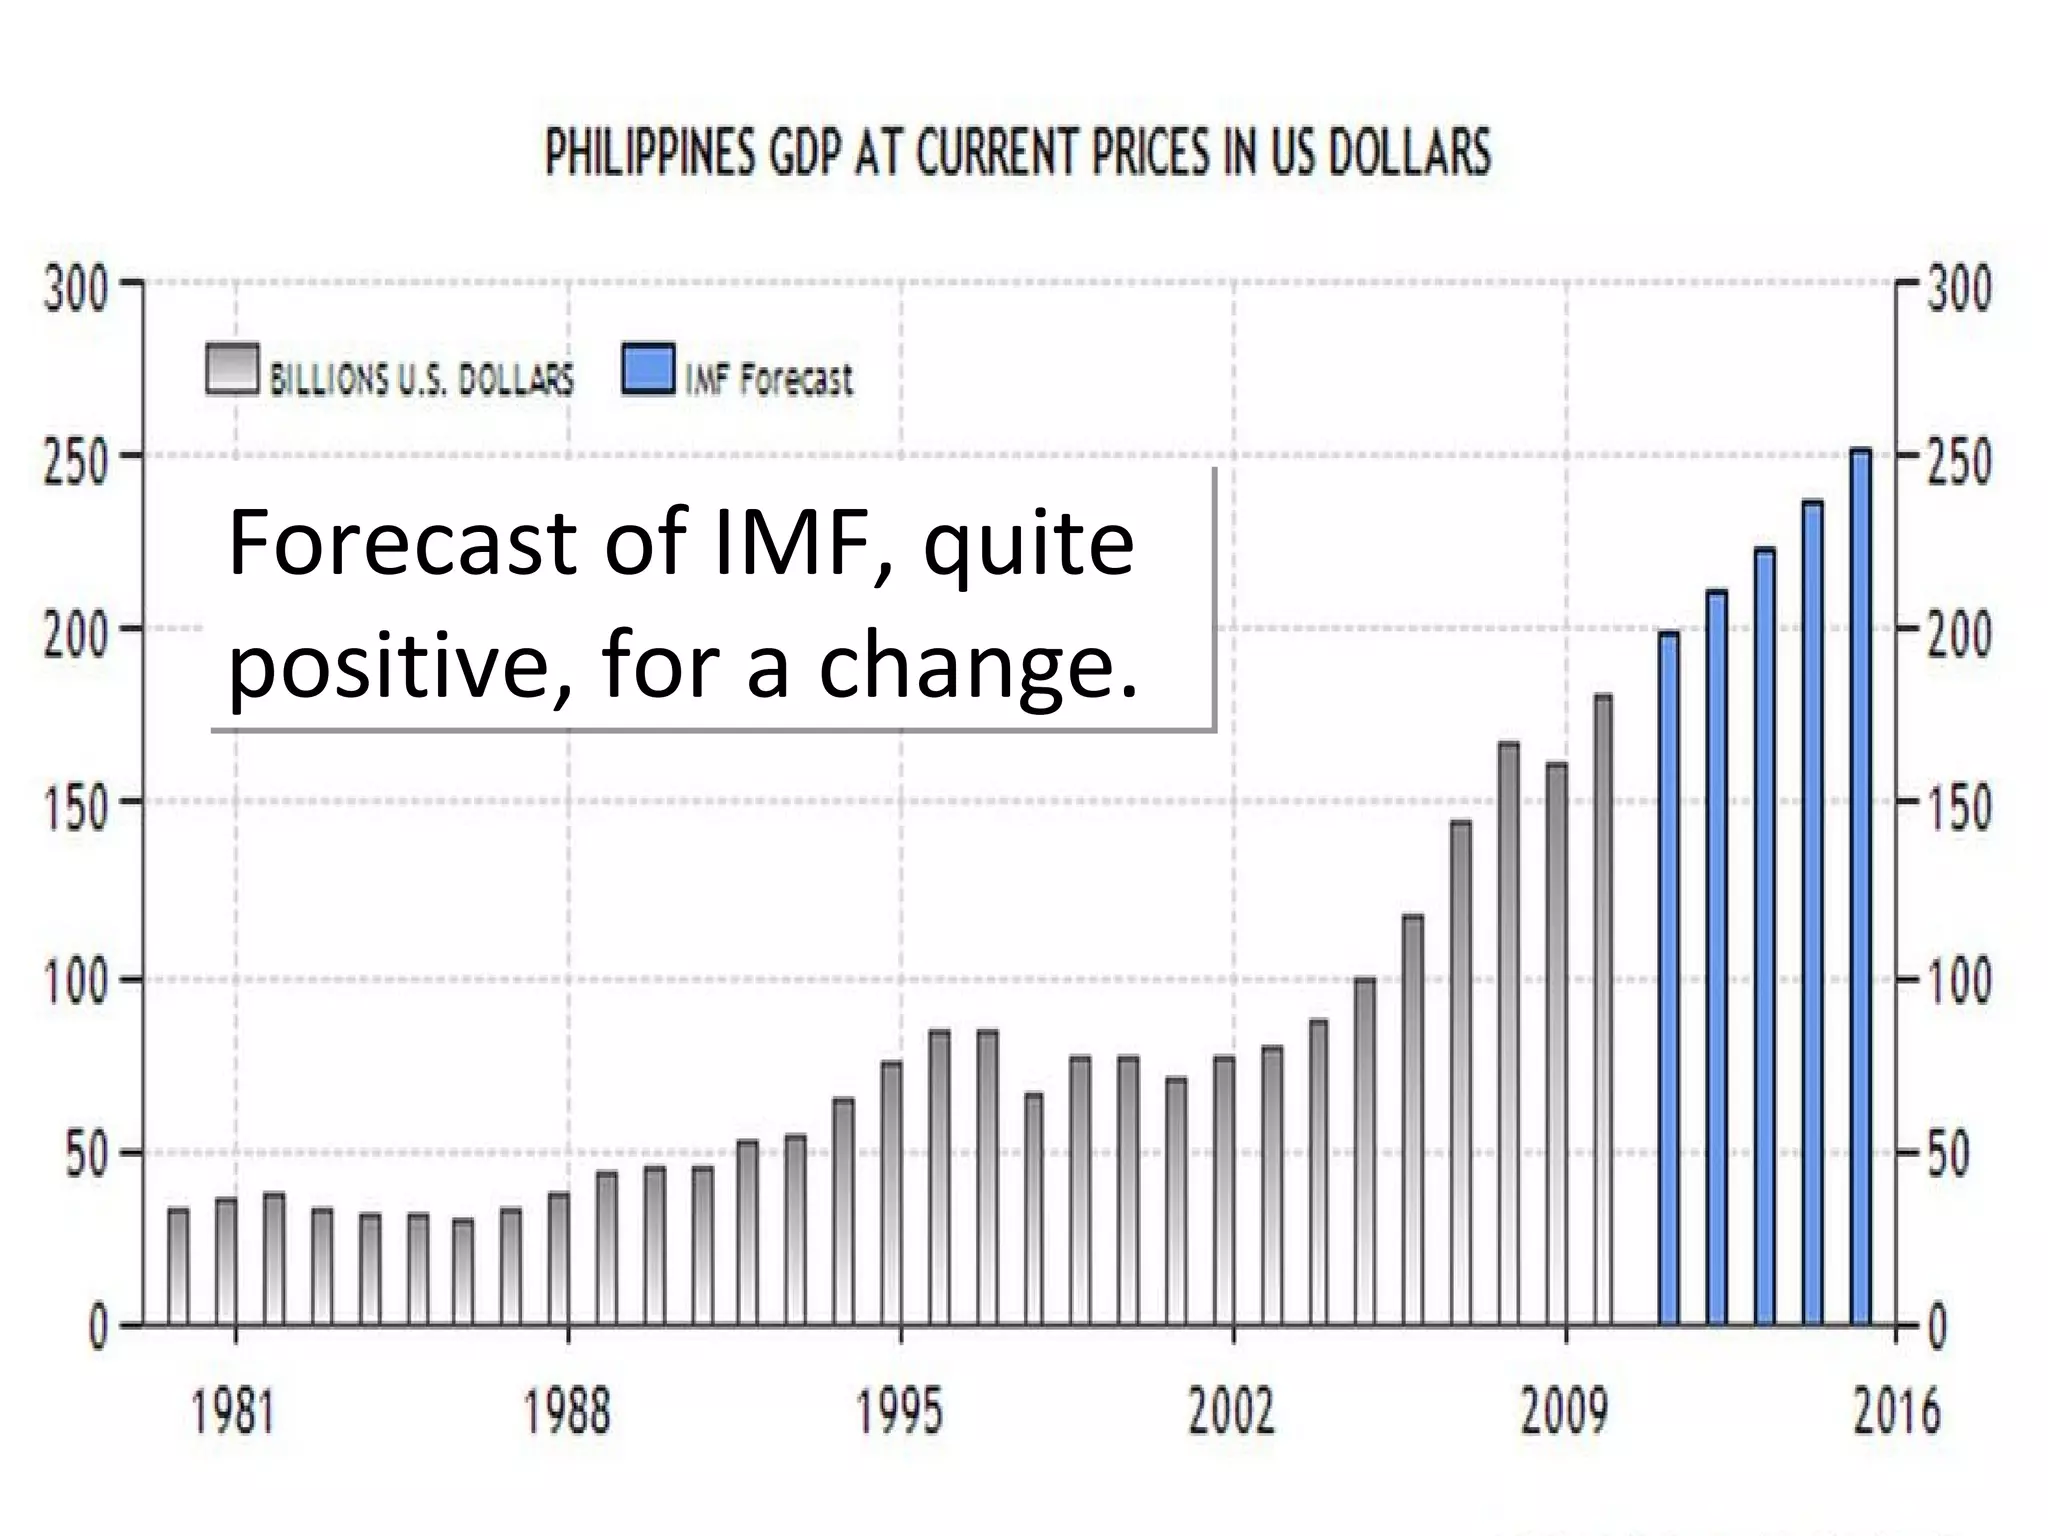
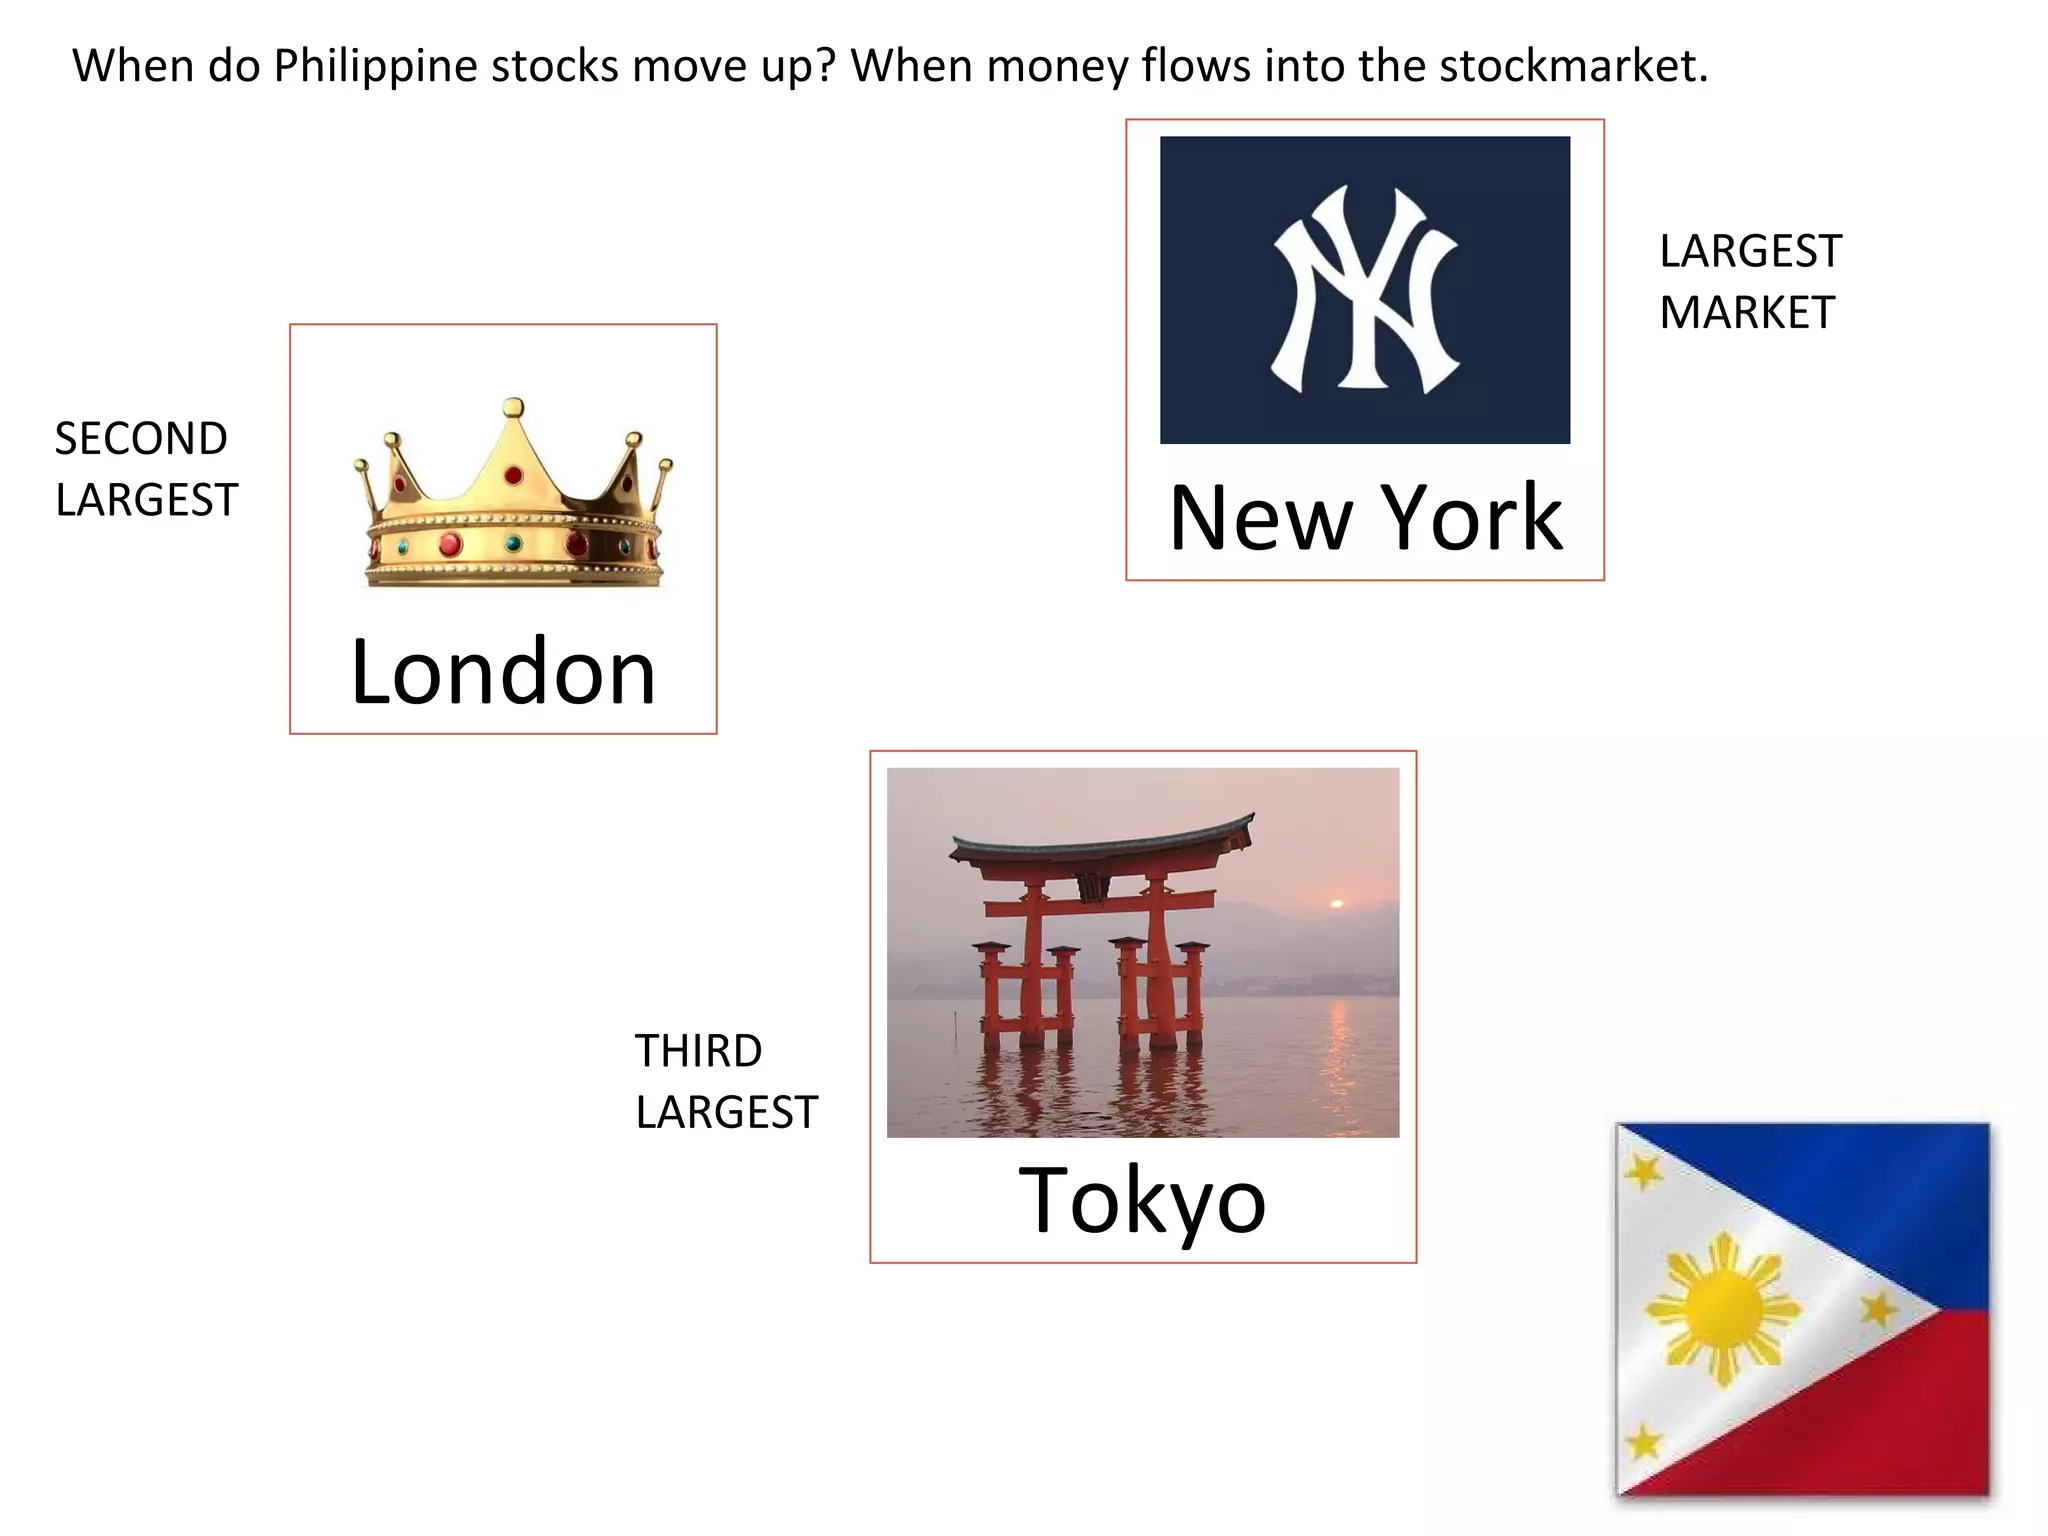
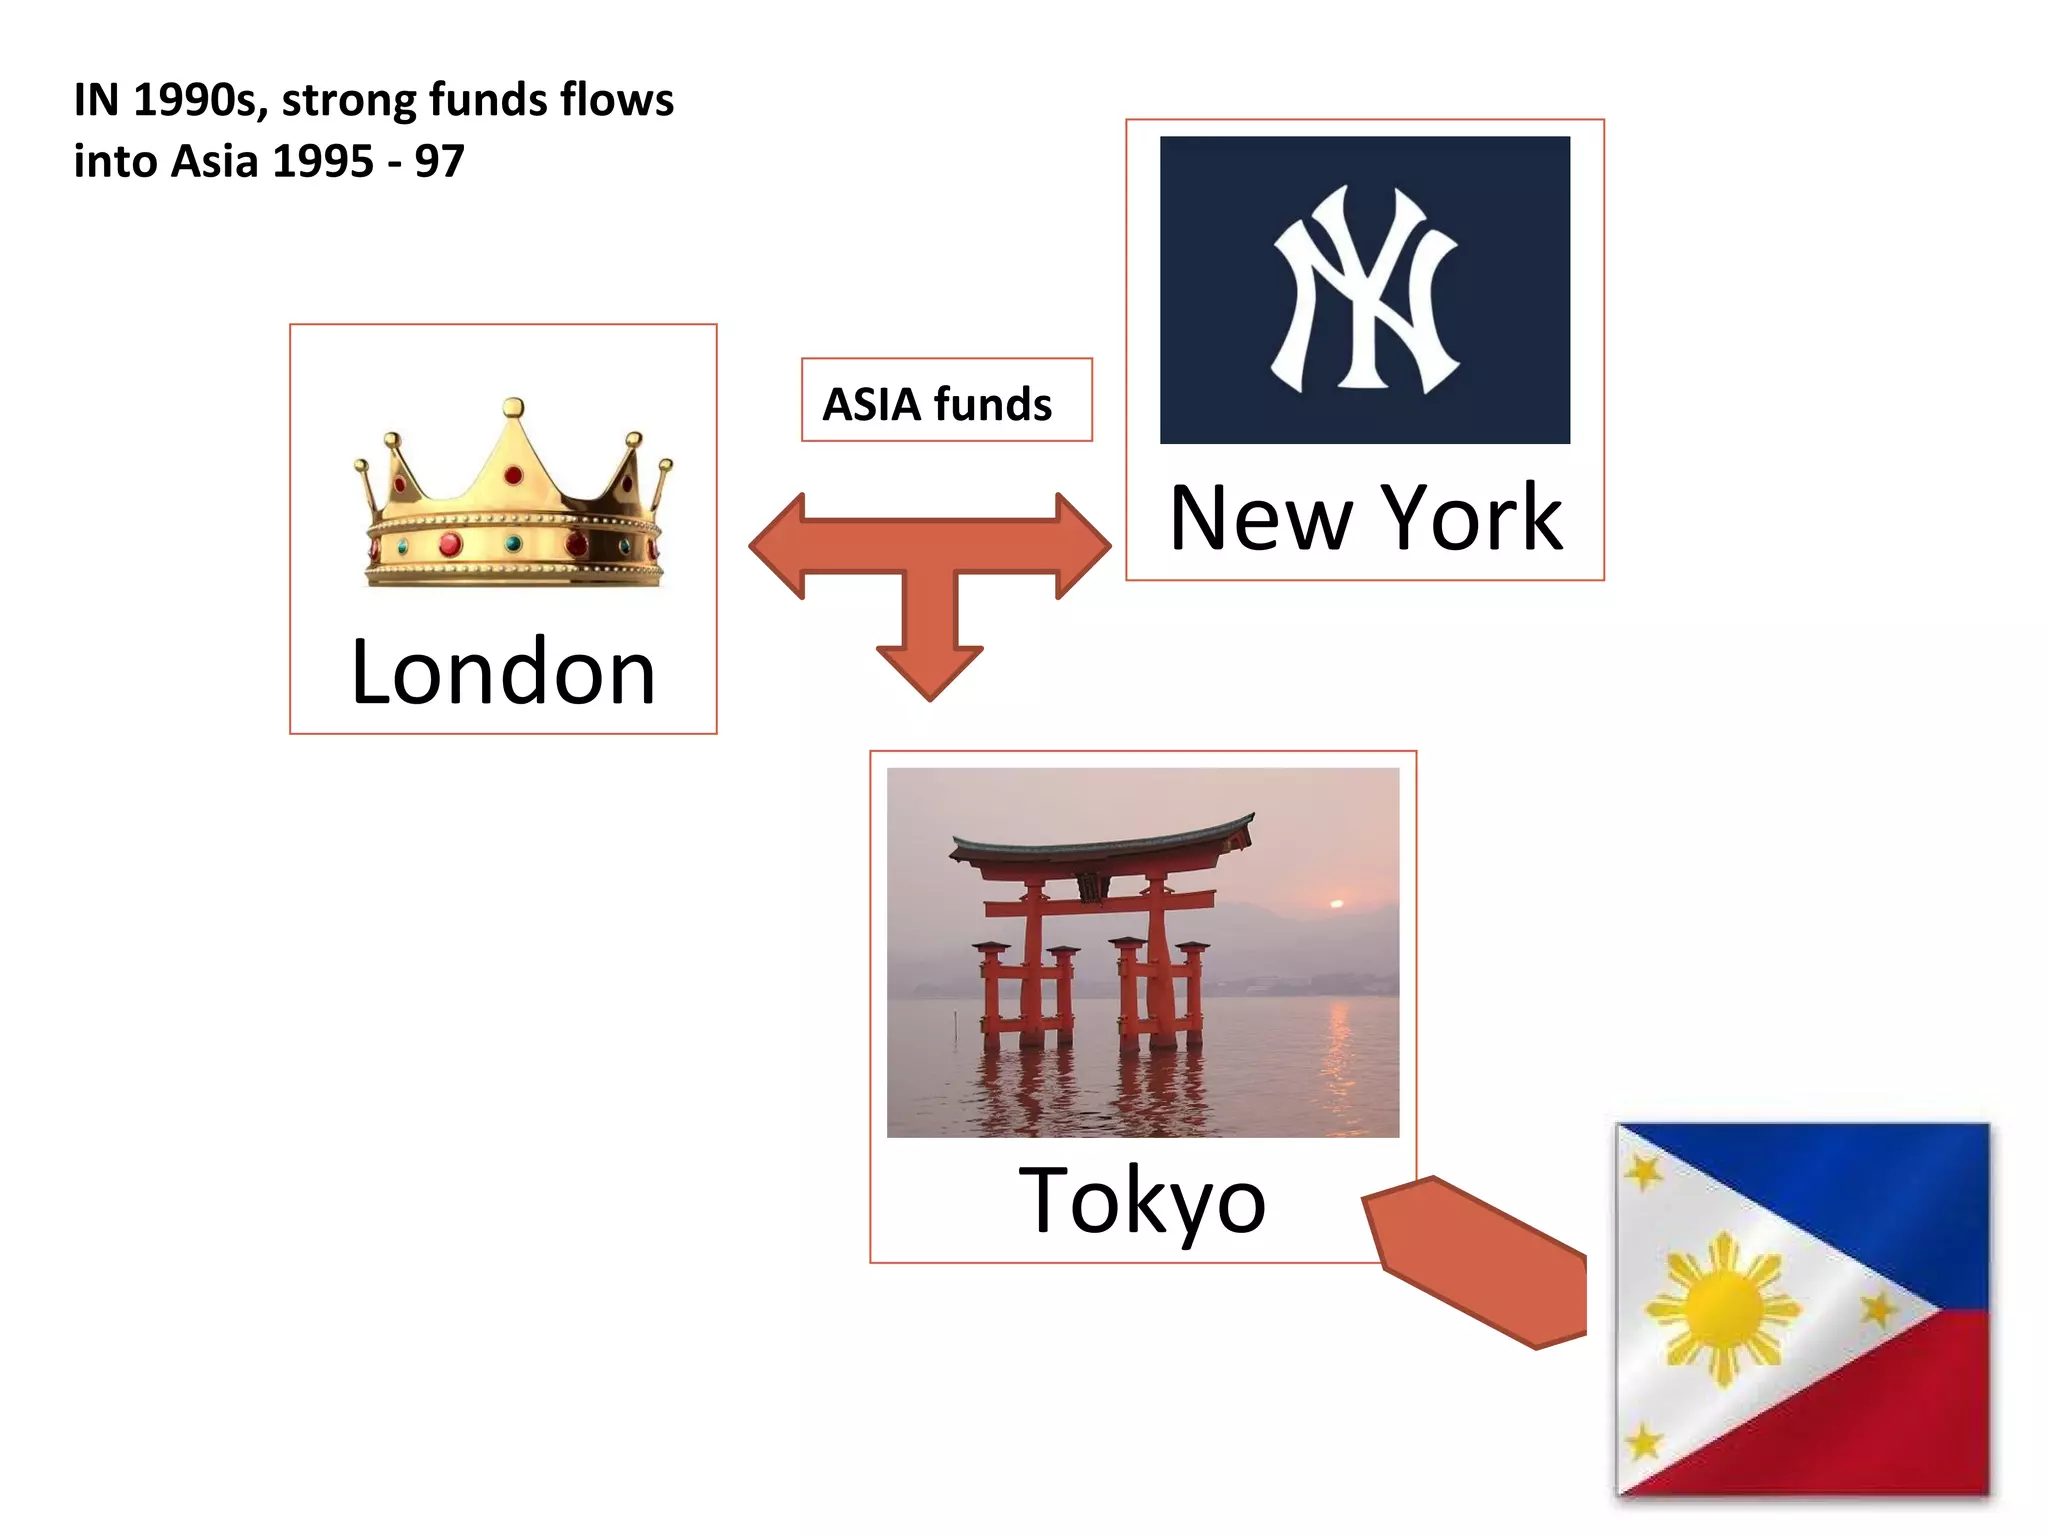
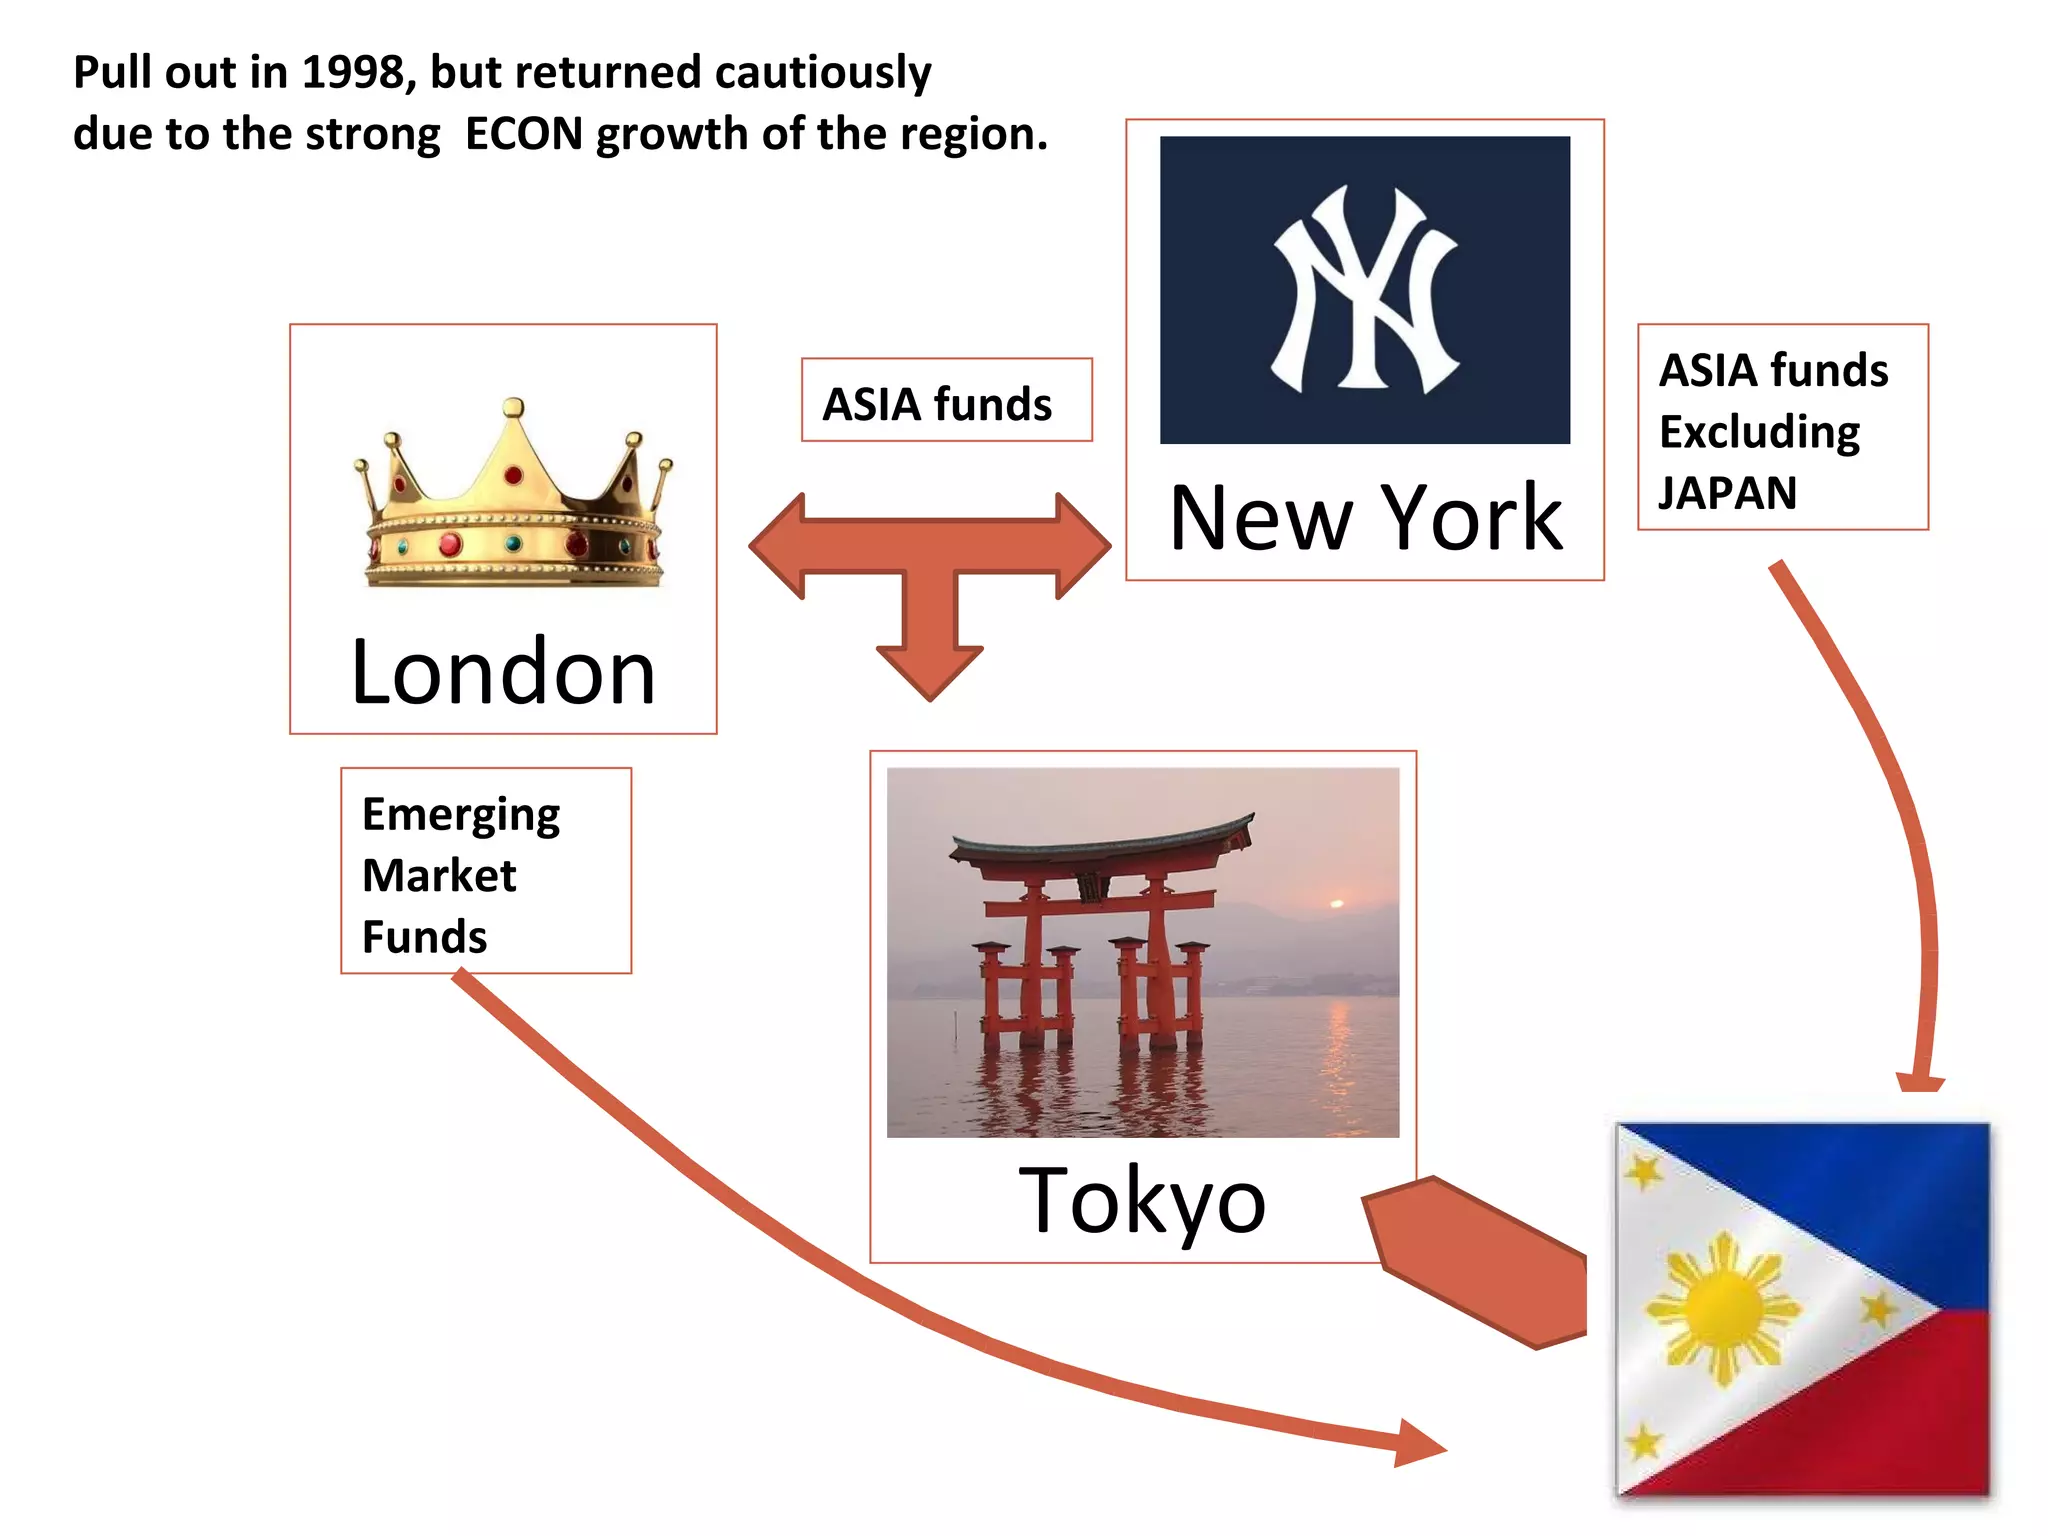
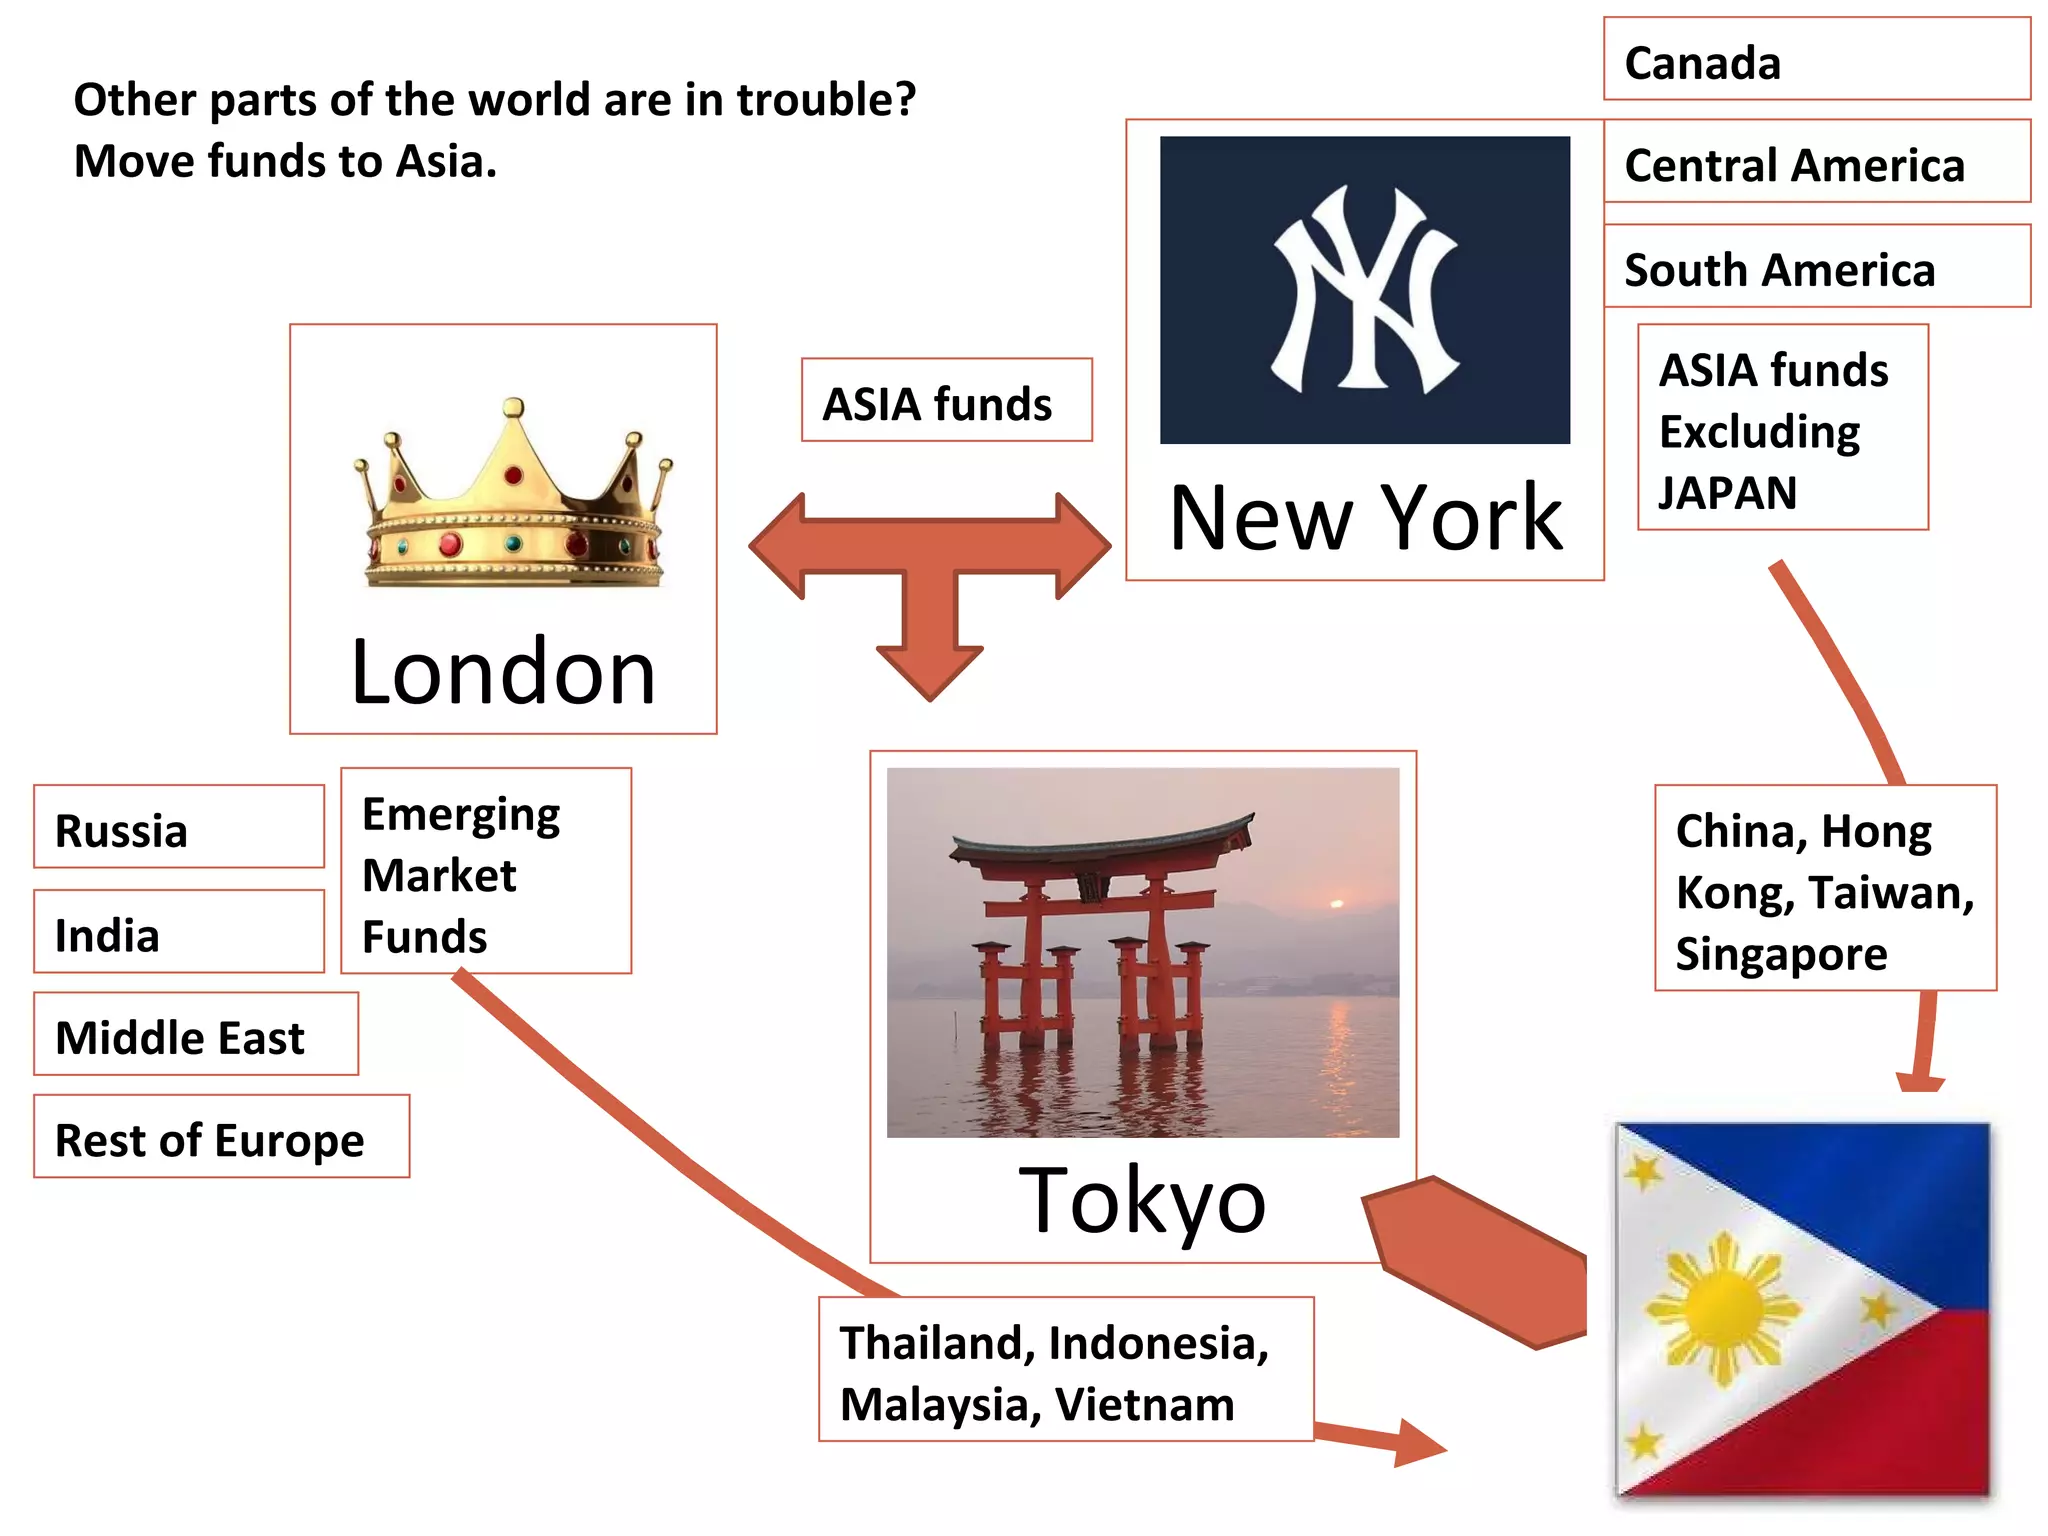
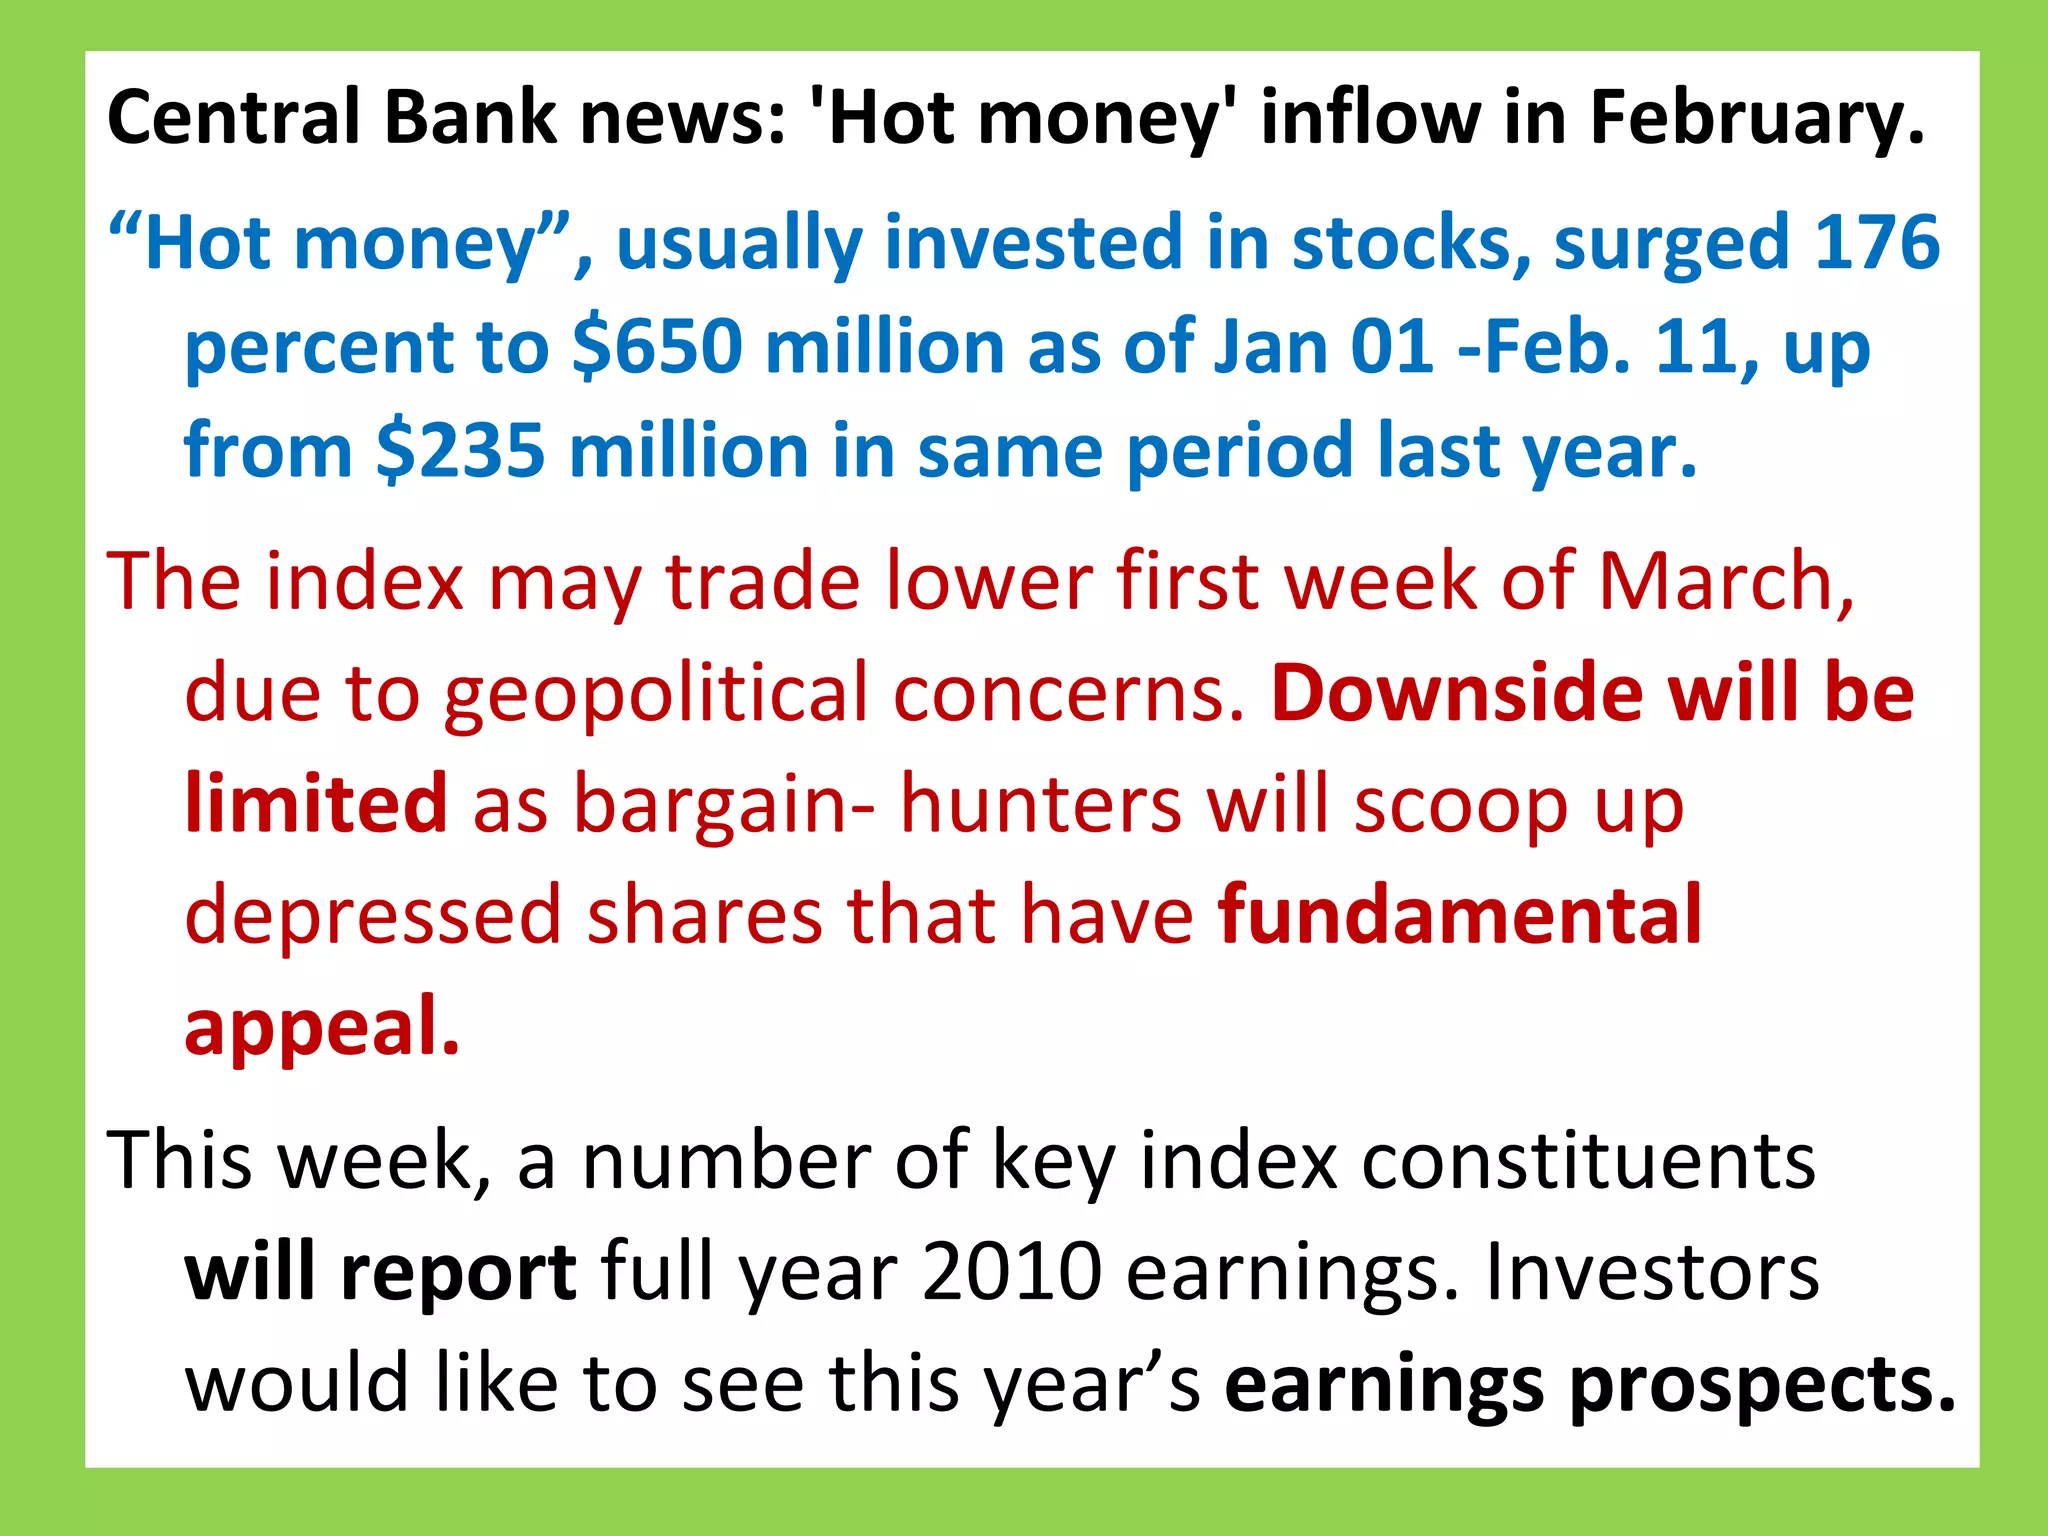
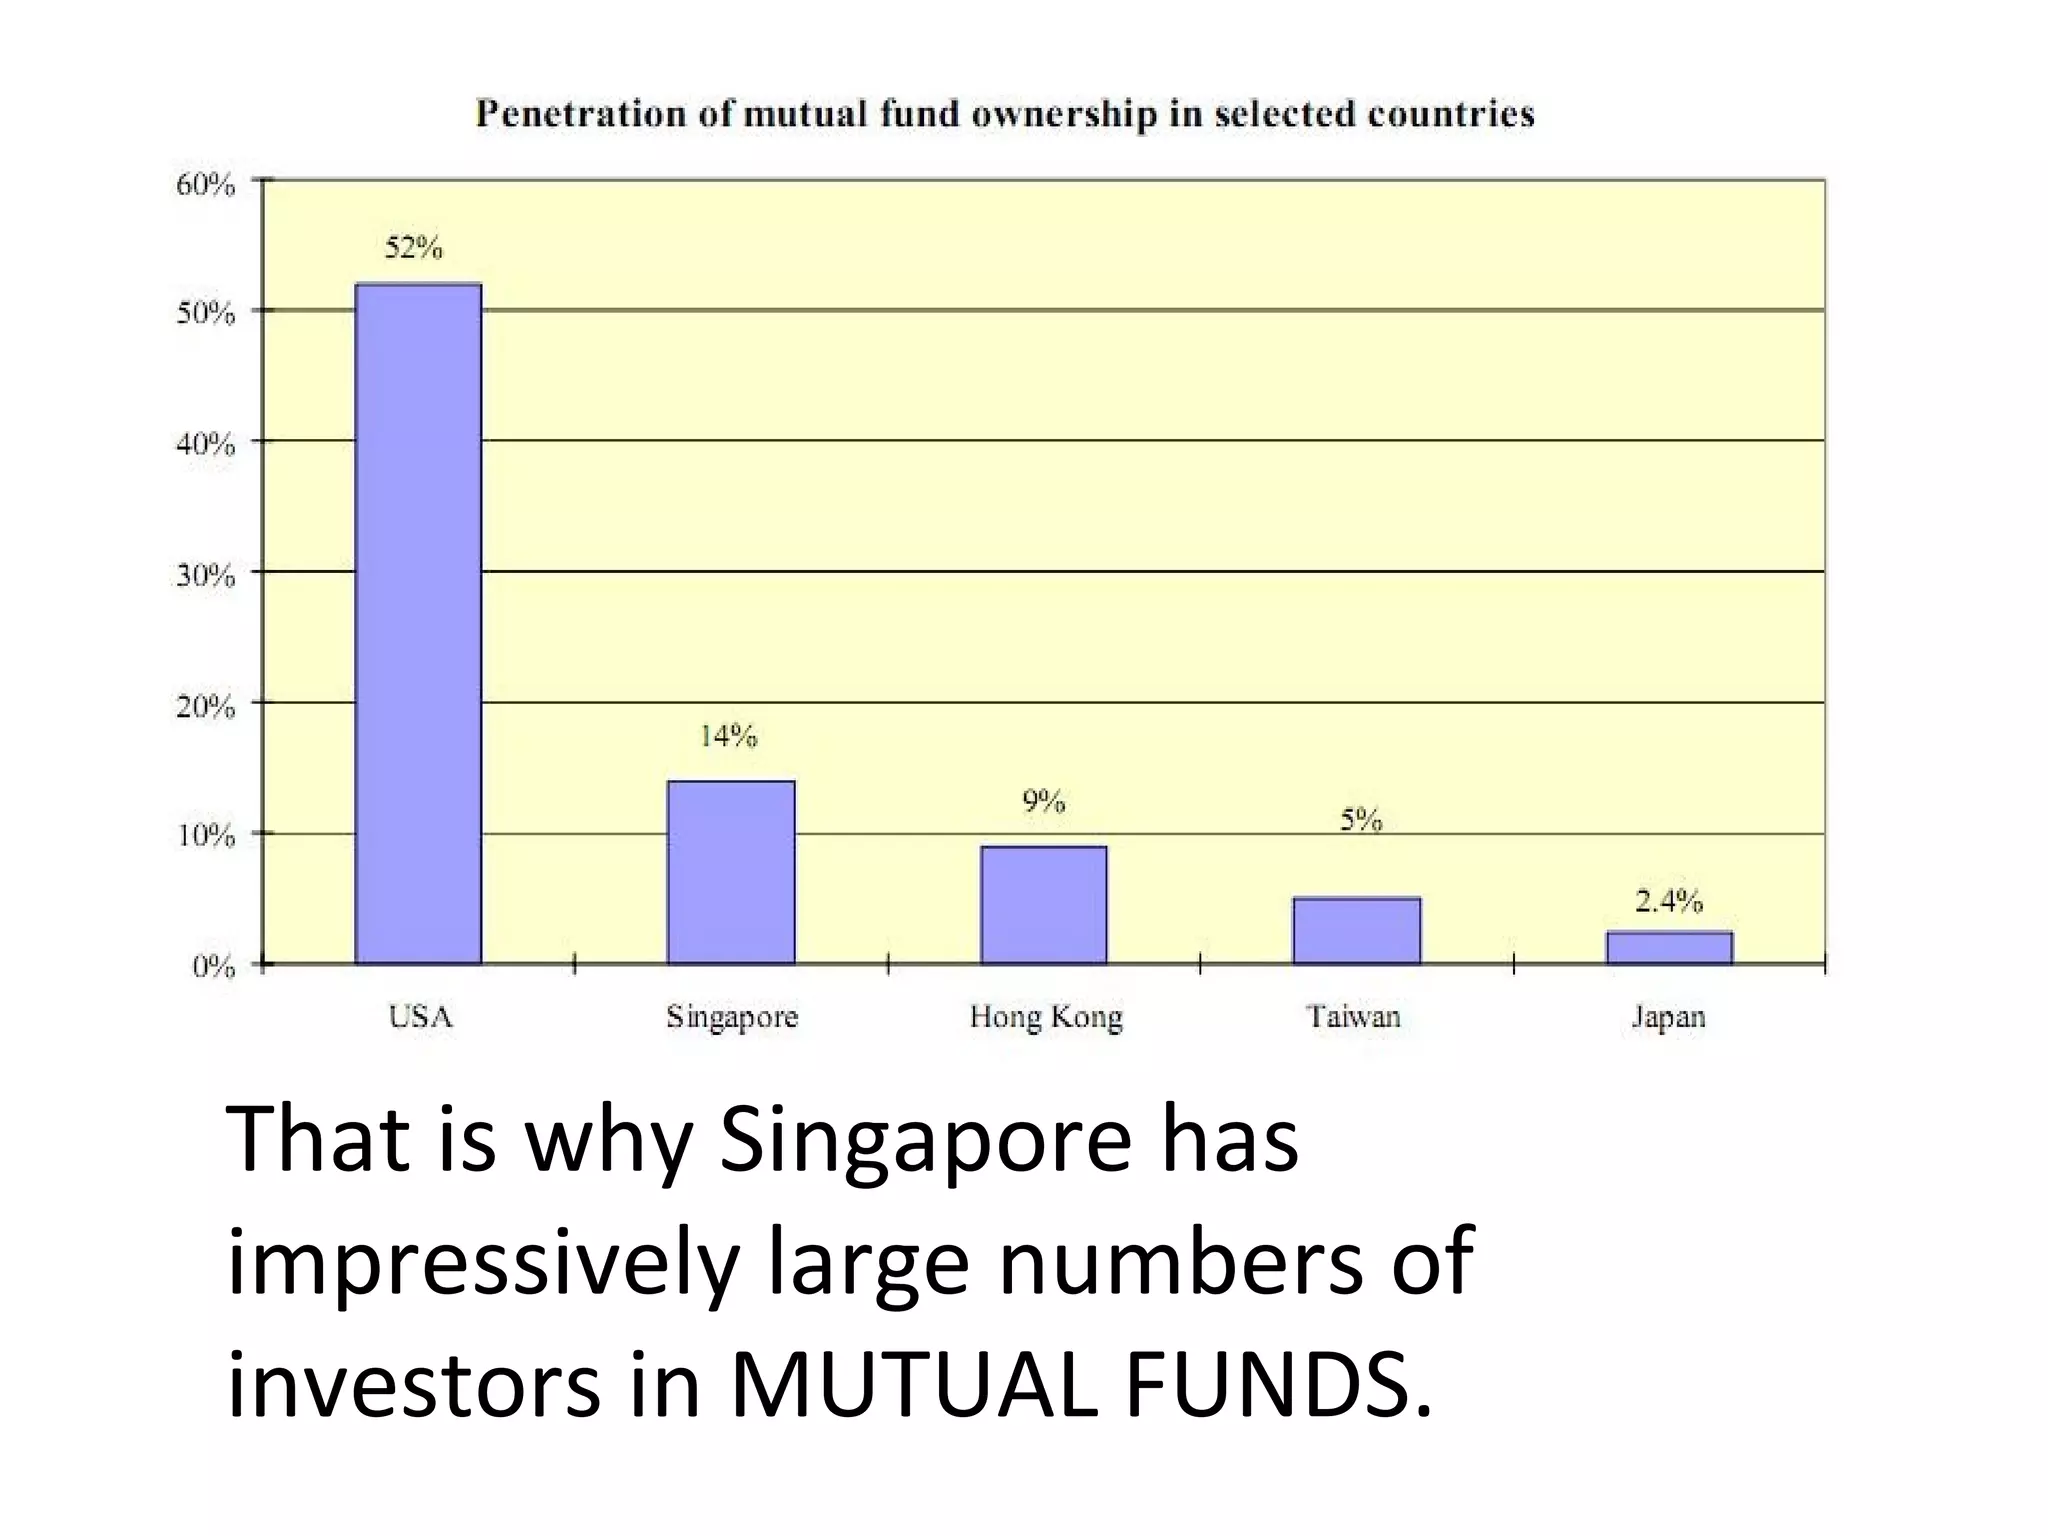
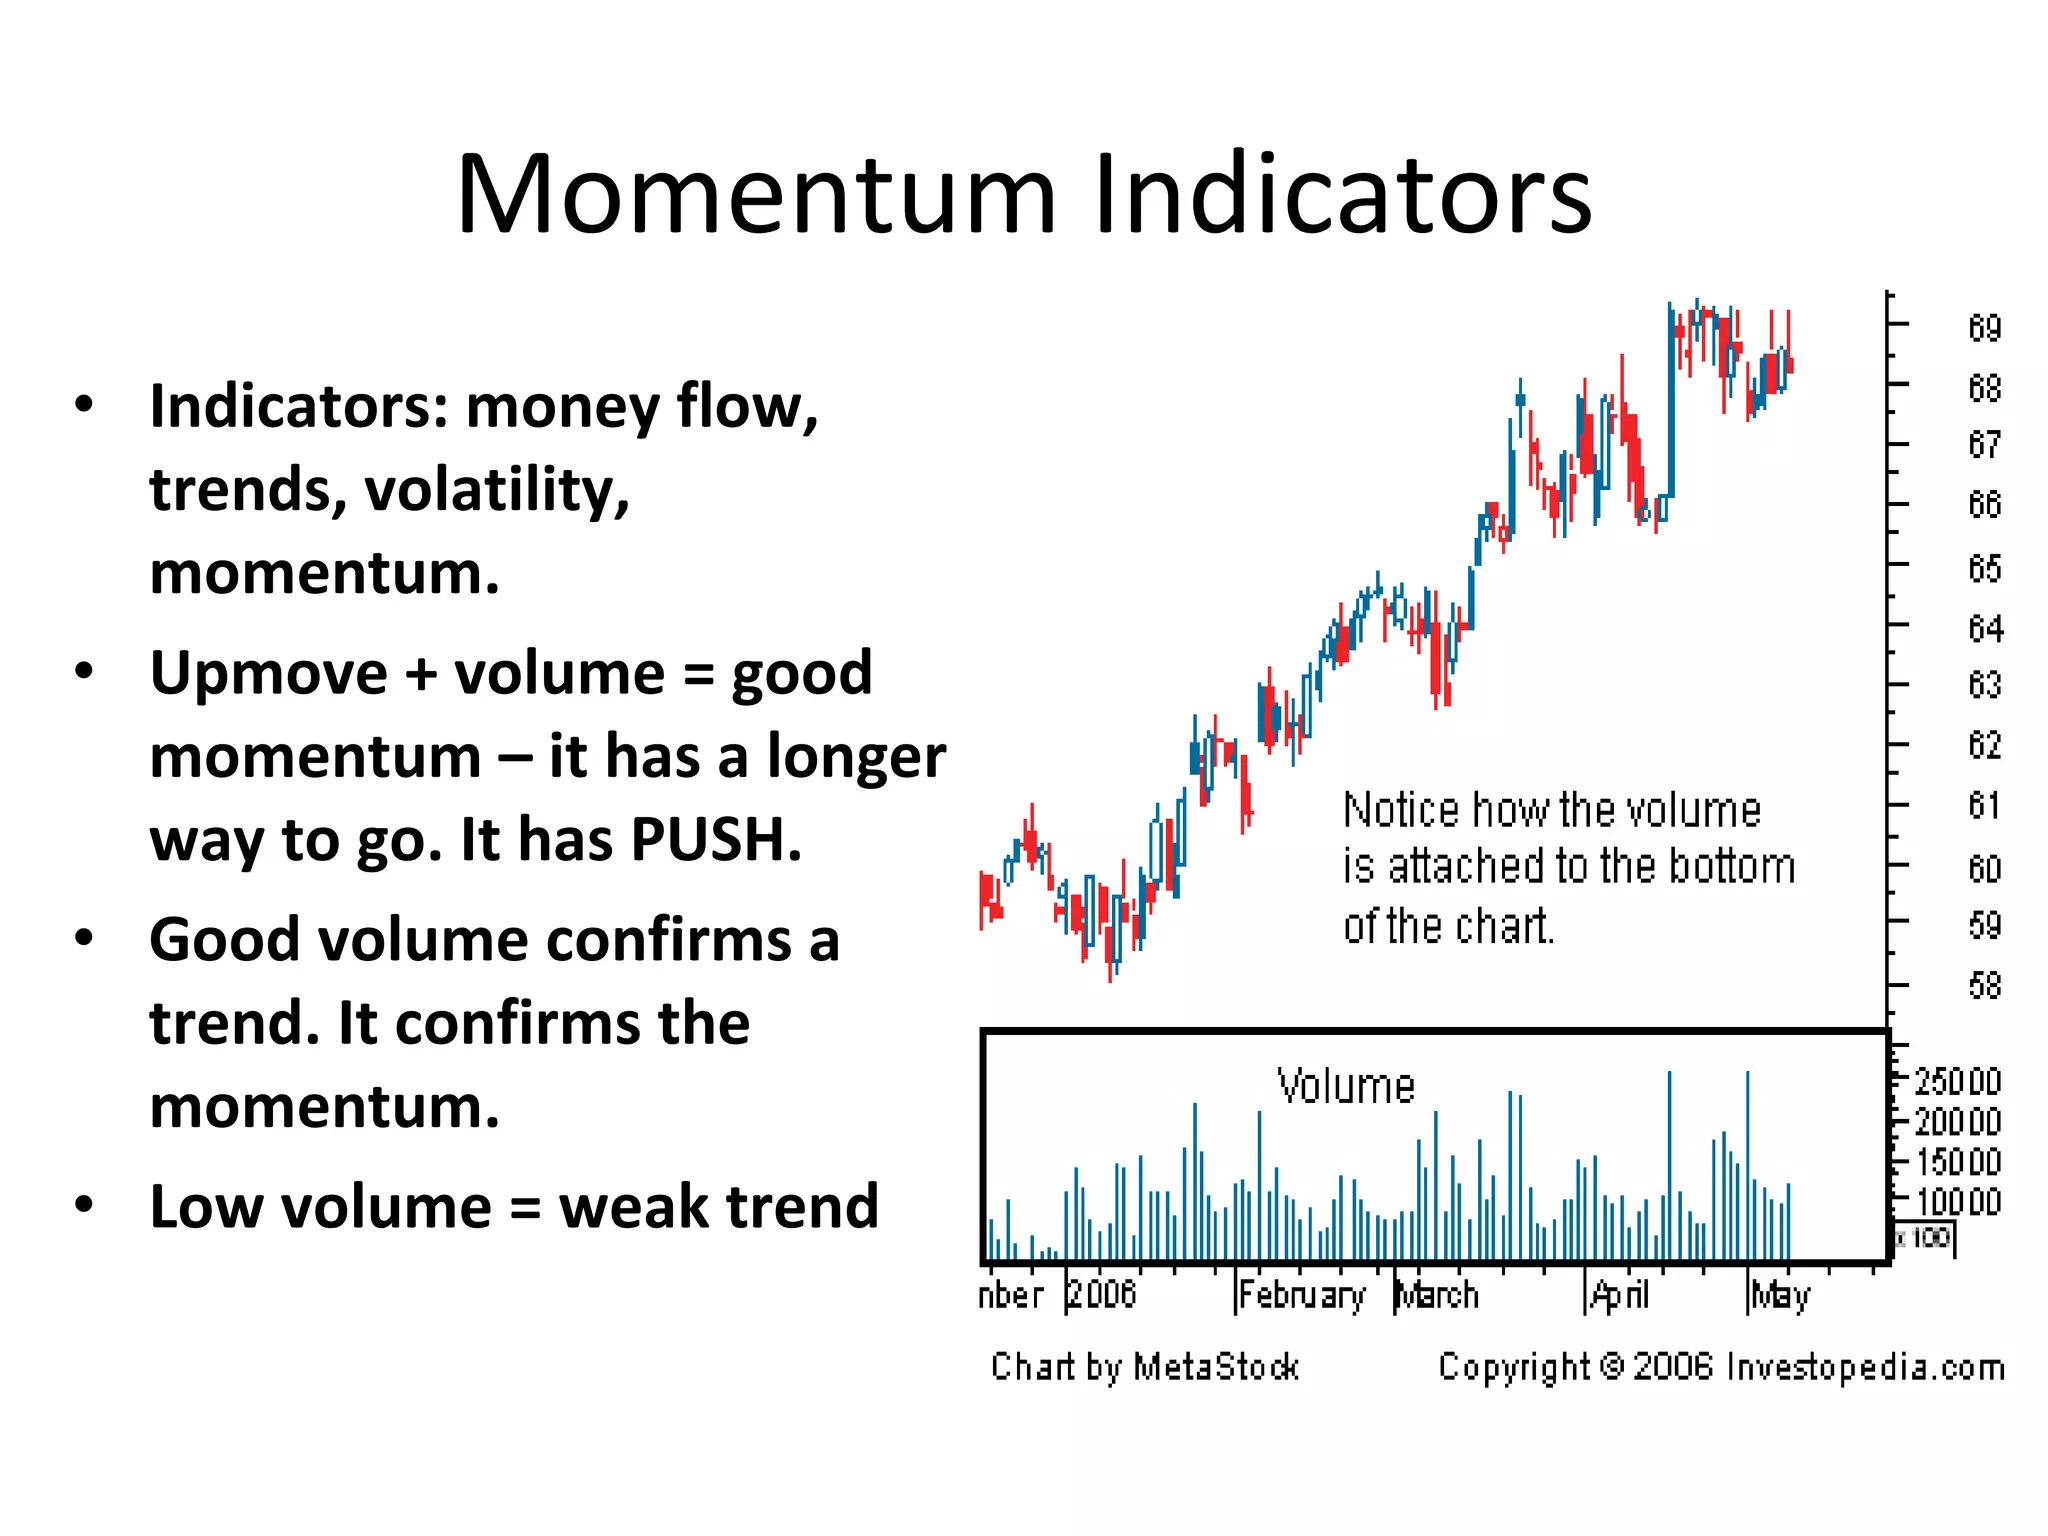
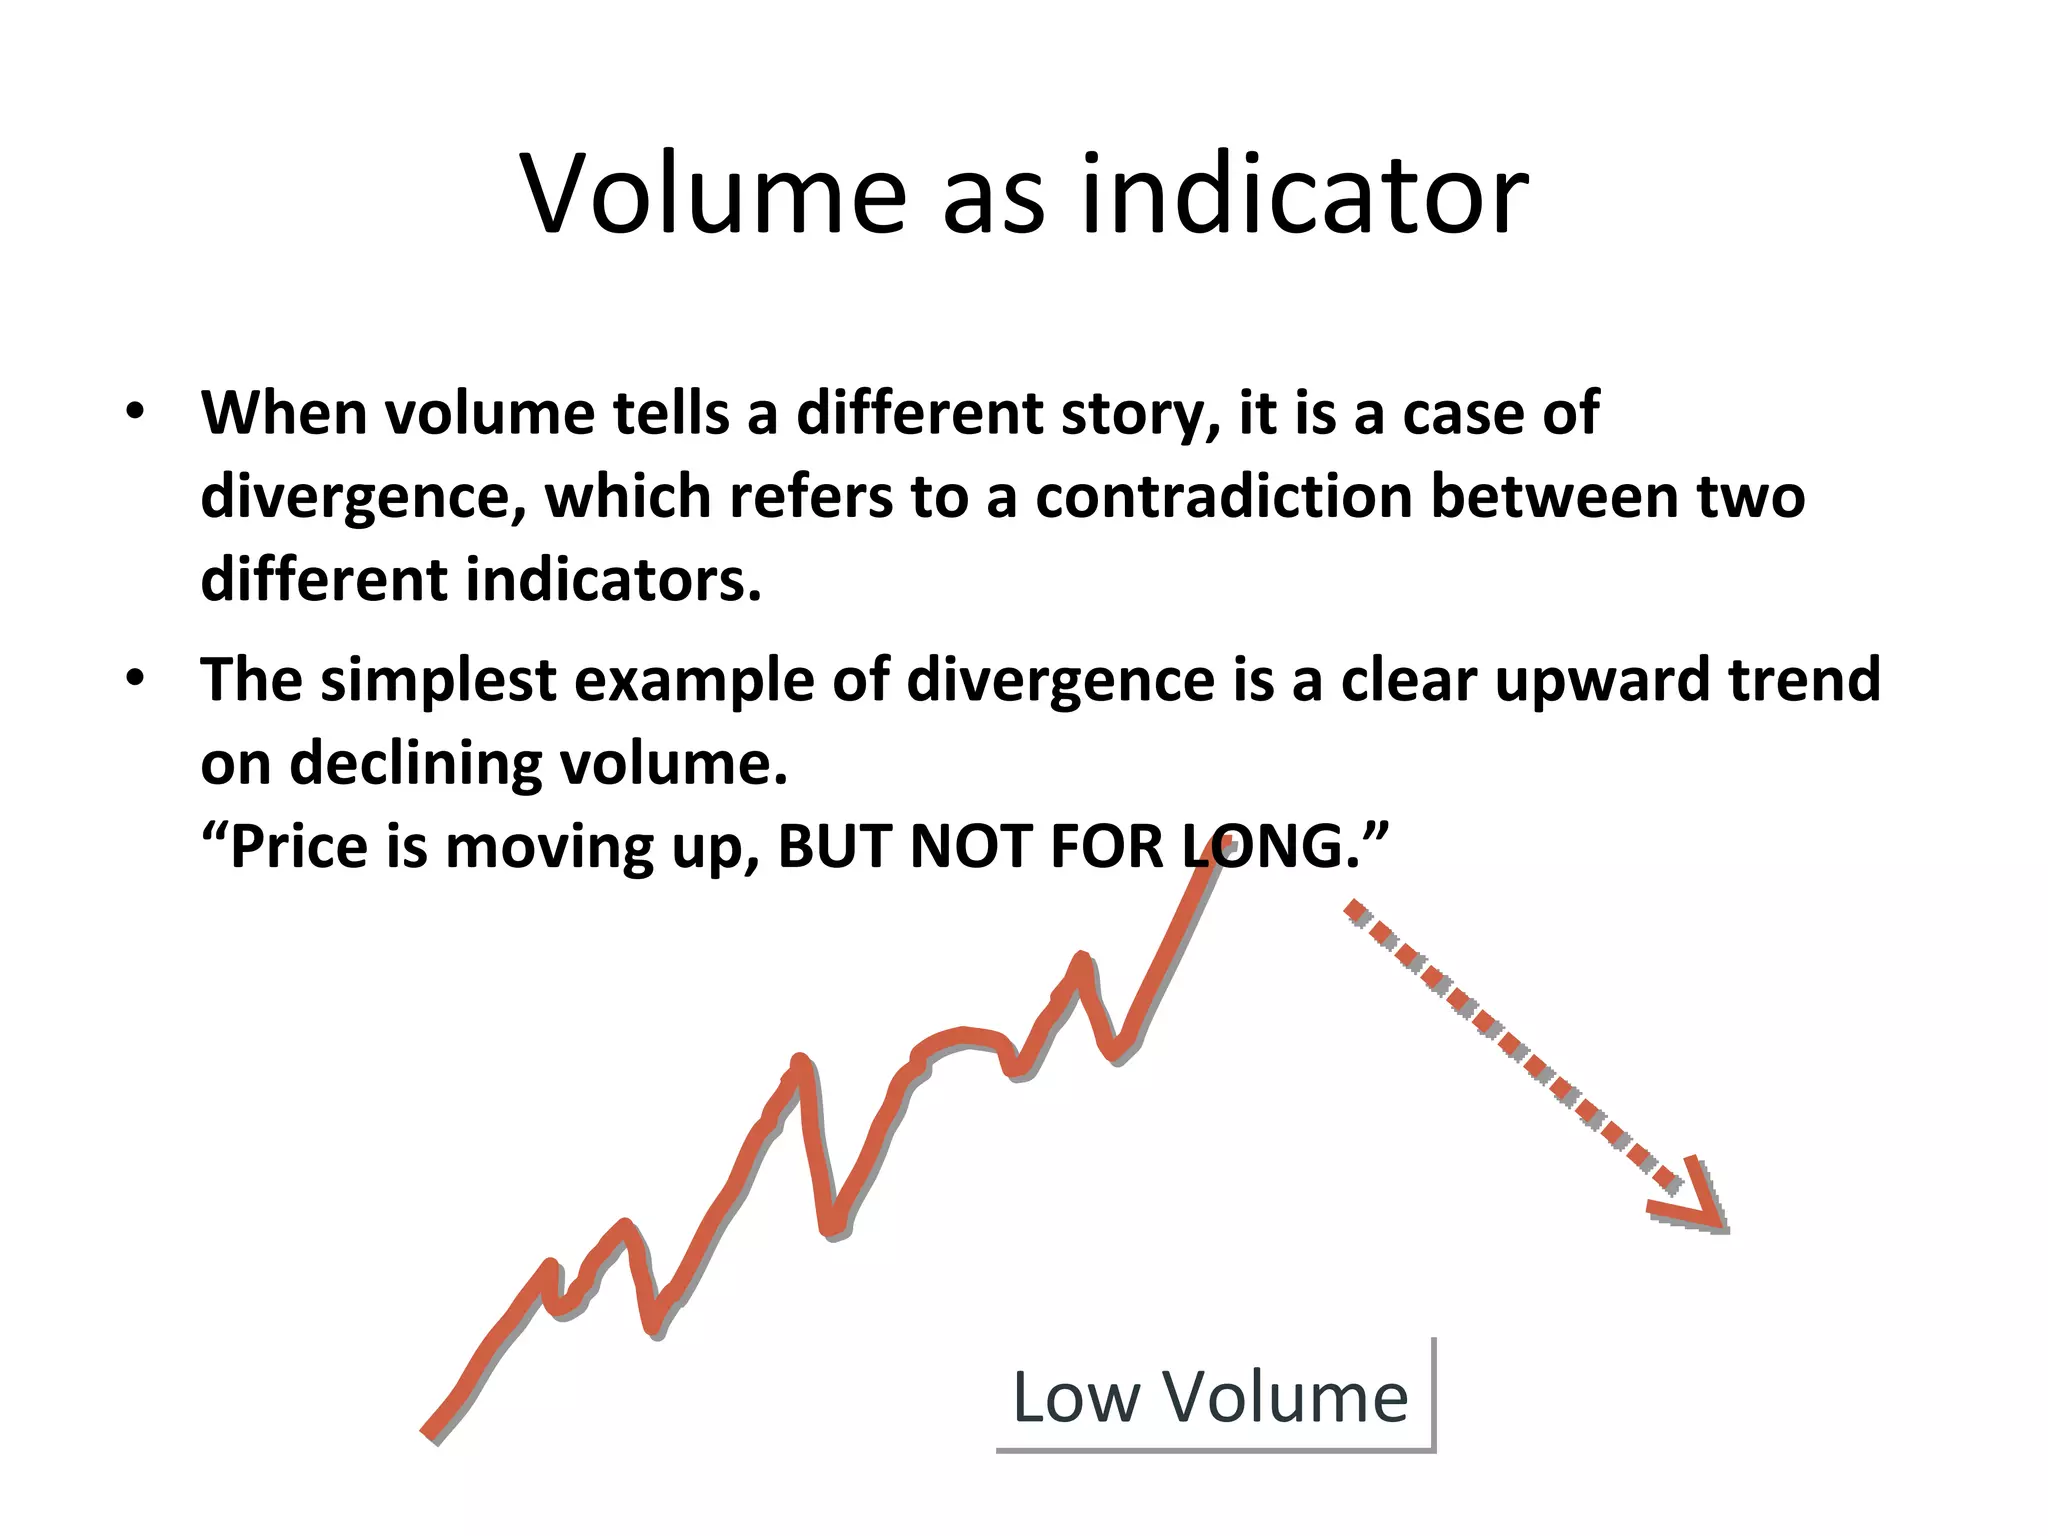
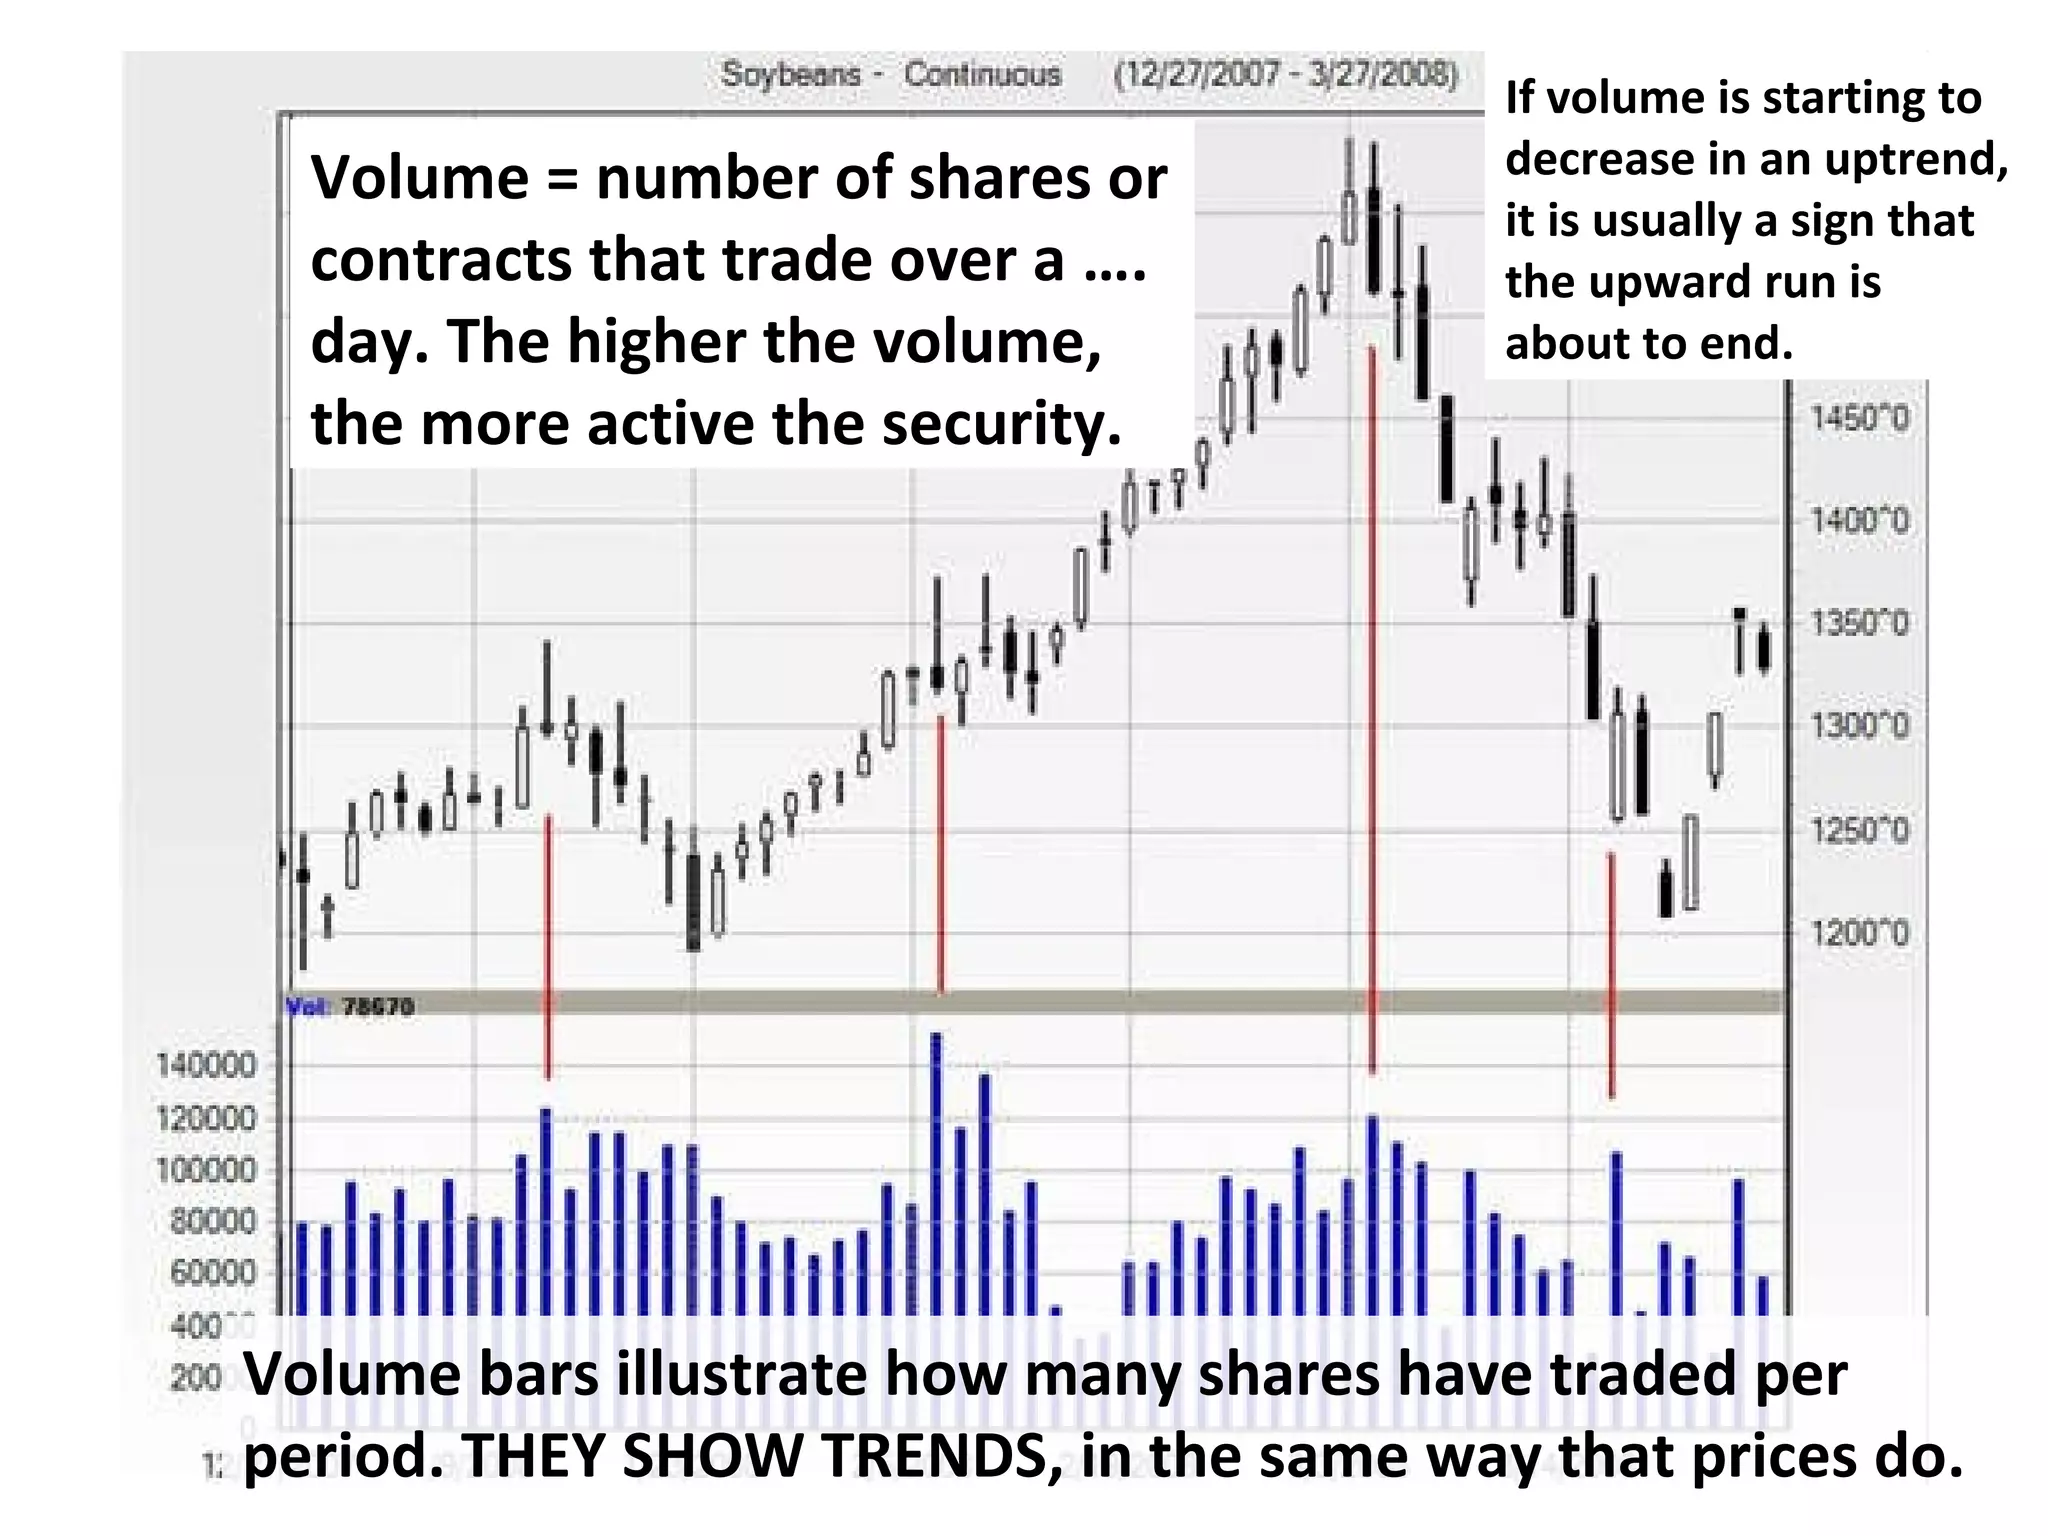
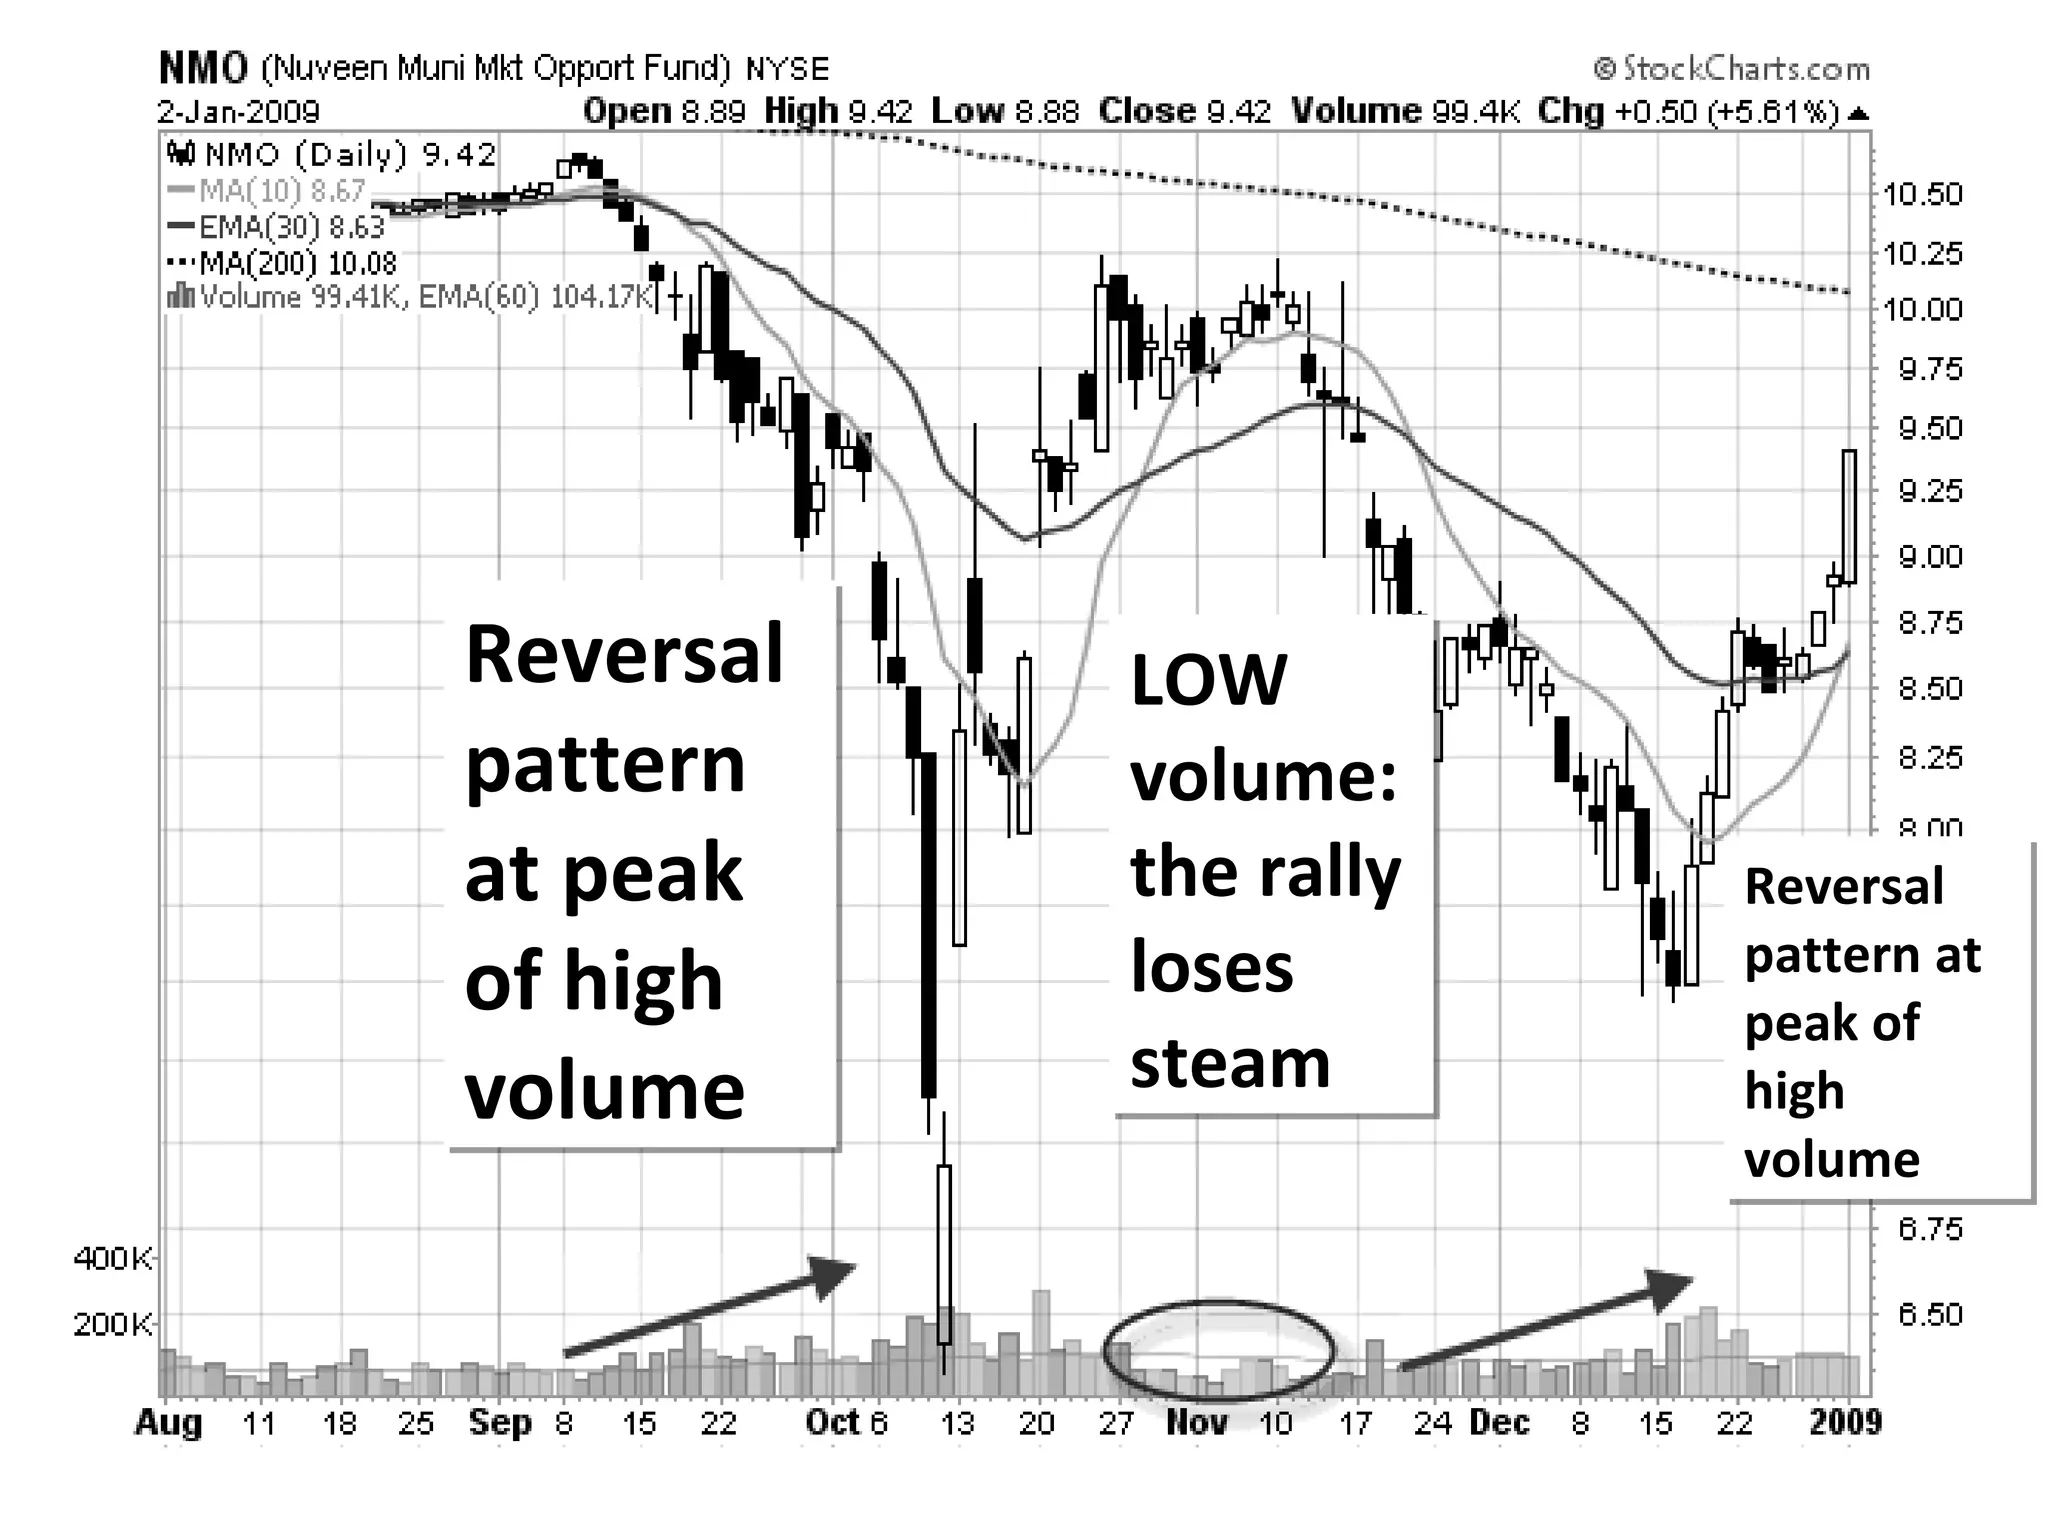
Volume & Liquidity … as Measures of INVESTOR SENTIMENT. Theme: Surviving the Market. March 2, 2011 Mark Angeles, Gus Cosio, Sandy Gilles
Hold Long-Term “ Most prudent”  method of investing.  Base Case:  6% annual economic growth 18% annual earnings growth. “ BULL market ” “ BEAR market” “ BULL market” “ BEAR market ”
Survive the “DIPS.” BE present at the “RALLY.” “ BULL market ” “ BEAR market” “ BULL market” “ BEAR market ” Keep your COOL. “ Strong Hands” If you bought at 2000 For survival:
Will the stock market keep on rising?  1. It depends: on the amount of money flowing in. 2. It depends: if the market can absorb the money. Is there money flowing in?  Can stock market absorb the money? Money will flow in, if prospects are good Are prospects good? Yes, we have good economic outlook, business conditions Yes, if only more securities get listed, traded, Listed:   More IPO’s needed.  Traded:   more “free float” in hands of public.
The flow of funds… to the stock market  … is like a river in a valley.
Build a DAM,  raise the river,  form a lake.
Water level goes up, over time. Until it overflows the dam. Build a taller Dam,  To capture more water,  Raise the level of the lake. Funds “stay  voluntarily,” in a stock market that is attractive. A DAM “traps” the Water
Feb 2009 to Feb 2011
Investors sometimes pull out cash from the stock market … To spend on household.  Jan 2007 to Feb 2011
Strong Hands = invest, and stay invested.  They can pull out anytime. But they stay.
GSIS of South Korea = $270 bn Example of “Strong Hands” = SOCIAL SECURITY SYSTEM,  GOVERNMENT SERVICE INSURANCE SYSTEM = $ 6 billion GSIS of Holland = $313 bn GSIS of Norway = $450bn GSIS  of Japan= $1,370 bn
Bigger Dam Higher  Water Level
More IPO’s Money for Stocks Free Float MORE  What assures us that the index will keep on Rising? More Water + Higher Dam MORE  MORE  More IPO
So we want to anticipate liquidity Are investors buying Philippine stocks Will they continue buying? … depends on: Are philippine stocks good to buy, for local residents? Is money flowing out of other markets? Into the Philippines?
What is the outlook for Philippine stocks Investing Buy-and-Hold.  * You could make more by frequent trading Probably the same as recent history Telecom stocks: 18% a year, for the last 18 years High Risk Low Risk Low % High % Food: 14% a year, for the last 14 years Bank stocks: 11% a year, for the last 11 years Bank Deposits: 3% Inflation:  5%
What was the history. What are the prospects? Pacific Basin Low-Risk, High Return High-risk,  Low Return Investors study the  FORECAST for this chart. Brazil, India, China Russia High-risk,  Medium -Return Japan 10  15  20  25  30  35  40  45  % Risk Rate of return % 18 16 14 12 10 8 6 Canada USA Europe Australia U.K. World
Average of 22% a year. Might go up 50% within a year,  might also suffer some  -8%  declines.  Pacific Basin Brazil, India, China Russia Expected Returns of 22% a year Risk of 30% a year Either 22+ 30 or  22 – 30 Japan 10  15  20  25  30  35  40  45  % Risk Rate of return % 18 16 14 12 10 8 6 Canada USA Europe Australia U.K. World
Money flows Tourism $ Direct Investment Portfolio Investment Gifts & Grants
The Philippines Economy Stock market BOND market Real Estate, Factories, etc INVEST- MENT
Forecast of IMF, quite positive, for a change.
Tokyo When do Philippine stocks move up? When money flows into the stockmarket. London New York LARGEST MARKET SECOND LARGEST THIRD LARGEST
Tokyo IN 1990s, strong funds flows  into Asia 1995 - 97 London New York ASIA funds
Tokyo Pull out in 1998, but returned cautiously due to the strong  ECON growth of the region. London New York ASIA funds ASIA funds Excluding JAPAN Emerging Market Funds
Tokyo Other parts of the world are in trouble? Move funds to Asia.  London New York ASIA funds ASIA funds Excluding JAPAN Emerging Market Funds Russia India Middle East Rest of Europe Central America South America Canada China, Hong Kong, Taiwan, Singapore Thailand, Indonesia, Malaysia, Vietnam
Central Bank news: 'Hot money' inflow in February.  “ Hot money”, usually invested in stocks, surged 176 percent to $650 million as of Jan 01 -Feb. 11, up from $235 million in same period last year. The index may trade lower first week of March, due to geopolitical concerns.  Downside will be limited  as bargain- hunters will scoop up depressed shares that have  fundamental appeal.  This week, a number of key index constituents  will report  full year 2010 earnings. Investors would like to see this year’s  earnings prospects.
Conventional Funds invested in the world:  71 TRN dollars = Pension funds = 28 TRN  mutual funds = 22 TRN insurance funds = 21 TRN The largest 300 pension funds collectively hold about $6 trillion in assets.
IN answer to the question:  who will do the big-time investing in stock markets
Add the alternative assets = hedge funds, private equity funds, exchange-traded funds Total funds invested = 105 TRN PHIL Economic production = $350 bn  * In terms of PPP for fair comparison.
Economic production GDP in $ bn Philippines $350bn Switzerland $354 bn  Singapore $184 bn GDP per capita / year Philippines $3700 Switzerland $45,000 Singapore $39,567
That is why Singapore has impressively large numbers of investors in MUTUAL FUNDS.
America Europe Asia Africa Middle East Australia Today
America Europe Asia Africa Middle East Australia Future
Technical analysis is the study of the price movement using the historical prices as interpolated in charts.  The main idea is to know how the price moves, to determine future price levels.  Charts: trends and patterns that can help you Technical Analysis INPUT
Logic: You can predict future prices by studying past prices, or past behavior of prices in response to certain events.  Logic:  1. The market discounts everything.  2. Price moves in trends.  3. History tends to repeat itself.  Language: Instead of talking about sales, earnings, economic growth, or cashflows, we will now talk about prices.  IT talks about … Patterns in Price charts Continuation patterns Formations Trendlines Reversal patterns  Signals Technical Analysis INPUT
Indicators: money flow, trends, volatility, momentum.  Upmove + volume = good momentum – it has a longer way to go. It has PUSH.  Good volume confirms a trend. It confirms the momentum.  Low volume = weak trend Momentum Indicators
When volume tells a different story, it is a case of divergence, which refers to a contradiction between two different indicators.  The simplest example of divergence is a clear upward trend on declining volume.  “Price is moving up, BUT NOT FOR LONG.” Volume as indicator Low Volume
Quick Surge UPWARDS. Water Spills over.  Return to Lower Level.
Volume = number of shares or contracts that trade over a …. day. The higher the volume, the more active the security.  Volume bars illustrate how many shares have traded per period. THEY SHOW TRENDS, in the same way that prices do. If volume is starting to decrease in an uptrend, it is usually a sign that the upward run is about to end. 
Reversal pattern at peak of high volume LOW  volume: the rally loses steam Reversal pattern at peak of high volume
end

D6 volume and liquidity

  • 1.
    Volume & Liquidity… as Measures of INVESTOR SENTIMENT. Theme: Surviving the Market. March 2, 2011 Mark Angeles, Gus Cosio, Sandy Gilles
  • 2.
    Hold Long-Term “Most prudent” method of investing. Base Case: 6% annual economic growth 18% annual earnings growth. “ BULL market ” “ BEAR market” “ BULL market” “ BEAR market ”
  • 3.
    Survive the “DIPS.”BE present at the “RALLY.” “ BULL market ” “ BEAR market” “ BULL market” “ BEAR market ” Keep your COOL. “ Strong Hands” If you bought at 2000 For survival:
  • 4.
    Will the stockmarket keep on rising? 1. It depends: on the amount of money flowing in. 2. It depends: if the market can absorb the money. Is there money flowing in? Can stock market absorb the money? Money will flow in, if prospects are good Are prospects good? Yes, we have good economic outlook, business conditions Yes, if only more securities get listed, traded, Listed: More IPO’s needed. Traded: more “free float” in hands of public.
  • 5.
    The flow offunds… to the stock market … is like a river in a valley.
  • 6.
    Build a DAM, raise the river, form a lake.
  • 7.
    Water level goesup, over time. Until it overflows the dam. Build a taller Dam, To capture more water, Raise the level of the lake. Funds “stay voluntarily,” in a stock market that is attractive. A DAM “traps” the Water
  • 8.
    Feb 2009 toFeb 2011
  • 9.
    Investors sometimes pullout cash from the stock market … To spend on household. Jan 2007 to Feb 2011
  • 10.
    Strong Hands =invest, and stay invested. They can pull out anytime. But they stay.
  • 11.
    GSIS of SouthKorea = $270 bn Example of “Strong Hands” = SOCIAL SECURITY SYSTEM, GOVERNMENT SERVICE INSURANCE SYSTEM = $ 6 billion GSIS of Holland = $313 bn GSIS of Norway = $450bn GSIS of Japan= $1,370 bn
  • 12.
    Bigger Dam Higher Water Level
  • 13.
    More IPO’s Moneyfor Stocks Free Float MORE What assures us that the index will keep on Rising? More Water + Higher Dam MORE MORE More IPO
  • 14.
    So we wantto anticipate liquidity Are investors buying Philippine stocks Will they continue buying? … depends on: Are philippine stocks good to buy, for local residents? Is money flowing out of other markets? Into the Philippines?
  • 15.
    What is theoutlook for Philippine stocks Investing Buy-and-Hold. * You could make more by frequent trading Probably the same as recent history Telecom stocks: 18% a year, for the last 18 years High Risk Low Risk Low % High % Food: 14% a year, for the last 14 years Bank stocks: 11% a year, for the last 11 years Bank Deposits: 3% Inflation: 5%
  • 16.
    What was thehistory. What are the prospects? Pacific Basin Low-Risk, High Return High-risk, Low Return Investors study the FORECAST for this chart. Brazil, India, China Russia High-risk, Medium -Return Japan 10 15 20 25 30 35 40 45 % Risk Rate of return % 18 16 14 12 10 8 6 Canada USA Europe Australia U.K. World
  • 17.
    Average of 22%a year. Might go up 50% within a year, might also suffer some -8% declines. Pacific Basin Brazil, India, China Russia Expected Returns of 22% a year Risk of 30% a year Either 22+ 30 or 22 – 30 Japan 10 15 20 25 30 35 40 45 % Risk Rate of return % 18 16 14 12 10 8 6 Canada USA Europe Australia U.K. World
  • 18.
    Money flows Tourism$ Direct Investment Portfolio Investment Gifts & Grants
  • 19.
    The Philippines EconomyStock market BOND market Real Estate, Factories, etc INVEST- MENT
  • 20.
    Forecast of IMF,quite positive, for a change.
  • 21.
    Tokyo When doPhilippine stocks move up? When money flows into the stockmarket. London New York LARGEST MARKET SECOND LARGEST THIRD LARGEST
  • 22.
    Tokyo IN 1990s,strong funds flows into Asia 1995 - 97 London New York ASIA funds
  • 23.
    Tokyo Pull outin 1998, but returned cautiously due to the strong ECON growth of the region. London New York ASIA funds ASIA funds Excluding JAPAN Emerging Market Funds
  • 24.
    Tokyo Other partsof the world are in trouble? Move funds to Asia. London New York ASIA funds ASIA funds Excluding JAPAN Emerging Market Funds Russia India Middle East Rest of Europe Central America South America Canada China, Hong Kong, Taiwan, Singapore Thailand, Indonesia, Malaysia, Vietnam
  • 25.
    Central Bank news:'Hot money' inflow in February. “ Hot money”, usually invested in stocks, surged 176 percent to $650 million as of Jan 01 -Feb. 11, up from $235 million in same period last year. The index may trade lower first week of March, due to geopolitical concerns. Downside will be limited as bargain- hunters will scoop up depressed shares that have fundamental appeal. This week, a number of key index constituents will report full year 2010 earnings. Investors would like to see this year’s earnings prospects.
  • 26.
    Conventional Funds investedin the world: 71 TRN dollars = Pension funds = 28 TRN mutual funds = 22 TRN insurance funds = 21 TRN The largest 300 pension funds collectively hold about $6 trillion in assets.
  • 27.
    IN answer tothe question: who will do the big-time investing in stock markets
  • 28.
    Add the alternativeassets = hedge funds, private equity funds, exchange-traded funds Total funds invested = 105 TRN PHIL Economic production = $350 bn * In terms of PPP for fair comparison.
  • 29.
    Economic production GDPin $ bn Philippines $350bn Switzerland $354 bn Singapore $184 bn GDP per capita / year Philippines $3700 Switzerland $45,000 Singapore $39,567
  • 30.
    That is whySingapore has impressively large numbers of investors in MUTUAL FUNDS.
  • 31.
    America Europe AsiaAfrica Middle East Australia Today
  • 32.
    America Europe AsiaAfrica Middle East Australia Future
  • 33.
    Technical analysis isthe study of the price movement using the historical prices as interpolated in charts. The main idea is to know how the price moves, to determine future price levels. Charts: trends and patterns that can help you Technical Analysis INPUT
  • 34.
    Logic: You canpredict future prices by studying past prices, or past behavior of prices in response to certain events. Logic: 1. The market discounts everything. 2. Price moves in trends. 3. History tends to repeat itself. Language: Instead of talking about sales, earnings, economic growth, or cashflows, we will now talk about prices. IT talks about … Patterns in Price charts Continuation patterns Formations Trendlines Reversal patterns Signals Technical Analysis INPUT
  • 35.
    Indicators: money flow,trends, volatility, momentum. Upmove + volume = good momentum – it has a longer way to go. It has PUSH. Good volume confirms a trend. It confirms the momentum. Low volume = weak trend Momentum Indicators
  • 36.
    When volume tellsa different story, it is a case of divergence, which refers to a contradiction between two different indicators. The simplest example of divergence is a clear upward trend on declining volume. “Price is moving up, BUT NOT FOR LONG.” Volume as indicator Low Volume
  • 37.
    Quick Surge UPWARDS.Water Spills over. Return to Lower Level.
  • 38.
    Volume = numberof shares or contracts that trade over a …. day. The higher the volume, the more active the security. Volume bars illustrate how many shares have traded per period. THEY SHOW TRENDS, in the same way that prices do. If volume is starting to decrease in an uptrend, it is usually a sign that the upward run is about to end. 
  • 39.
    Reversal pattern atpeak of high volume LOW volume: the rally loses steam Reversal pattern at peak of high volume
  • 40.