Toronto Overland Flow and Basement Flooding
•Download as PPTX, PDF•
0 likes•404 views

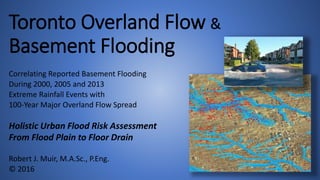
Correlating Reported Basement Flooding During 2000, 2005 and 2013 Extreme Rainfall Events with 100-Year Major Overland Flow Spread Holistic Urban Flood Risk Assessment From Flood Plain to Floor Drain Robert J. Muir, M.A.Sc., P.Eng.
Report
Share
Report
Share

Recommended
Lost Rivers & Urban Flooding, Media, Myths & Smart Mitigation - Toronto Wards...
Presentation to Toronto Ward 13's Green 13 on urban flooding and risk factors including lost rivers, urbanization and intensification, and critical review of extreme rainfall intensity trends that are decreasing in Toronto and southern Ontario based on Environment and Climate Change Canada's Engineering Climate Datasets (version 2.3). Media myths regarding flooding are exposed including the GO Train flood of July 8, 2013 that was not unprecedented but was rather a low risk flood event that has occurred frequently in the past and the insurance industry discredited claims in "Telling the Weather Story" that weather that used to happen every 40 years is happening every 6 years. The economics of green infrastructure, low impact development measures, are evaluated including representative project costs and are shown to be unaffordable for widespread implementation in Wards 13 / 14. 3D Arc Scene images of Toronto lost rivers are illustrated across the city and within the historical Wendigo Creek and Spring Creeks in Ward 12 (aka lost rivers). Variations in reported basement flood density show lower flood risk in the Ward 13 combined sewer catchment (consistent with Toronto wide trends), and show higher reported flood density in partially separated sewer catchments.
Understanding Who is AT RISK - Flood extent modelling
Understanding Flood Risk Using Surface Flood Extent Modelling. This study used ArcMap and HECRAS to evaluate flood risk exposure of River Wansbeck in Morpeth, UK.
Urban Flood Risk from Flood Plains to Floor Drains
Correlation of basement flooding with overland drainage & topographic risk factors during severe storms (Toronto, Ontario, May 12, 2000, August 19, 2005, July 8, 2013 severe storms).
Outline:
Severe Basement Flooding Events – Toronto, ON
Risk Factor Mapping
Overland Drainage (on table land, beyond regulated valley / river flood vulnerable area)
Catchment Relief (topographic slope factors)
Correlation of Observed Flooding, Flood Density and Risks
Joint Back-up and Overland Peril Considerations
De-risk Opportunities
Next Steps for Further Study
Toronto Overland Flow & Basement Flooding – ArcScene 3D Visualization of Fluv...
This document presents a 3D visualization of flood risk in Toronto that correlates reported basement flooding during extreme rainfall events in 2000, 2005, and 2013 with modeling of overland flow from a 100-year storm. It finds that 94% of reported flooding occurred beyond regulated flood plains, with structures in areas with higher predicted overland flooding being up to 3 times more likely to report basement flooding. The visualization considers fluvial, pluvial, and sewer sources of urban flood risk from flood plains to floor drains.
Flood plains to floor drains design standard adaptation for urban flood risk ...
Presented to Flood Master Class by Insurance Business Magazine this presentation examines quantitative risk assessment of riparian, overland and wastewater (sanitary) sewer system flooding. Analysis of City of Toronto and City of Markham historical flooding is shown to be highly correlated to design standard limitations related to the era of construction. Risks are shown to extend over a range of scales from floodplain (river) to flood drain (homes) based on detailed GIS spatial analysis. Flood risk mitigation measures are presented to achieve design standard adaptation in local areas with specific limitations.
4.1 runoff and floods
This document provides an overview of floods, including their causes, types, effects, and management. It discusses intrinsic and extrinsic factors that can cause flooding when thresholds are exceeded. The main causes of flooding are meteorological, hydrological, and anthropogenic factors like urbanization and deforestation. Common flood types are river floods, flash floods, coastal floods, and urban floods. Estimating floods involves past records, the Rational Method, and flood frequency studies. Design floods are selected based on their return period and probability. Prone areas in India are mapped. Flood management strategies include building on raised platforms, afforestation, forecasting, and controlling water flow with dams.
ICLR Friday Forum: Reducing flood risk in Toronto (February 2016)
ICLR held a Friday Forum workshop February 19, 2016 entitled 'Reducing flood risk in Toronto', led by David Kellershohn with Toronto Water. Urban flooding continues to drive significant losses for homeowners, municipalities and insurers across Canada. Toronto has been affected by significant urban flood events in 2000, 2005 and 2013. This presentation focused on basement flood protection work underway in Toronto.
David Kellershohn, as the Manager of Stormwater Management for the City of Toronto, is responsible for implementing the City's Wet Weather Flow Master Plan. This program includes the City's Basement Flooding Protection Program and the Coordinated Watercourse Erosion Management program. Ten year capital budget plans for these efforts exceed $1.6 billion over the next ten years.
Prior to joining the City of Toronto in 2009, David worked in the land development consulting industry for 12 years where he designed drainage systems for projects ranging from large subdivisions and large downtown condominium buildings through to small individual site designs.
David has a Bachelor's degree in Civil Engineering from the University of Waterloo and a Master's Degree in Civil Engineering from McMaster University, where he studied the water quality of Hamilton Harbour.
2011 liongson-modeling studies flood control dams-professorial chair lecture
The document summarizes hydrological modeling studies conducted to evaluate flood control dams in the Marikina River Basin in the Philippines. The studies used the SWATCH rainfall-runoff model to simulate floods from Tropical Storm Ondoy and other return periods. Flood routing studies then analyzed single dams and cascades of dams at various locations. Results showed dams could attenuate flood peaks and volumes, with the cascade alternative providing the most reduction in downstream flooding.
Midterm presentation
This document outlines a hydrologic modeling study of an untouched coastal watershed (WS80) in South Carolina. The objectives are to assess pre-development hydrologic conditions using three models and simulate runoff with varying levels of urbanization. Materials and methods include watershed delineation in GIS, modeling peak flow using WinTR-55, USGS regression equations, and the Rational Method. Preliminary results show the Rational Method produced a linear regression between peak runoff and rainfall intensity with an R^2 value of 0.88. The study aims to inform future land development and expansion of the nearby city of Charleston.
Capstone wix
This document outlines a study to model the hydrologic impacts of urban development on Watershed 80 (WS80), an untouched coastal forested watershed in South Carolina. The objectives are to assess pre-development conditions using three hydrologic models and simulate post-development conditions under varying levels of imperviousness. Materials and methods include delineating the watershed in GIS, collecting soil and rainfall data, and using the Rational Method, NRCS TR-55 model, and USGS regression equations to calculate runoff and peak flows. Preliminary results will be presented along with the design of a culvert to convey peak flows from a 100-year storm under full development.
Characterizing Change of High Frequency Return Periods in Urbanizing Southern...
Characterizing Change of High Frequency Return Periods in Urbanizing Southern...Dirk Kassenaar M.Sc. P.Eng.
Peter John Thompson University Thesis. For more information please feel free to visit our website at http://earthfx.com/Infiltration equations and index
There are three main equations that describe the shape of an infiltration capacity rate curve: Horton's equation, Phillips equation, and Holtan's equation. The infiltration capacity rate generally decreases over time from an initial maximum rate to a minimum steady rate. The infiltration index and W-index provide a constant infiltration rate for calculating runoff. The W-index is more accurate than the infiltration index because it excludes depression and interception losses. Both indices are commonly used to estimate flood magnitudes from critical storms.
ICLR Friday Forum: Sea level rise vulnerability assessments (February 22, 2019)
CLR hosted a Friday Forum webinar on February 22 titled 'Robust impact patterns: an approach to account for uncertainties in local sea-level rise vulnerability assessments', led by Jackie Yip of University of British Columbia.
While sea-level rise (SLR) is an inevitable effect of climate change, there are deep uncertainties regarding when and how SLR can impact society, which act as a significant barrier to adaptation. Recent literature calls for a shift from seeking optimal adaptation options to robust options that can perform reasonably under a range of possible futures, embracing uncertainties rather than eliminating them.
In response, this study develops a new approach, the Robust Impact Patterns (RIPs) method, to help decision-makers account for SLR impact uncertainties in adaptation planning. The method utilizes the pattern recognition capability of machine learning to transform thousands of local SLR impact maps into a small number of impact patterns that are robust across multiple futures, thereby processing an otherwise vast and overwhelming volume of impact information.
Jackie Yip is a Consequence Analyst at Kerr Wood Leidal, with experience in a range of climate vulnerability and resilience projects. Before joining KWL, she completed her Ph.D. at the Institute for Resources, Environment, and Sustainability of UBC, where she conducted this presentation’s research in partnership with the City of Vancouver. At the organizational level, Jackie was also a technical lead at Fraser Health, where her work focused on improving the resilience of healthcare facilities in the Lower Mainland to extreme events, including flooding and extreme heat. More broadly, she has led the design of Resilient-C, an online platform connecting Canadian coastal municipalities to share knowledge and collaborate on reducing risks to coastal hazards.
Hampton-Rds-MATS-Poster-2
This document outlines future work on assessing the impact of climate change and sea level rise on stormwater infrastructure in the Hampton Roads region of Virginia. The work has two main objectives: 1) Update design storms based on climate projections to account for increased storm intensity, duration and frequency. 2) Perform hydrologic and hydraulic modeling to identify vulnerable transportation infrastructure considering factors like sea level rise causing backups in storm sewers. The results will help local planners prioritize flood mitigation efforts.
INFILTRATION PPT
This document presents information on infiltration, the process by which water enters soil. It discusses factors that affect infiltration rate like soil properties and moisture levels. Four zones within soil during infiltration are identified: saturated, transmission, wetting, and wetting front. Common infiltration measurement methods like Horton and Philip's models as well as the Green-Ampt model are summarized. The Green-Ampt model provides a solution for calculating infiltration rate over time based on soil properties like conductivity, porosity, and wetting front suction head. An example calculation using the Green-Ampt model is also included.
Stormwater Asset Management Using Gis V5
The document summarizes a study conducted in Somerville, Massachusetts to develop a stormwater asset management system using GIS. Key findings include:
- Tree cover ranges from 9.6-30.5% across Somerville neighborhoods and provides an estimated $8.6 million in annual stormwater savings.
- Trees reduce runoff volumes by 40%, peak flows by 40%, and time of concentration by 20% on average.
- The system helps identify priority areas for stormwater management and potential water quality benefits of future BMP investments.
Short Version of Wet Area Mapping CANNOR
This document discusses four planning tools for wet area mapping and geoscience innovation: Flood, Locate, Trail, and Spill. Flood delineates likely flood extent. Locate ranks hydrological infrastructure by flow accommodation capacity. Trail optimizes trail and linear project routing. Spill tracks the likely path of waterborne contaminants. The tools are supported by a knowledge base and aim to further economic activities while managing uncertainty and supporting flood management strategies like reducing flow rates and restricting developments.
URBAN FLOOD - ISG 2014
This document discusses urban flood modeling that was conducted for Guwahati, India. It provides the following key details:
1. Urban flood modeling was conducted using hydrological modeling to compute flood hydrographs and hydraulic modeling to simulate flood inundation. Ground surveys were also conducted to develop flood hazard maps.
2. Modeling of past flood events in Guwahati showed floods occurring with daily rainfall peaks of 80-400mm. Specific zones like Rajgarh and Anil Nagar regularly experience flooding.
3. The modeling aims to establish flood thresholds to develop an urban flood forecasting system using radar rainfall estimates and hydrological modeling outputs. The end goal is early flood warning for disaster preparedness.
Interception and Depression Storage
This document discusses the process of interception, where precipitation is retained on vegetation like leaves and grass before evaporating. Around 10-20% of annual precipitation is typically intercepted by vegetation. Interception losses are especially high under dense forest stands, which can intercept up to 25% of annual precipitation. The factors that determine interception include storm characteristics, type of prevailing plants and trees, and season. Interception is an important consideration in hydrologic modeling depending on the time frame and volume of precipitation being analyzed.
Computation of Runoff
1. Distribution of Runoff
2. Hydrograph Analysis
a) Hydrograph & Unit Hydrograph
b) S - Hydrograph & Synthetic Unit Hydrograph
3. Computation of Design Discharge
a) Rational Formulae
b) SCS Curve Number Method
4. Flood Frequency Analysis
5. Flood Routing
poster
The document summarizes a study analyzing the adoption of green stormwater infrastructure (GSI) in Tucson, Arizona over the last decade. The key findings are:
1) On average, Tucson sub-watersheds have a GSI adoption rate of 4.7% of treated acreage and 5.8% of treated parcels, indicating room for further implementation.
2) The watersheds with the highest GSI treatment tend to be smaller and closer to urban areas, likely due to higher resident interest and more advocacy.
3) Certain watersheds have met or are approaching a goal of 10-25% GSI adoption, which modeling suggests could significantly reduce stormwater flooding and pollution.
Integrated hydro-geological risk for Mallero basin (Alpine Italy) – part 2: h...
Presentation of project in the course " Hydro-Geological Risks in Mountain Area (Hydraulic Assessment Part)" for M.Sc. "Civil Engineering for Risk Mitigation" at Politecnico di Milano.
Submitted by:
Maryam Izadifar, Alireza Babaee, Budiwan Adi Tirta, Ahmed Hassan El-Banna
Submitted to:
Professor Alessio Radice
Integrated hydro-geological risk for Mallero basin (Alpine Italy) – part 1: g...
Presentation of project in the course " Hydro-Geological Risks in Mountain Area (Geological Assessment Part)" for M.Sc. "Civil Engineering for Risk Mitigation" at Politecnico di Milano.
Submitted by:
Maryam Izadifar, Alireza Babaee
Submitted to:
Professor Laura Longoni
Infiltration.
This document provides an overview of infiltration including:
1. It defines infiltration as the process by which precipitation moves downward through the surface of the earth, replenishing soil moisture and recharging aquifers.
2. It describes the four soil moisture zones during infiltration - saturated, transmission, wetting, and wetting front.
3. It discusses factors that affect infiltration like soil characteristics, moisture content, vegetation cover, and rainfall intensity.
4. It outlines methods to measure infiltration including single and double ring infiltrometers, rainfall simulators, and hydrograph analysis.
5. It presents several common models to estimate infiltration rates, including Horton's infiltration model and the Green-
L6 infiltrationr rate calculation
This document discusses infiltration rate and equations. It defines infiltration rate as the speed at which water enters soil and describes common methods to measure or calculate it over time. These include Horton's equation, Phillips equation, Kostiakov equation, and Holtan's equation. It also introduces the concepts of cumulative infiltration and infiltration capacity curves. Finally, it discusses infiltration indices like the phi index and W index, which provide average infiltration rates for estimating runoff from storms.
Infiltration
The document discusses infiltration rate, which is the rate at which water enters soil. Infiltration rate depends on soil type and properties, with sand having the highest rate of more than 30 mm/hour and clay the lowest of 1-5 mm/hour. The rate starts high as water replaces air in pores (initial rate) and declines over time to a steady constant rate. Common methods to measure infiltration rate include using a ring infiltrometer. The document also presents equations like Kostiakov and Horton to model infiltration rate over time.
Characterizing Change in Baseflow Interactions with Urbanization Through Even...
Characterizing Change in Baseflow Interactions with Urbanization Through Even...Dirk Kassenaar M.Sc. P.Eng.
The document analyzed trends in streamflow characteristics across 15 urbanizing catchments in southern Ontario between 1969 and 2010. Key findings included increasing peak discharges, total volumes, and flashiness with urbanization. Event durations and times to peak generally decreased. Hydrograph separation showed increasing volumes of quick flow and interflow runoff. The study utilized high-resolution streamflow data and hydrograph analysis tools to characterize changes in watershed response due to urban development.L7 hydrograph
This document discusses hydrographs and the factors that influence them. It defines a hydrograph as a graphical representation of discharge over time at a particular point in a river. It also defines components of the hydrograph like the rising and falling limbs. Additionally, it discusses how watershed characteristics such as area, slope, rock type, soil, land use and precipitation patterns can impact the shape of the hydrograph. Specifically, steeper slopes and impermeable surfaces can produce a steeper rising limb while permeable soils and rocks or forested land can result in a more gradual rising limb.
WASTEWATER COLLECTION SYSTEM PERFORMANCE UNDER CLIMATE CHANGE – SAFETY FACTOR...
Water Environment Association of Ontario
Annual Conference 2018
Lijing Xu, M.A.Sc., P.Eng., LEED AP, Robert J Muir, M.A.Sc., P.Eng.
City of Markham
April 17, 2018
This is the presentation of the paper findings: https://drive.google.com/open?id=15pc52qgbwOasSP5O1YU2GgEQLfqkjwbW
New York City Case Study
Prof Ni-Bin Chang presented the background review of New York City case study.
Flood impact assessment in mega cities under urban sprawl and climate change kick-off workshop
More Related Content
What's hot
Midterm presentation
This document outlines a hydrologic modeling study of an untouched coastal watershed (WS80) in South Carolina. The objectives are to assess pre-development hydrologic conditions using three models and simulate runoff with varying levels of urbanization. Materials and methods include watershed delineation in GIS, modeling peak flow using WinTR-55, USGS regression equations, and the Rational Method. Preliminary results show the Rational Method produced a linear regression between peak runoff and rainfall intensity with an R^2 value of 0.88. The study aims to inform future land development and expansion of the nearby city of Charleston.
Capstone wix
This document outlines a study to model the hydrologic impacts of urban development on Watershed 80 (WS80), an untouched coastal forested watershed in South Carolina. The objectives are to assess pre-development conditions using three hydrologic models and simulate post-development conditions under varying levels of imperviousness. Materials and methods include delineating the watershed in GIS, collecting soil and rainfall data, and using the Rational Method, NRCS TR-55 model, and USGS regression equations to calculate runoff and peak flows. Preliminary results will be presented along with the design of a culvert to convey peak flows from a 100-year storm under full development.
Characterizing Change of High Frequency Return Periods in Urbanizing Southern...
Characterizing Change of High Frequency Return Periods in Urbanizing Southern...Dirk Kassenaar M.Sc. P.Eng.
Peter John Thompson University Thesis. For more information please feel free to visit our website at http://earthfx.com/Infiltration equations and index
There are three main equations that describe the shape of an infiltration capacity rate curve: Horton's equation, Phillips equation, and Holtan's equation. The infiltration capacity rate generally decreases over time from an initial maximum rate to a minimum steady rate. The infiltration index and W-index provide a constant infiltration rate for calculating runoff. The W-index is more accurate than the infiltration index because it excludes depression and interception losses. Both indices are commonly used to estimate flood magnitudes from critical storms.
ICLR Friday Forum: Sea level rise vulnerability assessments (February 22, 2019)
CLR hosted a Friday Forum webinar on February 22 titled 'Robust impact patterns: an approach to account for uncertainties in local sea-level rise vulnerability assessments', led by Jackie Yip of University of British Columbia.
While sea-level rise (SLR) is an inevitable effect of climate change, there are deep uncertainties regarding when and how SLR can impact society, which act as a significant barrier to adaptation. Recent literature calls for a shift from seeking optimal adaptation options to robust options that can perform reasonably under a range of possible futures, embracing uncertainties rather than eliminating them.
In response, this study develops a new approach, the Robust Impact Patterns (RIPs) method, to help decision-makers account for SLR impact uncertainties in adaptation planning. The method utilizes the pattern recognition capability of machine learning to transform thousands of local SLR impact maps into a small number of impact patterns that are robust across multiple futures, thereby processing an otherwise vast and overwhelming volume of impact information.
Jackie Yip is a Consequence Analyst at Kerr Wood Leidal, with experience in a range of climate vulnerability and resilience projects. Before joining KWL, she completed her Ph.D. at the Institute for Resources, Environment, and Sustainability of UBC, where she conducted this presentation’s research in partnership with the City of Vancouver. At the organizational level, Jackie was also a technical lead at Fraser Health, where her work focused on improving the resilience of healthcare facilities in the Lower Mainland to extreme events, including flooding and extreme heat. More broadly, she has led the design of Resilient-C, an online platform connecting Canadian coastal municipalities to share knowledge and collaborate on reducing risks to coastal hazards.
Hampton-Rds-MATS-Poster-2
This document outlines future work on assessing the impact of climate change and sea level rise on stormwater infrastructure in the Hampton Roads region of Virginia. The work has two main objectives: 1) Update design storms based on climate projections to account for increased storm intensity, duration and frequency. 2) Perform hydrologic and hydraulic modeling to identify vulnerable transportation infrastructure considering factors like sea level rise causing backups in storm sewers. The results will help local planners prioritize flood mitigation efforts.
INFILTRATION PPT
This document presents information on infiltration, the process by which water enters soil. It discusses factors that affect infiltration rate like soil properties and moisture levels. Four zones within soil during infiltration are identified: saturated, transmission, wetting, and wetting front. Common infiltration measurement methods like Horton and Philip's models as well as the Green-Ampt model are summarized. The Green-Ampt model provides a solution for calculating infiltration rate over time based on soil properties like conductivity, porosity, and wetting front suction head. An example calculation using the Green-Ampt model is also included.
Stormwater Asset Management Using Gis V5
The document summarizes a study conducted in Somerville, Massachusetts to develop a stormwater asset management system using GIS. Key findings include:
- Tree cover ranges from 9.6-30.5% across Somerville neighborhoods and provides an estimated $8.6 million in annual stormwater savings.
- Trees reduce runoff volumes by 40%, peak flows by 40%, and time of concentration by 20% on average.
- The system helps identify priority areas for stormwater management and potential water quality benefits of future BMP investments.
Short Version of Wet Area Mapping CANNOR
This document discusses four planning tools for wet area mapping and geoscience innovation: Flood, Locate, Trail, and Spill. Flood delineates likely flood extent. Locate ranks hydrological infrastructure by flow accommodation capacity. Trail optimizes trail and linear project routing. Spill tracks the likely path of waterborne contaminants. The tools are supported by a knowledge base and aim to further economic activities while managing uncertainty and supporting flood management strategies like reducing flow rates and restricting developments.
URBAN FLOOD - ISG 2014
This document discusses urban flood modeling that was conducted for Guwahati, India. It provides the following key details:
1. Urban flood modeling was conducted using hydrological modeling to compute flood hydrographs and hydraulic modeling to simulate flood inundation. Ground surveys were also conducted to develop flood hazard maps.
2. Modeling of past flood events in Guwahati showed floods occurring with daily rainfall peaks of 80-400mm. Specific zones like Rajgarh and Anil Nagar regularly experience flooding.
3. The modeling aims to establish flood thresholds to develop an urban flood forecasting system using radar rainfall estimates and hydrological modeling outputs. The end goal is early flood warning for disaster preparedness.
Interception and Depression Storage
This document discusses the process of interception, where precipitation is retained on vegetation like leaves and grass before evaporating. Around 10-20% of annual precipitation is typically intercepted by vegetation. Interception losses are especially high under dense forest stands, which can intercept up to 25% of annual precipitation. The factors that determine interception include storm characteristics, type of prevailing plants and trees, and season. Interception is an important consideration in hydrologic modeling depending on the time frame and volume of precipitation being analyzed.
Computation of Runoff
1. Distribution of Runoff
2. Hydrograph Analysis
a) Hydrograph & Unit Hydrograph
b) S - Hydrograph & Synthetic Unit Hydrograph
3. Computation of Design Discharge
a) Rational Formulae
b) SCS Curve Number Method
4. Flood Frequency Analysis
5. Flood Routing
poster
The document summarizes a study analyzing the adoption of green stormwater infrastructure (GSI) in Tucson, Arizona over the last decade. The key findings are:
1) On average, Tucson sub-watersheds have a GSI adoption rate of 4.7% of treated acreage and 5.8% of treated parcels, indicating room for further implementation.
2) The watersheds with the highest GSI treatment tend to be smaller and closer to urban areas, likely due to higher resident interest and more advocacy.
3) Certain watersheds have met or are approaching a goal of 10-25% GSI adoption, which modeling suggests could significantly reduce stormwater flooding and pollution.
Integrated hydro-geological risk for Mallero basin (Alpine Italy) – part 2: h...
Presentation of project in the course " Hydro-Geological Risks in Mountain Area (Hydraulic Assessment Part)" for M.Sc. "Civil Engineering for Risk Mitigation" at Politecnico di Milano.
Submitted by:
Maryam Izadifar, Alireza Babaee, Budiwan Adi Tirta, Ahmed Hassan El-Banna
Submitted to:
Professor Alessio Radice
Integrated hydro-geological risk for Mallero basin (Alpine Italy) – part 1: g...
Presentation of project in the course " Hydro-Geological Risks in Mountain Area (Geological Assessment Part)" for M.Sc. "Civil Engineering for Risk Mitigation" at Politecnico di Milano.
Submitted by:
Maryam Izadifar, Alireza Babaee
Submitted to:
Professor Laura Longoni
Infiltration.
This document provides an overview of infiltration including:
1. It defines infiltration as the process by which precipitation moves downward through the surface of the earth, replenishing soil moisture and recharging aquifers.
2. It describes the four soil moisture zones during infiltration - saturated, transmission, wetting, and wetting front.
3. It discusses factors that affect infiltration like soil characteristics, moisture content, vegetation cover, and rainfall intensity.
4. It outlines methods to measure infiltration including single and double ring infiltrometers, rainfall simulators, and hydrograph analysis.
5. It presents several common models to estimate infiltration rates, including Horton's infiltration model and the Green-
L6 infiltrationr rate calculation
This document discusses infiltration rate and equations. It defines infiltration rate as the speed at which water enters soil and describes common methods to measure or calculate it over time. These include Horton's equation, Phillips equation, Kostiakov equation, and Holtan's equation. It also introduces the concepts of cumulative infiltration and infiltration capacity curves. Finally, it discusses infiltration indices like the phi index and W index, which provide average infiltration rates for estimating runoff from storms.
Infiltration
The document discusses infiltration rate, which is the rate at which water enters soil. Infiltration rate depends on soil type and properties, with sand having the highest rate of more than 30 mm/hour and clay the lowest of 1-5 mm/hour. The rate starts high as water replaces air in pores (initial rate) and declines over time to a steady constant rate. Common methods to measure infiltration rate include using a ring infiltrometer. The document also presents equations like Kostiakov and Horton to model infiltration rate over time.
Characterizing Change in Baseflow Interactions with Urbanization Through Even...
Characterizing Change in Baseflow Interactions with Urbanization Through Even...Dirk Kassenaar M.Sc. P.Eng.
The document analyzed trends in streamflow characteristics across 15 urbanizing catchments in southern Ontario between 1969 and 2010. Key findings included increasing peak discharges, total volumes, and flashiness with urbanization. Event durations and times to peak generally decreased. Hydrograph separation showed increasing volumes of quick flow and interflow runoff. The study utilized high-resolution streamflow data and hydrograph analysis tools to characterize changes in watershed response due to urban development.L7 hydrograph
This document discusses hydrographs and the factors that influence them. It defines a hydrograph as a graphical representation of discharge over time at a particular point in a river. It also defines components of the hydrograph like the rising and falling limbs. Additionally, it discusses how watershed characteristics such as area, slope, rock type, soil, land use and precipitation patterns can impact the shape of the hydrograph. Specifically, steeper slopes and impermeable surfaces can produce a steeper rising limb while permeable soils and rocks or forested land can result in a more gradual rising limb.
What's hot (20)
Characterizing Change of High Frequency Return Periods in Urbanizing Southern...
Characterizing Change of High Frequency Return Periods in Urbanizing Southern...
ICLR Friday Forum: Sea level rise vulnerability assessments (February 22, 2019)
ICLR Friday Forum: Sea level rise vulnerability assessments (February 22, 2019)
Integrated hydro-geological risk for Mallero basin (Alpine Italy) – part 2: h...
Integrated hydro-geological risk for Mallero basin (Alpine Italy) – part 2: h...
Integrated hydro-geological risk for Mallero basin (Alpine Italy) – part 1: g...
Integrated hydro-geological risk for Mallero basin (Alpine Italy) – part 1: g...
Characterizing Change in Baseflow Interactions with Urbanization Through Even...
Characterizing Change in Baseflow Interactions with Urbanization Through Even...
Similar to Toronto Overland Flow and Basement Flooding
WASTEWATER COLLECTION SYSTEM PERFORMANCE UNDER CLIMATE CHANGE – SAFETY FACTOR...
Water Environment Association of Ontario
Annual Conference 2018
Lijing Xu, M.A.Sc., P.Eng., LEED AP, Robert J Muir, M.A.Sc., P.Eng.
City of Markham
April 17, 2018
This is the presentation of the paper findings: https://drive.google.com/open?id=15pc52qgbwOasSP5O1YU2GgEQLfqkjwbW
New York City Case Study
Prof Ni-Bin Chang presented the background review of New York City case study.
Flood impact assessment in mega cities under urban sprawl and climate change kick-off workshop
Projected Climate Change Impacts for Rhode Island’s Coast: A Summary of the S...
Learn the facts about climate change in Rhode Island, existing impacts, and near-term projections presented by Austin Becker, URI College of Environmental Life Sciences
Nichi.11 12-13.nasa.cynthia rosenzweig
Dr. Cynthia Rosenzweig, Senior Research Scientist, NASA Goddard Institute for Space Studies
Senior Research Scientist, Earth Institute at Columbia University
Co-Chair Mayor Bloomberg’s Climate Change Commission
Co-Director Urban Climate Change Research Network (UCCRN); National Institute for Coastal & Harbor Infrastructure, John F. Kennedy Center, Boston, Nov. 12, 2013: "The Triple Threat of Rising Sea Levels, Extreme Storms and Aging Infrastructure: Coastal Community Responses and The Federal Role" See http://www.nichiusa.org or http://www.nichi.us
Robert Muir Level of Service Upgrades and Climate Change Adaptation NRC Works...
Workshop on adaptation to climate change impact on
Urban / rural storm flooding
February 27, 2018
Changes in catchment characteristics
and remediation priorities due to climate change and
level of service upgrades
Robert J. Muir, M.A.Sc., P.Eng.
Manager, Stormwater, City of Markham
Quantifying the effects of tillage
1) The study quantified annual runoff and phosphorus export through drainage tiles and surface runoff in southern Ontario agricultural sites under different tillage practices.
2) Most runoff and phosphorus loss occurred from November to March due to seasonal precipitation patterns, with tiles and surface runoff exporting similar amounts of particulate phosphorus.
3) Tillage practices did not significantly impact dissolved or total phosphorus concentrations in tile drainage effluent. Overland flow exported more dissolved phosphorus despite contributing less runoff than tiles on an annual basis.
Urbanization and Baseflow Impacts - Evidence-based Water Budget Management an...
Green infrastructure, low impact development practices (LIDs), also called stormwater management best management practices (SWM BMPs), are often proposed to restore water balance functions and mitigate impacts or urbanization on runoff and recharge. One argument is that baseflows are lowered due to reduced infiltration and discharges to watercourses. It is a simple textbook theory.
What does the data show? The following slide presentation was prepared to respond to the Ontario draft LID guidance manual in early 2017 since water balance impacts have been cited as justification for this infrastructure.
Local studies show that baseflows have increased over decades of urbanization, calling into question the need for such measures considering that potential impact has not materialized. As noted in TRCA's Approved Updated Assessment Report under the Clean Water Act, at most gauges there was an upward trend in baseflows which prompted this: "These overall increases to baseflow volumes are contrary to the common thought that increased impervious cover leads to reduced baseflow" - so for those keeping score, data - one, common thought - zero. TMIG also analyzed baseflows in the GTA and noted “The seven-day average consecutive low flow data provides an indication of the observed baseflows within a watercourse, and hence is a suitable measure for determining whether baseflow trends exist in an urbanizing area. The trend analysis identified noticeable baseflow trends in 13 of the 24 recording stations. Of these eight urban and two rural stations exhibited an upward trend, suggesting increasing baseflow.”
Final presentation
This document outlines a study to model the hydrologic impacts of urban development on Watershed 80 (WS80) located in the Santee Experimental Forest in South Carolina. The study aims to assess current pre-development conditions using three hydrologic models and then simulate runoff and peak flows under varying levels of imperviousness (0-15%) to represent urbanization. Key findings from applying the Rational Method, USGS regression equations, and WinTR-55 model to WS80 are presented along with the design of a culvert to accommodate peak 100-year discharge flows.
Senior Capstone Design Final presentation
This document outlines a study to model the hydrologic impacts of urban development on Watershed 80 (WS80) located in the Santee Experimental Forest in South Carolina. The study aims to assess current pre-development conditions using three hydrologic models and then simulate runoff and peak flows under varying levels of imperviousness (0-15%) to represent urbanization. Key findings from applying the Rational Method, USGS regression equations, and WinTR-55 model to WS80 are presented along with the design of a culvert to accommodate peak 100-year discharge flows.
Westcott meadows development2011v2
The document summarizes a village meeting discussing a proposed housing development called Westcott Meadows. Residents raised concerns about traffic, flooding, and environmental impacts. They defeated a previous application from Taylor Wimpey and will object to the new application, citing similar issues around landscape, flooding risk, protected wildlife, and inadequate assessment of impacts. Residents were encouraged to submit objection letters within 21 days.
Shoreline Change Maps and Projected Shoreline Change for the RI Shoreline_RIF...
This document summarizes ongoing projects to map historical shoreline change in Washington County, Rhode Island and project future shoreline positions. It discusses updating shoreline change maps from 1939 to 2014 and using statistical and process-based models to project shorelines as far as 2100 under scenarios of historic rates of change and increased rates due to sea level rise and increased storm impacts. The goals are to better understand coastal risk and guide sustainable development.
Climate Change and Water Resources Analysis
This document summarizes a presentation given on adapting water resources technical analyses to climate change. It discusses several key climate change trends that could impact analyses, including increased precipitation intensities, a longer growing season, and increased drought risk. It outlines how these trends could influence various technical analyses and models used in areas like riverine hydrology, coastal surge modeling, and hydraulic structures. These impacts may include changes to design rainfalls, vegetation changes, erosion impacts, and combined probability issues. The presentation argues technical analyses will need to adapt to incorporate these anticipated climate change impacts.
Sea level rise and storm surge tools and datasets supporting Municipal Resili...
Why plan for growth and change, when it seems so much easier to simply react?
When there is a distinct and shared vision for your community - when residents, businesses and local government anticipate a sustainable town with cohesive and thriving neighborhoods - you have the power to conserve your beautiful natural spaces, enhance your existing downtown or Main Street, enable rural areas to be productive and prosperous, and save money through efficient use of existing infrastructure.
This is the dollars and sense of smart growth.
Success is clearly visible in Maine, from the creation of a community-built senior housing complex and health center in Fort Fairfield to conservation easements creating Forever Farms to Rockland's revitalized downtown. Communities have options. We have the power to manage our own responses to growth and change.
After all, “Planning is a process of choosing among those many options. If we do not choose to plan, then we choose to have others plan for us.” - Richard I. Winwood
And in the end, this means that our children and their children will choose to make Maine home and our economy will provide the opportunities to do so.
The Summit offers you a wonderful opportunity to be a part of the transformative change in Maine that we’ve seen these gatherings produce. We encourage you to consider the value of being actively involved in growing Maine’s economy and protecting the reasons we choose to live here.
Essex climatechangeflooding_ScottHursley
This document discusses strategies for adapting to climate change through low impact development (LID) stormwater management techniques. It provides background on increasing rainfall intensities in Massachusetts and more frequent flooding due to climate change. The document then outlines various LID techniques that can help mitigate these impacts, such as rain barrels, permeable pavement, bioretention cells, and green roofs. It emphasizes the importance of adapting stormwater infrastructure to future climate conditions.
RamPresentation
This document summarizes a study on land subsidence in California's Central Valley caused by groundwater pumping. It finds that subsidence up to 9 meters occurred historically due to high groundwater pumping. Since the 1950s, surface water projects reduced pumping and subsidence. However, droughts cause reversion to pumping. Recent GPS and InSAR data show up to 540 mm of subsidence near El Nido from 2008-2010. Subsidence correlates with groundwater level declines. Subsidence impacts canal infrastructure and is costly to address. Recommendations include managed aquifer recharge and reduced pumping regulations.
Chris Spry Enviro Final
This document summarizes a storm water modeling project for the Town Creek Watershed in Salisbury, NC that analyzed changes in land use and storm water runoff between 1978 and 2009. Digital elevation data, soil data, and aerial/satellite imagery from 1978 and 2009 were used to create land cover maps and calculate storm water runoff for each time period using the Curve Number runoff method. The results showed increases in urban area and storm water runoff over time, reinforcing the impact of urbanization. Issues included limitations of the Curve Number method for less elevated, more urbanized areas.
RV 2015: If You Build It, Will it Flood? Climate Change Vulnerabilities and S...
Extreme weather events, flooding and rising sea levels devastate communities, destroy or severely damage costly infrastructure, and introduce a strong element of uncertainty in current and future planning. This new normal spotlights how and where we build new -- or strengthen existing -- infrastructure and communities and the governance systems that manage and regulate these decisions and investments. Hear experts tackle these issues, from Hurricane Sandy to sea level rise in the Bay Area. What are the weak links in terms of existing infrastructure, cross-jurisdictional government response systems and disaster preparedness? Learn about state guidelines and legislation. Discuss how transportation agencies deal with major transit infrastructure challenges. Discover the role of natural systems in protecting critical transit infrastructure
Moderator: Allison Brooks, Executive Director, Bay Area Regional Collaborative, Oakland, California
Eric Fang, AIA, AICP, LEED AP, Associate Principal, EE&K, a Perkins Eastman Company, New York, New York
Projjal Dutta, AIA, LEED AP, Director, Sustainability Initiatives, Metropolitan Transportation Authority, New York, New York
James Allison, Manager of Planning, Capitol Corridor Joint Powers Authority, Oakland, California
JR DeLaRosa, Special Assistant for Climate Change, California Natural Resources Agency, Sacramento, California
Chris Spry
This document summarizes a storm water modeling project for the Town Creek Watershed in Salisbury, NC that used the Curve Number Runoff Method to model land use change between 1978 and 2009 and calculate the resulting changes in storm water runoff. Land use data from aerial imagery and satellite images from 1978 and 2009 were incorporated into a GIS system along with digital elevation models and soil data. The results found increases in urban land use of 8% along with decreases in forest and open space, and a corresponding increase in storm water runoff accumulation at a point in the watershed. The project reinforced the impact of urbanization in increasing storm water runoff but encountered issues applying the method in an already urbanized environment.
Wetland Flood Reduction - Distribution of Wetland Features and Applicability ...
This presentation was prepared to advise Green Communities Canada on the applicability of green infrastructure for flood risk reduction as part of the Ontario Urban Flooding Collaborative. It includes a review of the Intact Centre on Climate Adaptation's Laurel Creek watershed assessment (a case study in their 2017 report "When the Big Storms Hit: The Role of Wetlands to Limit Urban and Rural Flood Damage". The review suggests that the ICCA case study is atypical for both urban and rural areas in Ontario, meaning that opportunities for flood storage and damage reduction are more limited than suggested.
Chris Spry
This document presents a storm water modeling project for the Town Creek Watershed in Salisbury, NC using the Curve Number Runoff Method. Land use in the watershed was modeled between 1978 and 2009 using aerial imagery and satellite data. Results found forest and open space decreased by 3% and 5% respectively, while urban area increased by 8%. Storm water runoff increased from 78,592 cubic feet in 1978 to 92,131 cubic feet in 2009 based on a 4 inch rainfall. While the Curve Number method provided useful insights, it may be better suited to areas with greater elevation changes and less urbanization.
Similar to Toronto Overland Flow and Basement Flooding (20)
WASTEWATER COLLECTION SYSTEM PERFORMANCE UNDER CLIMATE CHANGE – SAFETY FACTOR...
WASTEWATER COLLECTION SYSTEM PERFORMANCE UNDER CLIMATE CHANGE – SAFETY FACTOR...
Projected Climate Change Impacts for Rhode Island’s Coast: A Summary of the S...
Projected Climate Change Impacts for Rhode Island’s Coast: A Summary of the S...
Robert Muir Level of Service Upgrades and Climate Change Adaptation NRC Works...
Robert Muir Level of Service Upgrades and Climate Change Adaptation NRC Works...
Urbanization and Baseflow Impacts - Evidence-based Water Budget Management an...
Urbanization and Baseflow Impacts - Evidence-based Water Budget Management an...
Shoreline Change Maps and Projected Shoreline Change for the RI Shoreline_RIF...
Shoreline Change Maps and Projected Shoreline Change for the RI Shoreline_RIF...
Sea level rise and storm surge tools and datasets supporting Municipal Resili...
Sea level rise and storm surge tools and datasets supporting Municipal Resili...
RV 2015: If You Build It, Will it Flood? Climate Change Vulnerabilities and S...
RV 2015: If You Build It, Will it Flood? Climate Change Vulnerabilities and S...
Wetland Flood Reduction - Distribution of Wetland Features and Applicability ...
Wetland Flood Reduction - Distribution of Wetland Features and Applicability ...
More from Robert Muir
City of Markham IDF & Design Hyetograph Review
Review of historical Intensity-Duration-Frequency (IDF) data in Markham, Ontario, Canada as well as IDF trends in southern Ontario and across Canada. Presented to the Southern Ontario Municipal Stormwater Discussion Group. Comparison with Insurance Industry and media reporting on climate change effects (e.g., Telling the Weather Story). Review of design hyetographs and design standards updates to improve resiliency.
Cost Effectiveness of LID Implementation
Green infrastructure can provide flood control, erosion control, and water quality benefits but the costs must be considered. A case study in Markham, Ontario found that a green infrastructure strategy was not cost-effective for flood control compared to conventional grey infrastructure strategies when considering capital and lifecycle costs. While green infrastructure provided benefits, the annual costs were much higher than the annual benefits. The study also highlighted concerns with infiltration from green infrastructure increasing risks of basement flooding and degradation of drinking water sources.
National Guideline Development for Benefit-Cost Analysis of Storm Drainage In...
The development of the National Research Council of Canada's benefit cost guideline for storm drainage and flood control infrastructure presented at the WEAO 2021 Collection Systems Committee Fall Webinar, October 28, 2020
National Research Council - Guidelines on Undertaking a Comprehensive Analysi...
Presentation on NRC Flood Control Benefit Cost Guideline made at WEAO 2021 Technical Symposium in London, Ontario,
November 9, 2021.
Clean Air Partnership Green Infrastructure CAC Meeting - Don Mills Channel Fl...
Presentation on the application of Cost Benefit Analysis to water resources engineering projects, including for municipal flood control as part of Municipal Class Environmental Assessment infrastructure projects and city-wide programs. Evaluation of green infrastructure (Low Impact Development (LID)) capital costs and grey infrastructure costs.
IDF Trend Analysis, Future Climate Projections & System Design for Extreme We...
Presentation on policies promoting climate resilience in Ontario, a review of insurance industry and government agency statements on extreme weather trends, a review of national and local engineering climate datasets annual maximum series and derived IDF trends, particularly southern Ontario. A review of engineering and academic studies for multiple municipalities highlights many unsupported claims on extreme weather trends. Practical design approaches given decreasing or stationary IDF trends, and allowances for future climate changes effects are noted, including the consideration of design stress test analysis with synthetic hyetographs or rain intensity increases. Design hyetographs are shown to be more critical to infrastructure system design than IDF curve shifts in regions such as Southern Ontario.
An Economic Analysis of Green v. Grey Infrastructure
Water Environment Association of Ontario 2019 Annual Conference, Toronto, Ontario, April 16, 2019
by Robert J. Muir, M.A.Sc., P.Eng., Fabian Papa, MBA, P.Eng.
Presentation reviews policies and regulations in Ontario promoting cost-effective infrastructure servicing. Summarizes the assessment of cost effectiveness of grey, green and blended green and grey flood damage reduction strategies on a system-wide basis. Identifies triple-bottom-line benefits of erosion mitigation reduction and water quality improvements due to green infrastructure implementation. Details of the analysis are presented in the proceedings paper also included here: https://www.cityfloodmap.com/2019/03/an-economic-analysis-of-green-v-grey.html
The analysis indicates benefit cost ratios for flood control and other benefits and assesses funding impacts on stormwater utility fees in a case study in the City of Markham. Markham's current Flood Control Program consisting largely of grey infrastructure is shown to be cost-effective with benefits exceeding costs by 2 to 1 based on insured loss deferral (and a higher ratio considering higher total losses). Green infrastructure is shown to be less cost-effective at delivering flood control and the cost for achieving water quality benefits exceeds the estimated willingness to pay 'value' of those benefits. The analysis suggests that a critical, strategic evaluation of green infrastructure implementation targets is required prior to system-wide implementation, given cost concerns.
An Economic Analysis of Green and Grey Infrastructure - TRIECA Conference 2019
TRIECA Conference , 2019, An Economic Analysis of Green and Grey Infrastructure Benefits and Costs, Robert J. Muir, M.A.Sc., P.Eng., Manager, Stormwater, City of Markham, Fabian Papa, M.A.Sc., MBA, P.Eng., President, FP&P HydraTek
Presentation reviews regulations on policies on infrastructure cost, provides a history of cost benefit analysis, reviews Ontario green infrastructure policy and cost considerations, identifies research gaps in cost benefit analysis, evaluates the costs and benefits of grey, green and blended grey and green infrastructure strategies considering full lifecycle costs and system-wide implementation in the City of Markham. Analysis is based on this upcoming WEAO paper https://www.cityfloodmap.com/2019/03/an-economic-analysis-of-green-v-grey.html
Ontario Society of Professional Engineers OSPE Green Infrastructure Roundtabl...
Green Infrastructure – Cost Effectiveness and Technical Challenges for Flood Mitigation, Robert J. Muir, M.A.Sc., P.Eng.
Manager, Stormwater, City of Markham, January 30, 2018 - Mississauga, Ontario
The presentation presents regulations and policies regarding cost effective infrastructure, explores green infrastructure capital costs in Ontario based on recent project tender costs and other North American extensive program sources, explores lifecycle cost (LCC) impacts of widespread green infrastructure implementation in Ontario, including cost per household and impacts on the current infrastructure deficit, and presents benefit cost analysis for city-wide grey and green infrastructure strategies including benefit/cost ratios for flood damage reduction. Unit costs of no regret programs such as sanitary downspout disconnection and plumbing isolation programs, and wastewater and stormwater system upgrades, and green infrastructure retrofits are presented per hectare. Gaps in research relying on meta-analysis estimates of flood control benefits that do not consider local engineering or costs are presented. Impacts of green infrastructure on wastewater systems and infiltration stresses is presented, and correlation of wastewater infiltration stresses with local sewer back-up risks is shown for the City of Markham. Water supply risks of green infrastructure relying on infiltration including chloride stresses are explored. The unfavourable benefit-cost profile of green infrastructure and potential impacts on wastewater system flood risks and municipal water supplies suggests a strategic review of implementation targets and policies is warranted to identify financially sustainable and technically-appropriate requirements.
Extreme Weather Resiliency and Climate Adaptation Through Strategic Asset Man...
Natural Environment Climate Change Summit, Extreme Weather Resiliency and Climate Adaptation Through Strategic Asset Management & Infrastructure Investments, Robert J. Muir, M.A.Sc., P.Eng., Manager, Stormwater, City of Markham, March 7, 2019, Ajax, Ontario
The presentation explores the drivers for cost efficiency assessment infrastructure investments including those to mitigate flooding due to extreme weather and future climate change impacts on high intensity rainfall that contributes to urban flooding. Flood risk factors including severe rainfall trends are explored as well as hydrologic stresses due to urbanization and design standard evolution. Measures to reduce flooding in the City of Markham are explored using benefit cost analysis in the context of its comprehensive city-wide Flood Control Program. The program includes many projects that demonstrate a high return on investment (ROI) for flood risk reduction, making them eligible for Infrastructure Canada's Disaster Mitigation Adaptation Fund (DMAF) grant funding. An evaluation of risk management strategies is presented that includes traditional grey infrastructure engineering solutions such as sewer capacity upgrades, and emerging green infrastructure strategies including engineered and enhanced assets (e.g., bioswales, rain gardens, infiltration trenches, GSI). The strategies take a holistic, system-wide approach to evaluating benefits and lifecycle costs, including initial capital on on-going operation and maintenance costs. The analysis will be presented a t the annual Water Environment Association of Ontario conference in 2019 in Toronto, Ontario. A link to the paper material is presented here: https://www.cityfloodmap.com/2019/03/an-economic-analysis-of-green-v-grey.html
Thinking Fast and Slow in the ROW, Mission Possible Strategies to Make Room f...
OPWA Right of Way Management Conference, Ajax, Ontario, November 13, 2018
Keynote Address by Robert Muir, Manager, Stormwater, City of Markham
The presentation "Thinking Fast and Slow in the ROW, Mission Possible Strategies to Make Room for Bike Lanes and Bioswales in a Crowded Environment" explores strategic infrastructure investment planning and cost-effective asset management for public assets. The cost efficiency assessment of various mitigation measures is explored using benefit cost analysis in the context of Markham's comprehensive city-wide Flood Control Program. The program includes many projects that demonstrate a high return on investment (ROI) for flood risk reduction, making them eligible for Infrastructure Canada's Disaster Mitigation Adaptation Fund (DMAF) grant funding.
Storm Warts, The Floods Awaken, A New Hope for Cost-Effective Investment in F...
Presentation by Robert Muir at the The National Conference of the Canadian Water and Wastewater Association, Montréal, Canada, November 5, 2018
Climate Change & Urban Development Have Impacted Streamflows in Southern Ontario
Dr. Trevor Dickinson, Professor Emeritus University of Guelph presented his work with Ramesh Rudra and Kishor Panjabi, Water Resources Engineering, University of Guelph to the Southern Ontario Stormwater Discussion Group at its September 27, 2018 meeting in Brantford, Ontario. The presentation shows the effects of climate on streamflows in southern Ontario including lower spring flow volumes and rates, and the effects of urbanization on streamflows including higher spring and summer flows. The distribution of flooding events through the years is reviewed, showing fewer spring and more summer period flood events. Climate change appears to increase winter runoff volumes due to higher temperatures which reduce spring volumes and peaks, a decrease in flood risk.
Grey and Green Infrastructure Benefit Cost, Return on Investment Analysis for...
This presentation was made to the Southern Ontario Municipal Stormwater Discussion Group on September 27, 2018 in Brantford, Ontario. It describes benefit-cost analysis to show the return on investment (ROI) of infrastructure improvements to reduce flood damages (insured and total), and to achieve other benefits including erosion mitigation and water quality improvements. Earlier benefit cost analyses for projects ranging from the Winnipeg floodway to the Stratford, Ontario storm system master plan are shown. The benefit-cost ratio of an Ontario flood control study is shown including a comparison of grey and green infrastructure cost effectiveness - analysis shows the grey infrastructure solution can meet the current Disaster Mitigation Adaptation Fund (DMAF) benefit/cost threshold of 2:1 required to be eligible for federal funding. In addition, city-wide analysis of grey infrastructure storm and sanitary system upgrades and green infrastructure / low impact development infrastructure strategies is summarized.
Results show that the grey infrastructure solution can meet the DMAF benefit/cost threshold of 2:1 but that the benefit/cost of green infrastructure is substantially below it considering flood reduction benefits. When other benefits are considered, and targeted implementation of green infrastructure is considered (e.g., representing 25% of the urban area with limited overland drainage design standards) and considering additional benefits including a substantial 'willingness to pay' estimate for water quality improvements, costs continue to exceed benefits. The insurance industry and some affiliated research groups have suggested that natural infrastructure or green infrastructure should be considered to improve climate resilience and reduce flood damages - this analysis would suggest that approach is misguided and could misdirect scare resources to ineffective strategies.
Urban Flood Risk Mapping - Tiered Vulnerability Assessment in Risk Mitigation...
This document summarizes a webinar on urban flood risk mapping presented by Robert Muir from the City of Markham. The webinar outlined a tiered vulnerability assessment approach for mapping riverine, wastewater, and storm drainage flood risks to guide best practices and projects. Simple, intermediate, and advanced risk mapping methods were described for each system. The risk maps can be used to identify policies, programs, and capital projects to reduce flood risk from flood plains to floor drains. Combining risk factors across systems was also discussed.
Extreme Weather Resiliency and Climate Adaptation Through Strategic Asset Man...
Robert Muir. Association of Municipalities Ontario. 2018 Annual Conference. August 21, 2018, Ottawa, Ontario, Canada.
Green Infrastructure / Low Impact Development LID Design Tool and Lifecycle C...
This document discusses stormwater management and low impact development (LID) targets. It provides background on the evolution of LID targets in Ontario. It then describes analytical probability models that can be used to design LID measures and assess their performance. The document analyzes the capital and lifecycle costs of meeting proposed LID volume targets from the Ministry of Environment and Climate Change, finding the costs to be 4-5 times higher than conventional technologies. It also presents unit cost data for completed LID projects and analyzes the lifecycle costs of implementing LIDs in a new development in Markham. The conclusions emphasize the need for system-wide planning to identify cost-effective LID targets and consider full lifecycle costs for sustainable financial
Addressing Climate Change through Engineering Practice
Climate Change Training Session for Municipal and Conservation Authority Engineers, Planners and Decision Makers.
Toronto - 26 April 2017
Presented by Hani Farghaly, PhD., P.Eng.
Ontario Ministry of Transportation
This comprehensive review of highway drainage infrastructure resiliency under climate change indicates that impacts to storm sewers, roadway drainage surfaces, and culverts is limited with projected climate change effects.
Robert Muir Green Infrastructure for Climate Adaptation NRC Workshop on Urban...
This document summarizes a workshop presentation on the use of green infrastructure as an adaptation measure for climate change impacts on storm and urban flooding. It discusses the needs for adaptation in both new and existing developments. For existing developments, it notes challenges from historical development standards and potential risks from increased infiltration. It examines the cost effectiveness and feasibility of green infrastructure compared to traditional engineering measures. It also discusses potential risks of green infrastructure aggravating issues like increased infiltration stresses on wastewater systems or other constraints. Overall, the presentation questions the effectiveness of green infrastructure for flood risk reduction and argues it may not be suitable in areas with existing infrastructure limitations or infiltration issues.
Robert Muir Extreme Rainfall Trends - NRC Workshop on urban rural storm flood...
The National Research Council's Workshop on adaptation to climate change impact on Urban / rural storm flooding February 27, 2018. Presentation on: National, regional, local IDF trend
analysis & hyetograph selection to
define risks and system stresses
Robert J. Muir, M.A.Sc., P.Eng.
Manager, Stormwater, City of Markham
More from Robert Muir (20)
National Guideline Development for Benefit-Cost Analysis of Storm Drainage In...
National Guideline Development for Benefit-Cost Analysis of Storm Drainage In...
National Research Council - Guidelines on Undertaking a Comprehensive Analysi...
National Research Council - Guidelines on Undertaking a Comprehensive Analysi...
Clean Air Partnership Green Infrastructure CAC Meeting - Don Mills Channel Fl...
Clean Air Partnership Green Infrastructure CAC Meeting - Don Mills Channel Fl...
IDF Trend Analysis, Future Climate Projections & System Design for Extreme We...
IDF Trend Analysis, Future Climate Projections & System Design for Extreme We...
An Economic Analysis of Green v. Grey Infrastructure
An Economic Analysis of Green v. Grey Infrastructure
An Economic Analysis of Green and Grey Infrastructure - TRIECA Conference 2019
An Economic Analysis of Green and Grey Infrastructure - TRIECA Conference 2019
Ontario Society of Professional Engineers OSPE Green Infrastructure Roundtabl...
Ontario Society of Professional Engineers OSPE Green Infrastructure Roundtabl...
Extreme Weather Resiliency and Climate Adaptation Through Strategic Asset Man...
Extreme Weather Resiliency and Climate Adaptation Through Strategic Asset Man...
Thinking Fast and Slow in the ROW, Mission Possible Strategies to Make Room f...
Thinking Fast and Slow in the ROW, Mission Possible Strategies to Make Room f...
Storm Warts, The Floods Awaken, A New Hope for Cost-Effective Investment in F...
Storm Warts, The Floods Awaken, A New Hope for Cost-Effective Investment in F...
Climate Change & Urban Development Have Impacted Streamflows in Southern Ontario
Climate Change & Urban Development Have Impacted Streamflows in Southern Ontario
Grey and Green Infrastructure Benefit Cost, Return on Investment Analysis for...
Grey and Green Infrastructure Benefit Cost, Return on Investment Analysis for...
Urban Flood Risk Mapping - Tiered Vulnerability Assessment in Risk Mitigation...
Urban Flood Risk Mapping - Tiered Vulnerability Assessment in Risk Mitigation...
Extreme Weather Resiliency and Climate Adaptation Through Strategic Asset Man...
Extreme Weather Resiliency and Climate Adaptation Through Strategic Asset Man...
Green Infrastructure / Low Impact Development LID Design Tool and Lifecycle C...
Green Infrastructure / Low Impact Development LID Design Tool and Lifecycle C...
Addressing Climate Change through Engineering Practice
Addressing Climate Change through Engineering Practice
Robert Muir Green Infrastructure for Climate Adaptation NRC Workshop on Urban...
Robert Muir Green Infrastructure for Climate Adaptation NRC Workshop on Urban...
Robert Muir Extreme Rainfall Trends - NRC Workshop on urban rural storm flood...
Robert Muir Extreme Rainfall Trends - NRC Workshop on urban rural storm flood...
Recently uploaded
BRAIN TUMOR DETECTION for seminar ppt.pdf
BRAIN TUMOR DETECTION
AND CLASSIFICATION USING
ARTIFICIAL INTELLIGENCE
Redefining brain tumor segmentation: a cutting-edge convolutional neural netw...
Medical image analysis has witnessed significant advancements with deep learning techniques. In the domain of brain tumor segmentation, the ability to
precisely delineate tumor boundaries from magnetic resonance imaging (MRI)
scans holds profound implications for diagnosis. This study presents an ensemble convolutional neural network (CNN) with transfer learning, integrating
the state-of-the-art Deeplabv3+ architecture with the ResNet18 backbone. The
model is rigorously trained and evaluated, exhibiting remarkable performance
metrics, including an impressive global accuracy of 99.286%, a high-class accuracy of 82.191%, a mean intersection over union (IoU) of 79.900%, a weighted
IoU of 98.620%, and a Boundary F1 (BF) score of 83.303%. Notably, a detailed comparative analysis with existing methods showcases the superiority of
our proposed model. These findings underscore the model’s competence in precise brain tumor localization, underscoring its potential to revolutionize medical
image analysis and enhance healthcare outcomes. This research paves the way
for future exploration and optimization of advanced CNN models in medical
imaging, emphasizing addressing false positives and resource efficiency.
Design and optimization of ion propulsion drone
Electric propulsion technology is widely used in many kinds of vehicles in recent years, and aircrafts are no exception. Technically, UAVs are electrically propelled but tend to produce a significant amount of noise and vibrations. Ion propulsion technology for drones is a potential solution to this problem. Ion propulsion technology is proven to be feasible in the earth’s atmosphere. The study presented in this article shows the design of EHD thrusters and power supply for ion propulsion drones along with performance optimization of high-voltage power supply for endurance in earth’s atmosphere.
IEEE Aerospace and Electronic Systems Society as a Graduate Student Member
IEEE Aerospace and Electronic Systems Society as a Graduate Student Member
原版制作(Humboldt毕业证书)柏林大学毕业证学位证一模一样
原件一模一样【微信:bwp0011】《(Humboldt毕业证书)柏林大学毕业证学位证》【微信:bwp0011】学位证,留信认证(真实可查,永久存档)原件一模一样纸张工艺/offer、雅思、外壳等材料/诚信可靠,可直接看成品样本,帮您解决无法毕业带来的各种难题!外壳,原版制作,诚信可靠,可直接看成品样本。行业标杆!精益求精,诚心合作,真诚制作!多年品质 ,按需精细制作,24小时接单,全套进口原装设备。十五年致力于帮助留学生解决难题,包您满意。
本公司拥有海外各大学样板无数,能完美还原。
1:1完美还原海外各大学毕业材料上的工艺:水印,阴影底纹,钢印LOGO烫金烫银,LOGO烫金烫银复合重叠。文字图案浮雕、激光镭射、紫外荧光、温感、复印防伪等防伪工艺。材料咨询办理、认证咨询办理请加学历顾问微bwp0011
【主营项目】
一.毕业证【微bwp0011】成绩单、使馆认证、教育部认证、雅思托福成绩单、学生卡等!
二.真实使馆公证(即留学回国人员证明,不成功不收费)
三.真实教育部学历学位认证(教育部存档!教育部留服网站永久可查)
四.办理各国各大学文凭(一对一专业服务,可全程监控跟踪进度)
如果您处于以下几种情况:
◇在校期间,因各种原因未能顺利毕业……拿不到官方毕业证【微bwp0011】
◇面对父母的压力,希望尽快拿到;
◇不清楚认证流程以及材料该如何准备;
◇回国时间很长,忘记办理;
◇回国马上就要找工作,办给用人单位看;
◇企事业单位必须要求办理的
◇需要报考公务员、购买免税车、落转户口
◇申请留学生创业基金
留信网认证的作用:
1:该专业认证可证明留学生真实身份
2:同时对留学生所学专业登记给予评定
3:国家专业人才认证中心颁发入库证书
4:这个认证书并且可以归档倒地方
5:凡事获得留信网入网的信息将会逐步更新到个人身份内,将在公安局网内查询个人身份证信息后,同步读取人才网入库信息
6:个人职称评审加20分
7:个人信誉贷款加10分
8:在国家人才网主办的国家网络招聘大会中纳入资料,供国家高端企业选择人才
artificial intelligence and data science contents.pptx
What is artificial intelligence? Artificial intelligence is the ability of a computer or computer-controlled robot to perform tasks that are commonly associated with the intellectual processes characteristic of humans, such as the ability to reason.
› ...
Artificial intelligence (AI) | Definitio
Electric vehicle and photovoltaic advanced roles in enhancing the financial p...
Climate change's impact on the planet forced the United Nations and governments to promote green energies and electric transportation. The deployments of photovoltaic (PV) and electric vehicle (EV) systems gained stronger momentum due to their numerous advantages over fossil fuel types. The advantages go beyond sustainability to reach financial support and stability. The work in this paper introduces the hybrid system between PV and EV to support industrial and commercial plants. This paper covers the theoretical framework of the proposed hybrid system including the required equation to complete the cost analysis when PV and EV are present. In addition, the proposed design diagram which sets the priorities and requirements of the system is presented. The proposed approach allows setup to advance their power stability, especially during power outages. The presented information supports researchers and plant owners to complete the necessary analysis while promoting the deployment of clean energy. The result of a case study that represents a dairy milk farmer supports the theoretical works and highlights its advanced benefits to existing plants. The short return on investment of the proposed approach supports the paper's novelty approach for the sustainable electrical system. In addition, the proposed system allows for an isolated power setup without the need for a transmission line which enhances the safety of the electrical network
学校原版美国波士顿大学毕业证学历学位证书原版一模一样
原版一模一样【微信:741003700 】【美国波士顿大学毕业证学历学位证书】【微信:741003700 】学位证,留信认证(真实可查,永久存档)offer、雅思、外壳等材料/诚信可靠,可直接看成品样本,帮您解决无法毕业带来的各种难题!外壳,原版制作,诚信可靠,可直接看成品样本。行业标杆!精益求精,诚心合作,真诚制作!多年品质 ,按需精细制作,24小时接单,全套进口原装设备。十五年致力于帮助留学生解决难题,包您满意。
本公司拥有海外各大学样板无数,能完美还原海外各大学 Bachelor Diploma degree, Master Degree Diploma
1:1完美还原海外各大学毕业材料上的工艺:水印,阴影底纹,钢印LOGO烫金烫银,LOGO烫金烫银复合重叠。文字图案浮雕、激光镭射、紫外荧光、温感、复印防伪等防伪工艺。材料咨询办理、认证咨询办理请加学历顾问Q/微741003700
留信网认证的作用:
1:该专业认证可证明留学生真实身份
2:同时对留学生所学专业登记给予评定
3:国家专业人才认证中心颁发入库证书
4:这个认证书并且可以归档倒地方
5:凡事获得留信网入网的信息将会逐步更新到个人身份内,将在公安局网内查询个人身份证信息后,同步读取人才网入库信息
6:个人职称评审加20分
7:个人信誉贷款加10分
8:在国家人才网主办的国家网络招聘大会中纳入资料,供国家高端企业选择人才
Use PyCharm for remote debugging of WSL on a Windo cf5c162d672e4e58b4dde5d797...
This document serves as a comprehensive step-by-step guide on how to effectively use PyCharm for remote debugging of the Windows Subsystem for Linux (WSL) on a local Windows machine. It meticulously outlines several critical steps in the process, starting with the crucial task of enabling permissions, followed by the installation and configuration of WSL.
The guide then proceeds to explain how to set up the SSH service within the WSL environment, an integral part of the process. Alongside this, it also provides detailed instructions on how to modify the inbound rules of the Windows firewall to facilitate the process, ensuring that there are no connectivity issues that could potentially hinder the debugging process.
The document further emphasizes on the importance of checking the connection between the Windows and WSL environments, providing instructions on how to ensure that the connection is optimal and ready for remote debugging.
It also offers an in-depth guide on how to configure the WSL interpreter and files within the PyCharm environment. This is essential for ensuring that the debugging process is set up correctly and that the program can be run effectively within the WSL terminal.
Additionally, the document provides guidance on how to set up breakpoints for debugging, a fundamental aspect of the debugging process which allows the developer to stop the execution of their code at certain points and inspect their program at those stages.
Finally, the document concludes by providing a link to a reference blog. This blog offers additional information and guidance on configuring the remote Python interpreter in PyCharm, providing the reader with a well-rounded understanding of the process.
Embedded machine learning-based road conditions and driving behavior monitoring
Car accident rates have increased in recent years, resulting in losses in human lives, properties, and other financial costs. An embedded machine learning-based system is developed to address this critical issue. The system can monitor road conditions, detect driving patterns, and identify aggressive driving behaviors. The system is based on neural networks trained on a comprehensive dataset of driving events, driving styles, and road conditions. The system effectively detects potential risks and helps mitigate the frequency and impact of accidents. The primary goal is to ensure the safety of drivers and vehicles. Collecting data involved gathering information on three key road events: normal street and normal drive, speed bumps, circular yellow speed bumps, and three aggressive driving actions: sudden start, sudden stop, and sudden entry. The gathered data is processed and analyzed using a machine learning system designed for limited power and memory devices. The developed system resulted in 91.9% accuracy, 93.6% precision, and 92% recall. The achieved inference time on an Arduino Nano 33 BLE Sense with a 32-bit CPU running at 64 MHz is 34 ms and requires 2.6 kB peak RAM and 139.9 kB program flash memory, making it suitable for resource-constrained embedded systems.
Recently uploaded (20)
Redefining brain tumor segmentation: a cutting-edge convolutional neural netw...
Redefining brain tumor segmentation: a cutting-edge convolutional neural netw...
IEEE Aerospace and Electronic Systems Society as a Graduate Student Member
IEEE Aerospace and Electronic Systems Society as a Graduate Student Member
4. Mosca vol I -Fisica-Tipler-5ta-Edicion-Vol-1.pdf
4. Mosca vol I -Fisica-Tipler-5ta-Edicion-Vol-1.pdf
Manufacturing Process of molasses based distillery ppt.pptx
Manufacturing Process of molasses based distillery ppt.pptx
Generative AI leverages algorithms to create various forms of content
Generative AI leverages algorithms to create various forms of content
artificial intelligence and data science contents.pptx
artificial intelligence and data science contents.pptx
Electric vehicle and photovoltaic advanced roles in enhancing the financial p...
Electric vehicle and photovoltaic advanced roles in enhancing the financial p...
Use PyCharm for remote debugging of WSL on a Windo cf5c162d672e4e58b4dde5d797...
Use PyCharm for remote debugging of WSL on a Windo cf5c162d672e4e58b4dde5d797...
Embedded machine learning-based road conditions and driving behavior monitoring
Embedded machine learning-based road conditions and driving behavior monitoring
Toronto Overland Flow and Basement Flooding
- 1. Toronto Overland Flow & Basement Flooding Correlating Reported Basement Flooding During 2000, 2005 and 2013 Extreme Rainfall Events with 100-Year Major Overland Flow Spread Holistic Urban Flood Risk Assessment From Flood Plain to Floor Drain Robert J. Muir, M.A.Sc., P.Eng. © 2016
- 2. Digital Elevation Model Eastern Beaches © CityFloodMap.Com 2016
- 3. Regulated Valley Including Flood Plain Eastern Beaches © CityFloodMap.Com 2016
- 4. Overland Flow Path (10 hectare catchment limit) Eastern Beaches © CityFloodMap.Com 2016
- 5. Overland Flow 4x 100-Year Spread Eastern Beaches © CityFloodMap.Com 2016
- 7. 2009, 2016 Flooding Eastern Beaches © CityFloodMap.Com 2016
- 8. Digital Elevation Model North York / Newtonbrook © CityFloodMap.Com 2016
- 9. Regulated Valley Including Flood Plain North York / Newtonbrook © CityFloodMap.Com 2016
- 10. Overland Flow Path (10 hectare catchment limit) North York / Newtonbrook © CityFloodMap.Com 2016
- 11. Overland Flow 4x 100 Year Spread North York / Newtonbrook © CityFloodMap.Com 2016
- 13. Digital Elevation Model Hwy 401 & Hwy 404 © CityFloodMap.Com 2016
- 14. Regulated Valley Including Flood Plain Hwy 401 & Hwy 404 © CityFloodMap.Com 2016
- 15. Overland Flow Spread (100-Year, 10 ha limit) Hwy 401 & Hwy 404 © CityFloodMap.Com 2016
- 16. Overland Flow 4x 100-Year Spread Hwy 401 & Hwy 404 © CityFloodMap.Com 2016
- 17. Basement Flooding (2000,2005,2013) Hwy 401 & Hwy 404 © CityFloodMap.Com 2016
- 19. Regulated Valley Including Flood Plain Etobicoke © CityFloodMap.Com 2016
- 20. Overland Flow Path (2 hectare catchment limit) Etobicoke © CityFloodMap.Com 2016
- 21. Overland Flow 4x 100-Year Spread on 10 ha Areas Etobicoke © CityFloodMap.Com 2016
Editor's Notes
- DEM
- Regulated valley excluding shore
- Overland flow path
- Overland flow spread
- Reported flooding 2000 2005 2013
- Overland flow spread