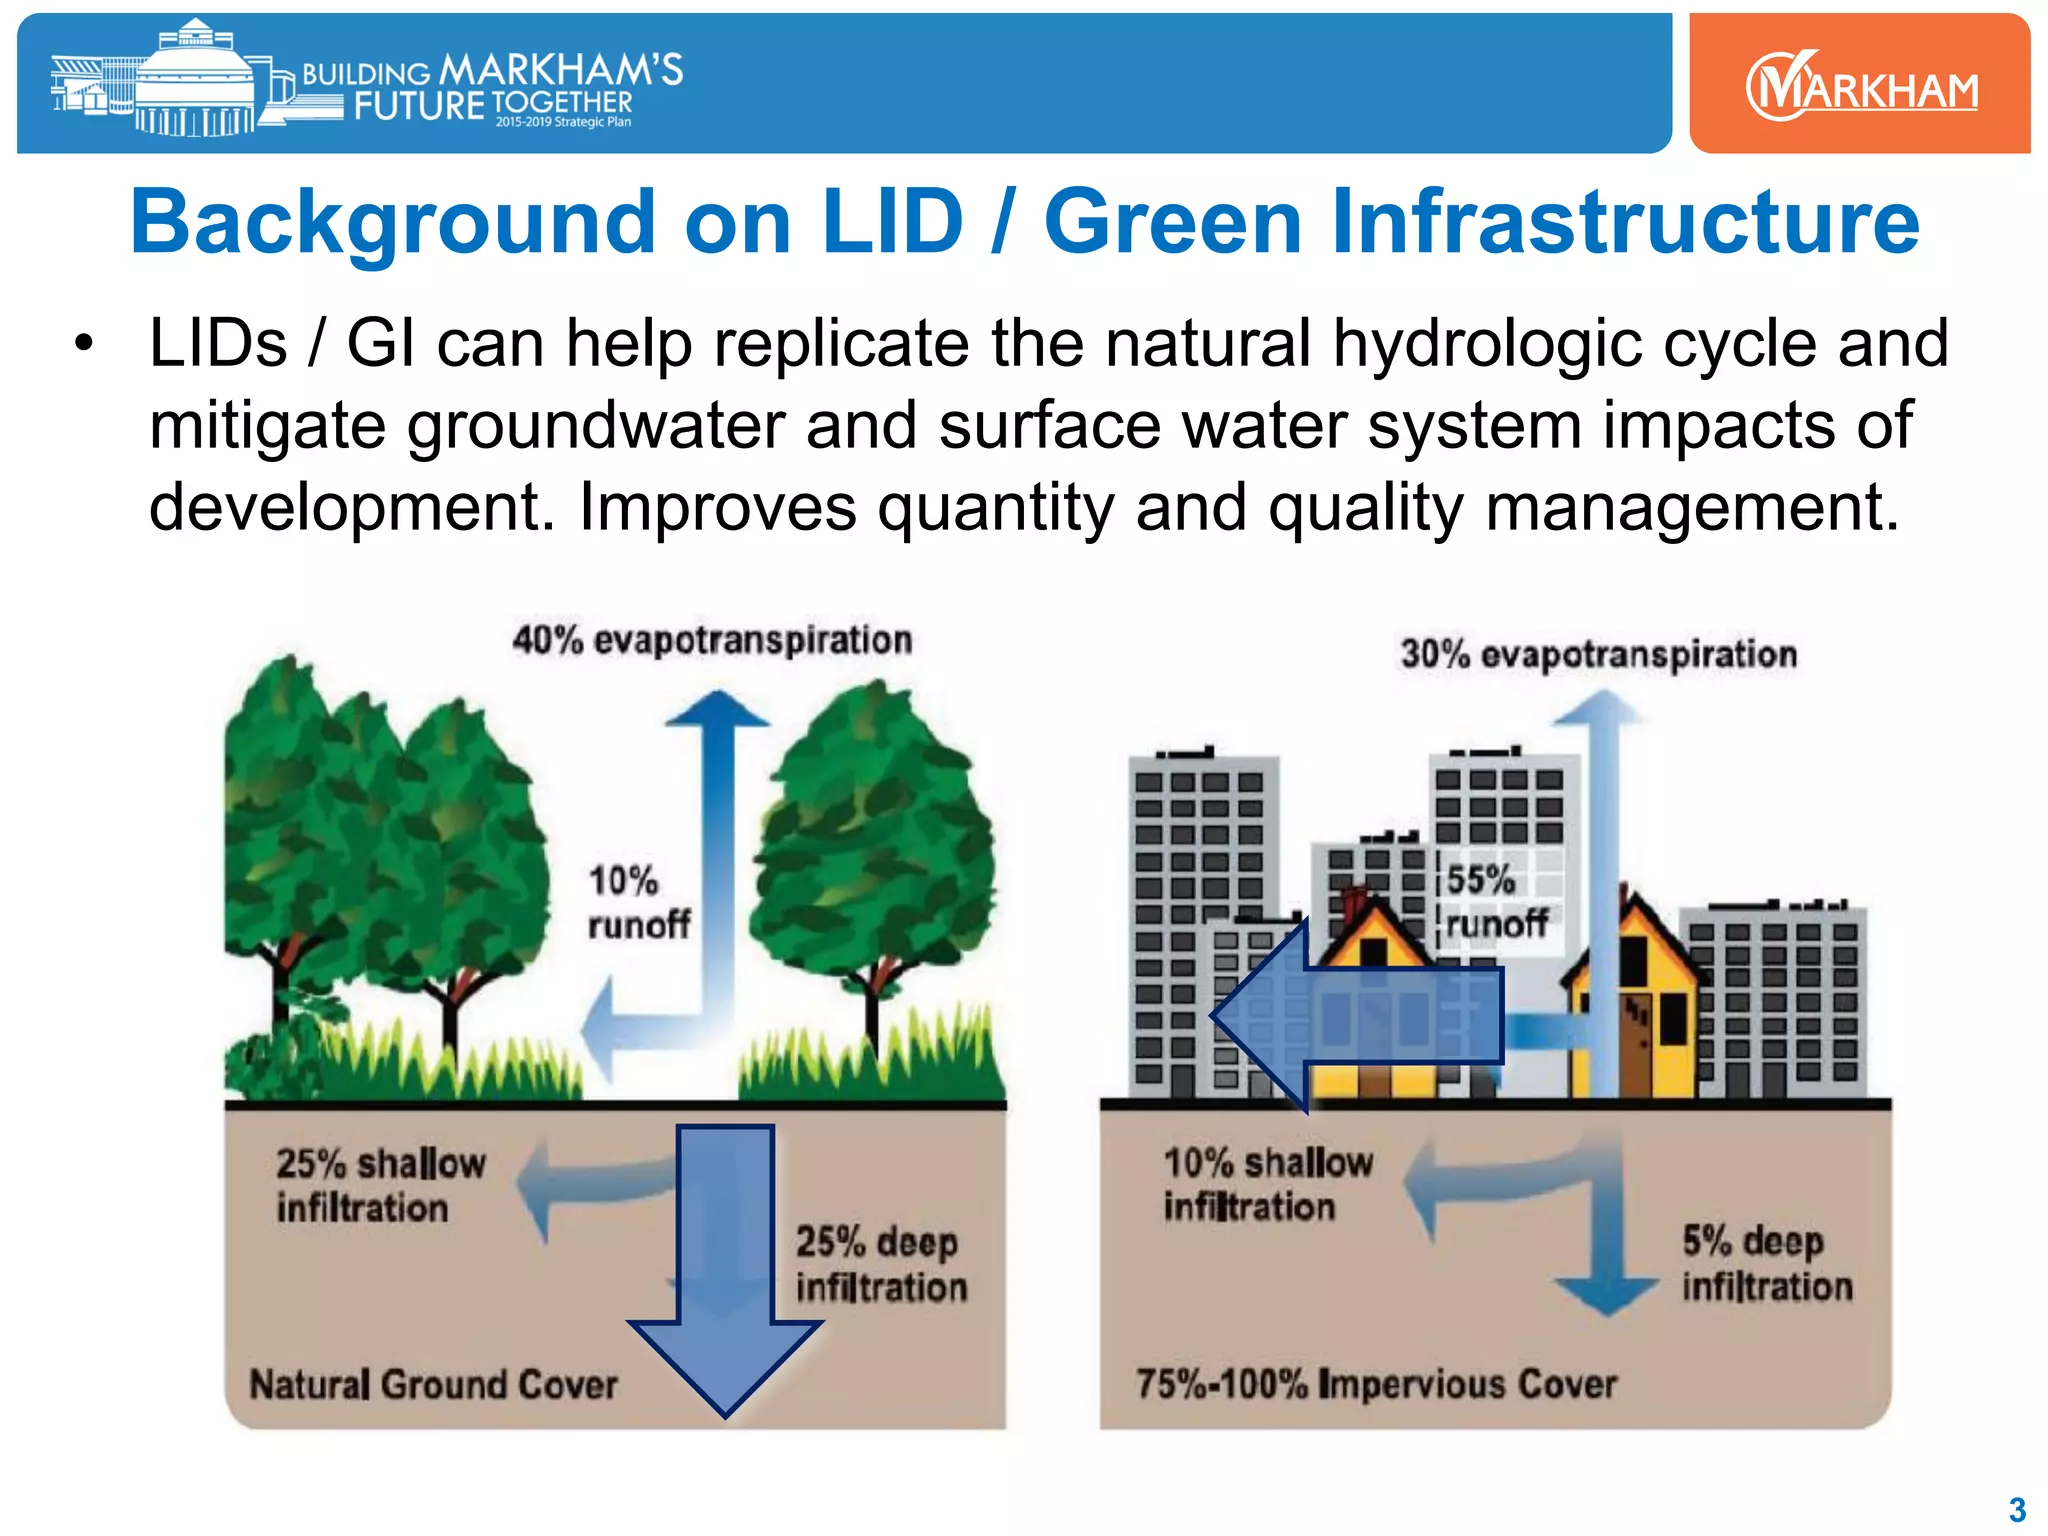
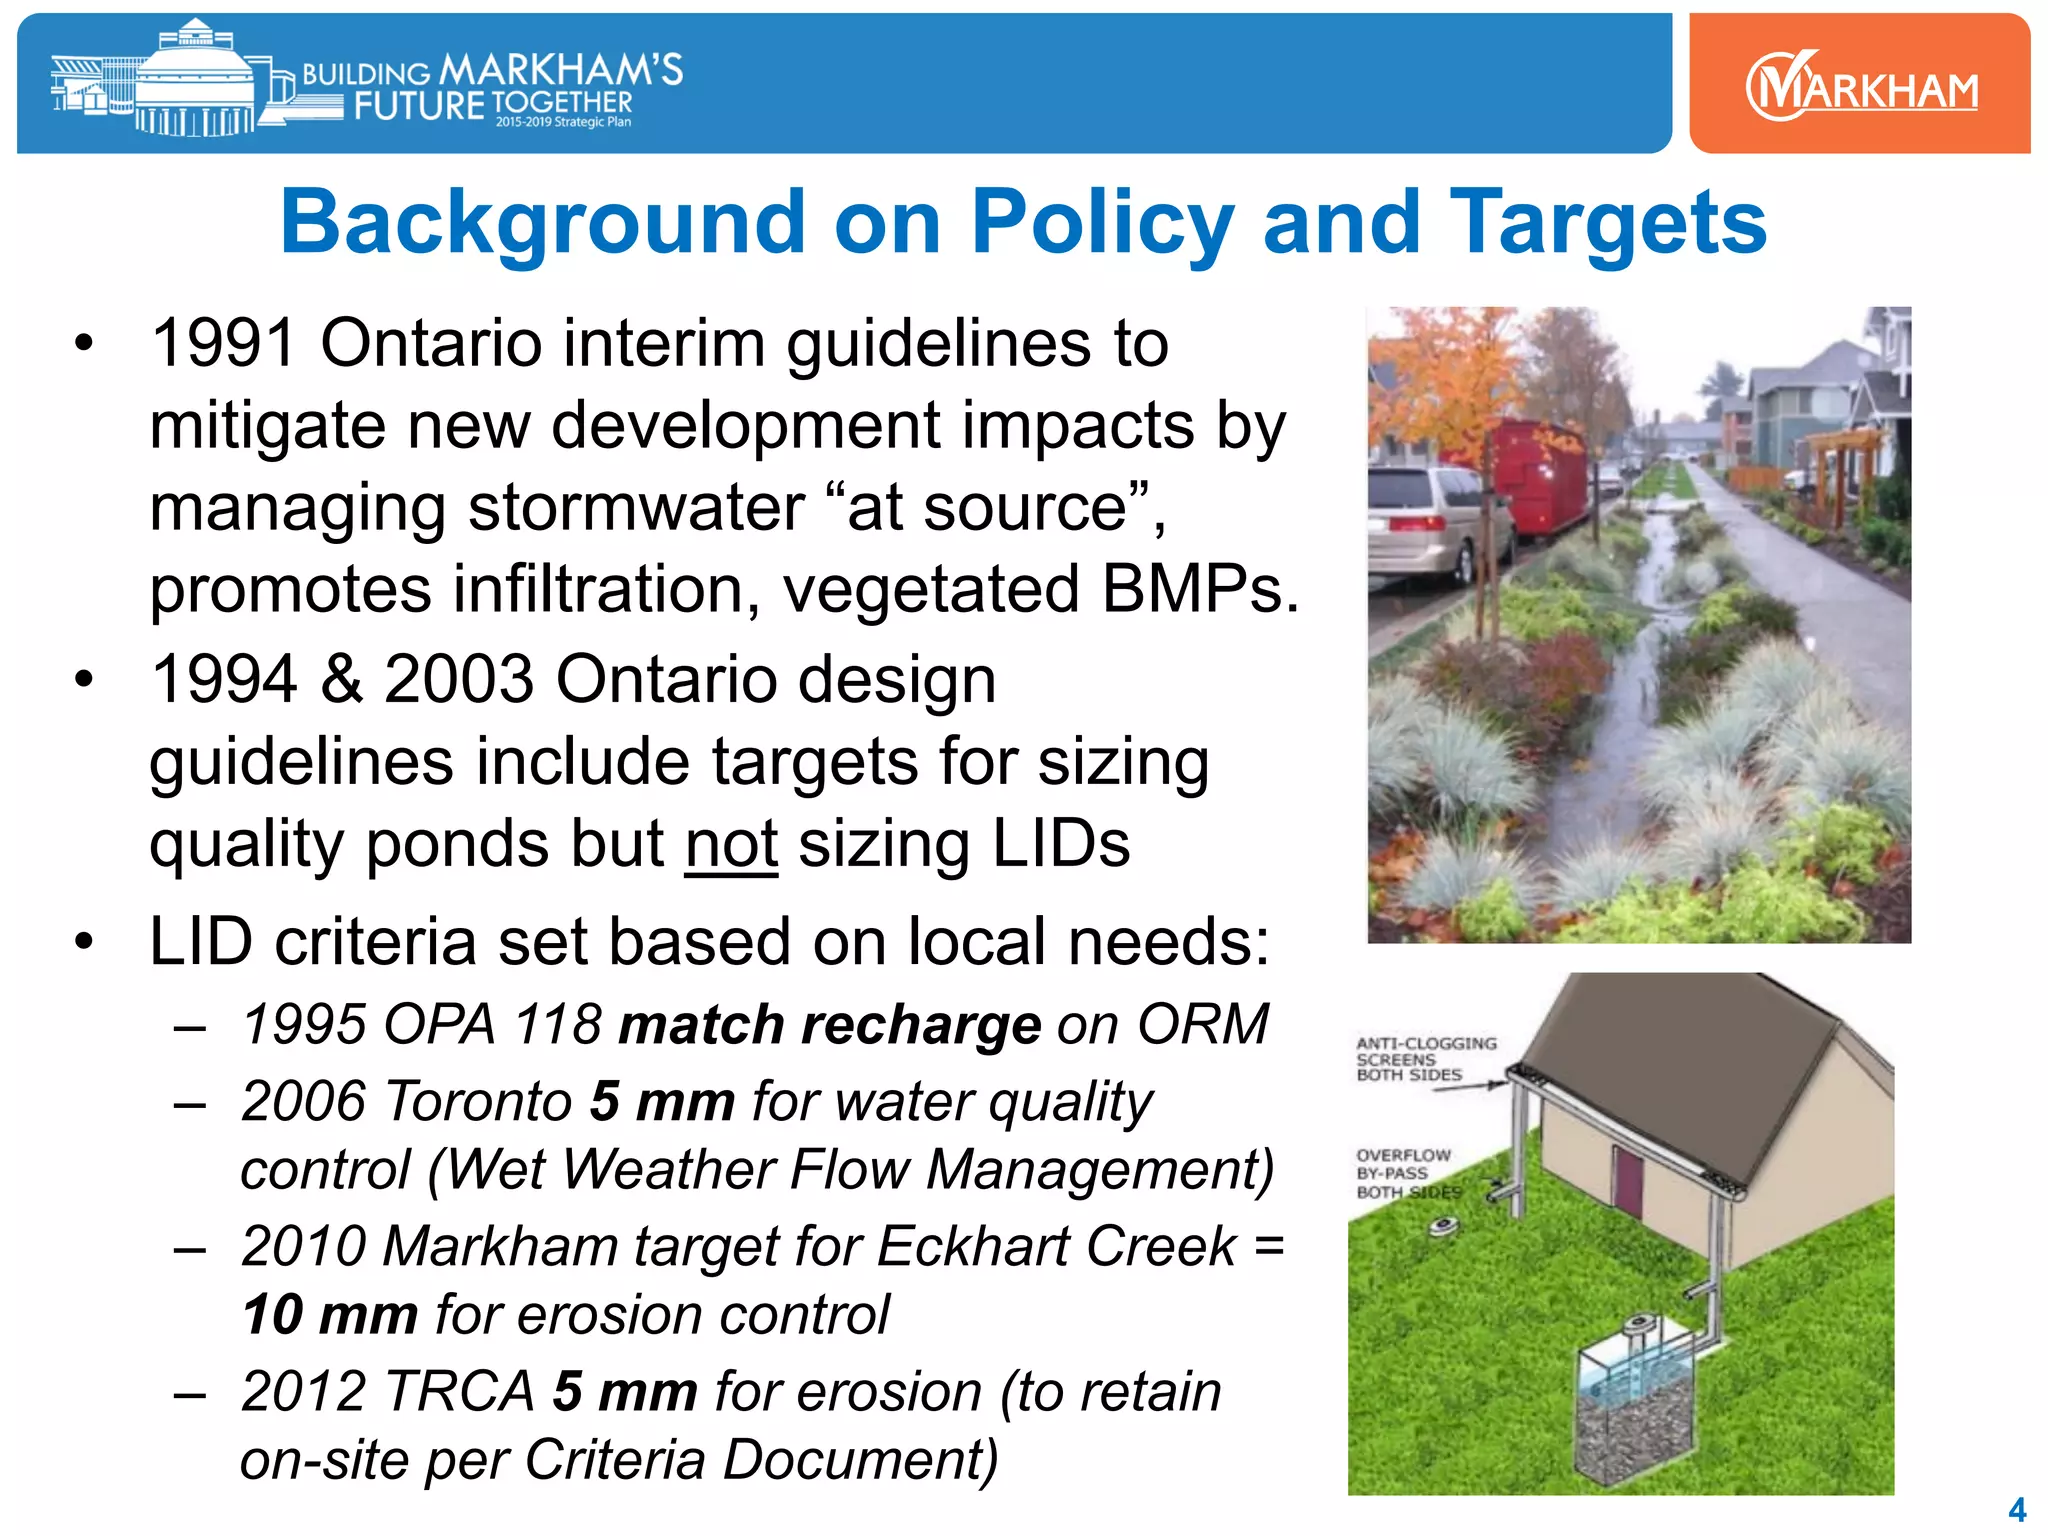
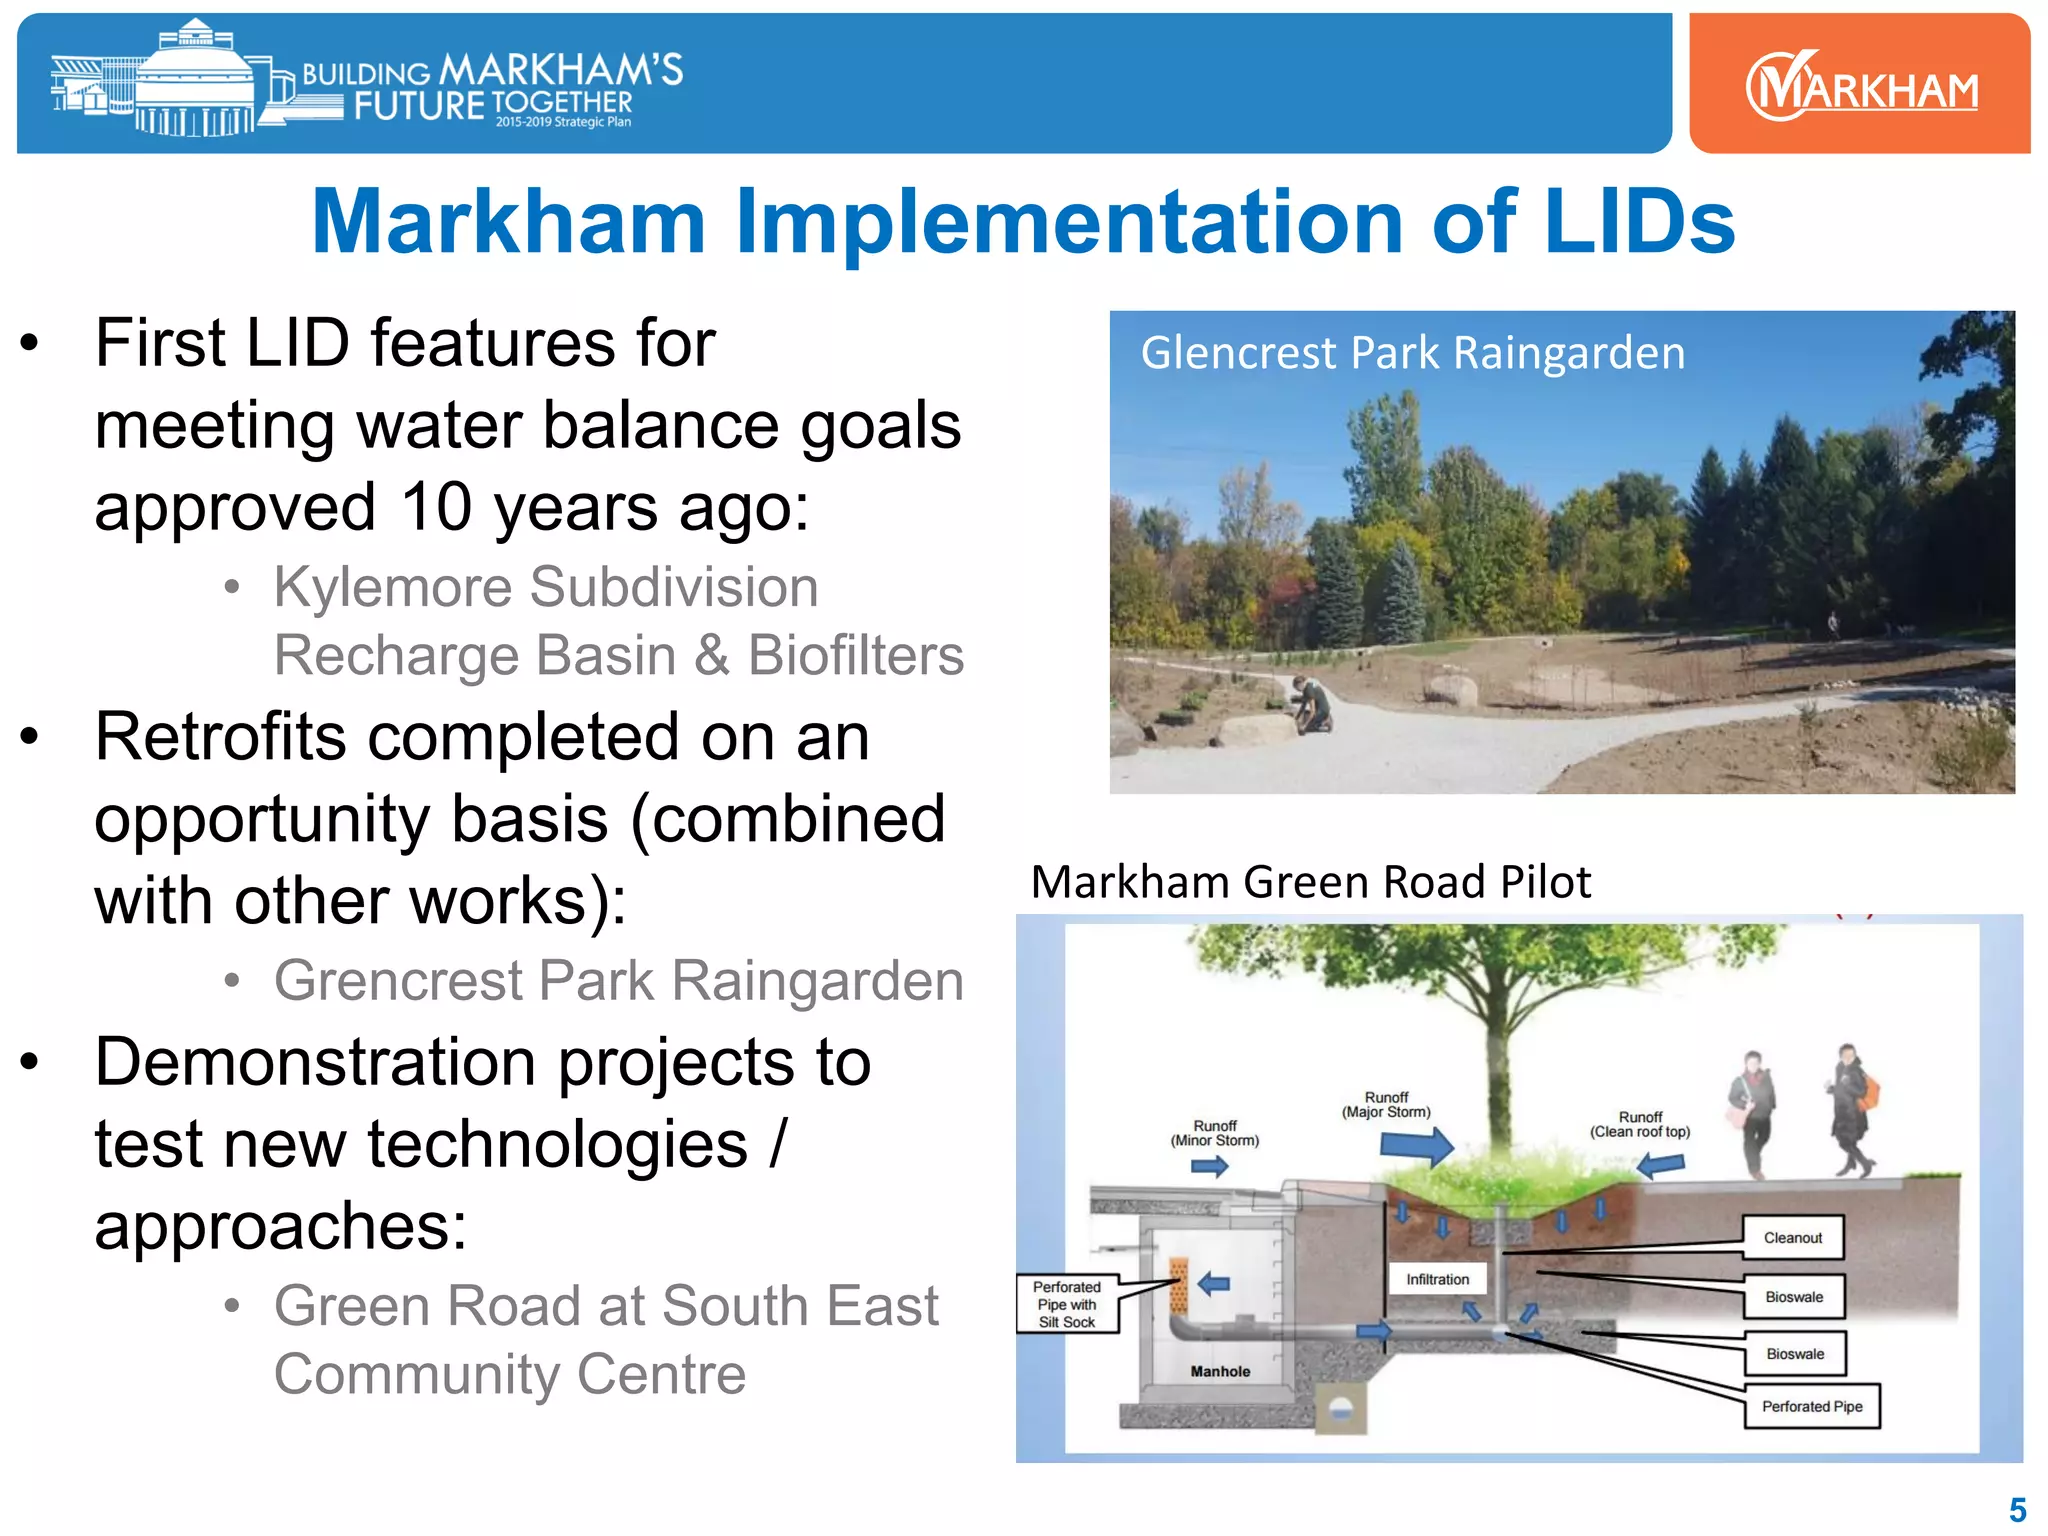
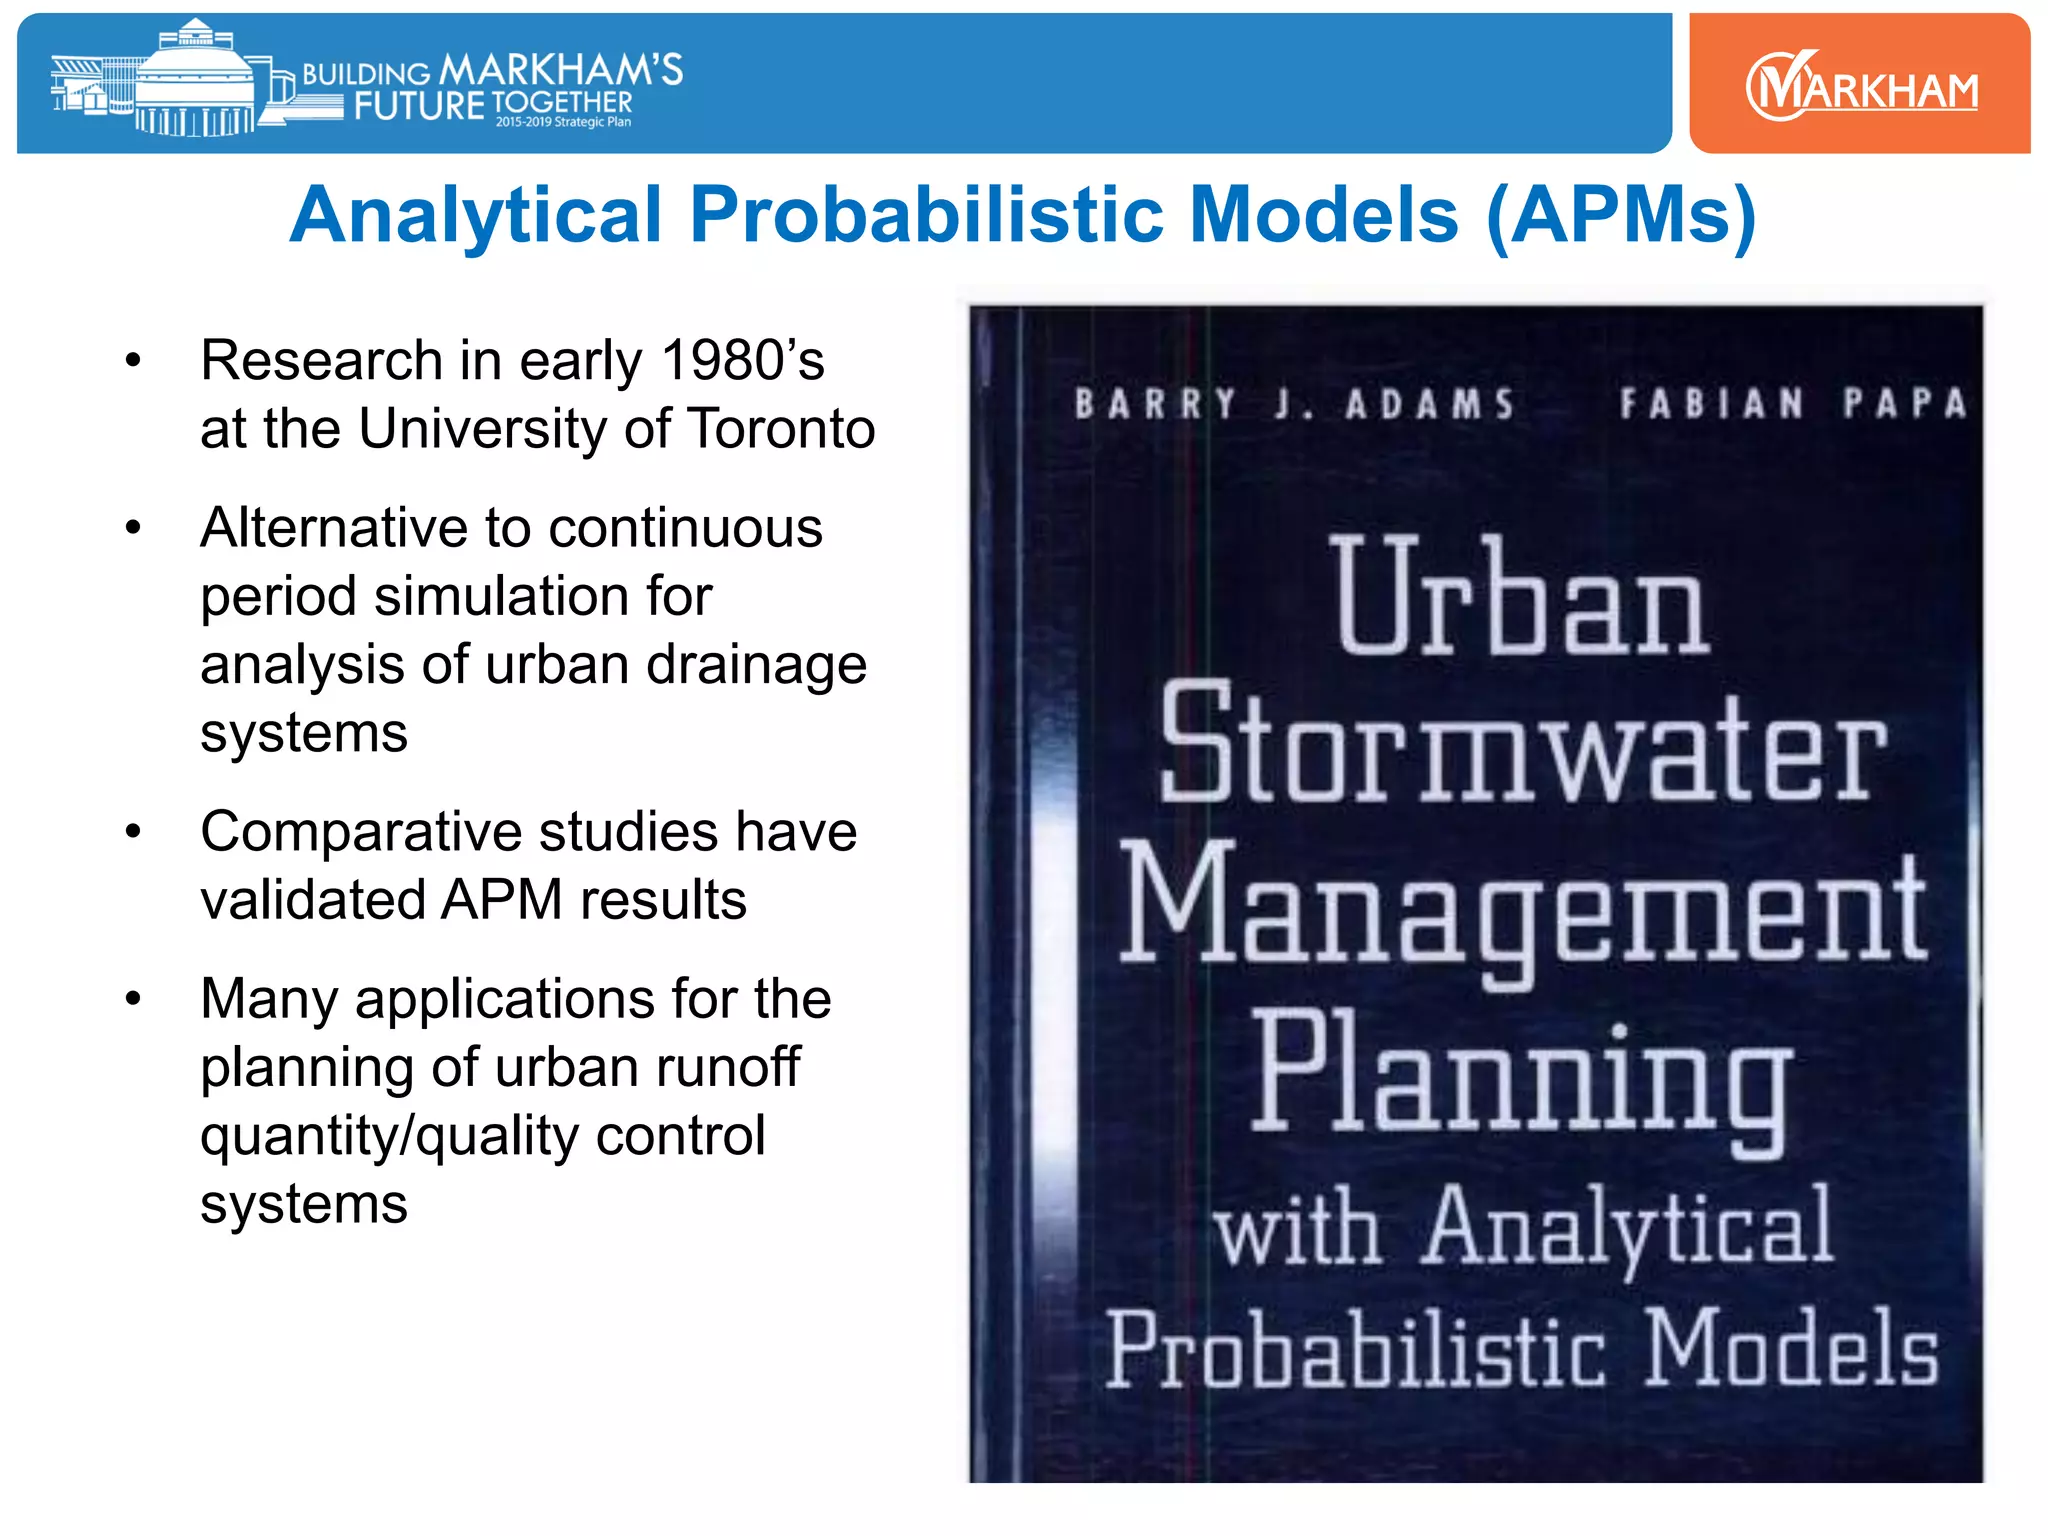
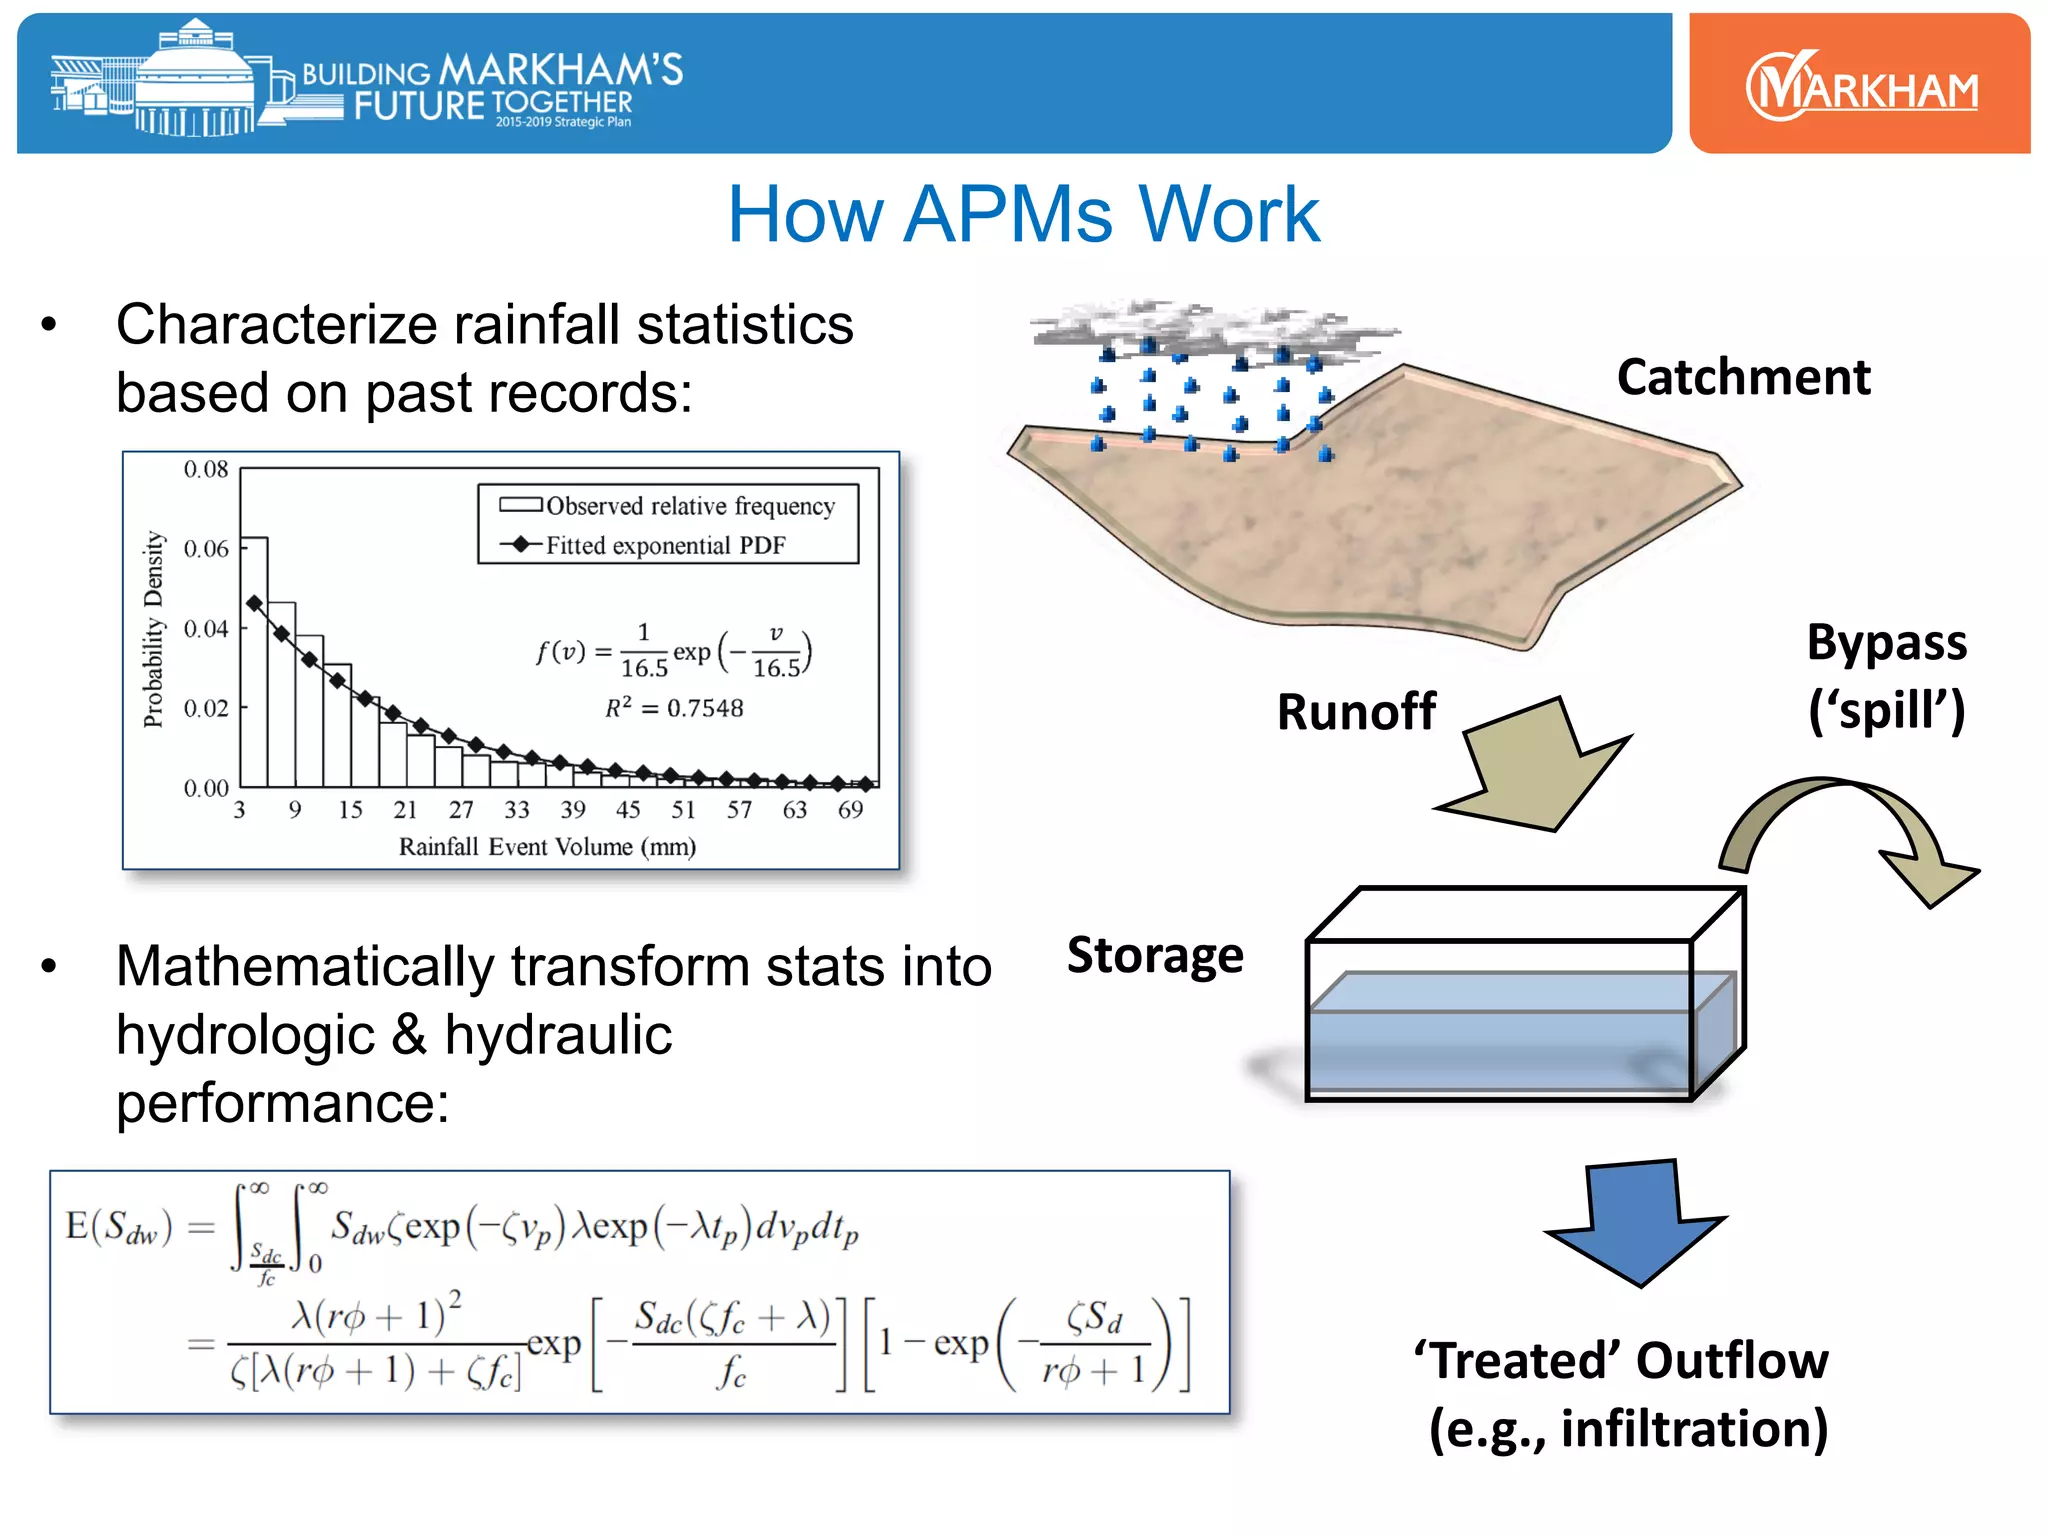
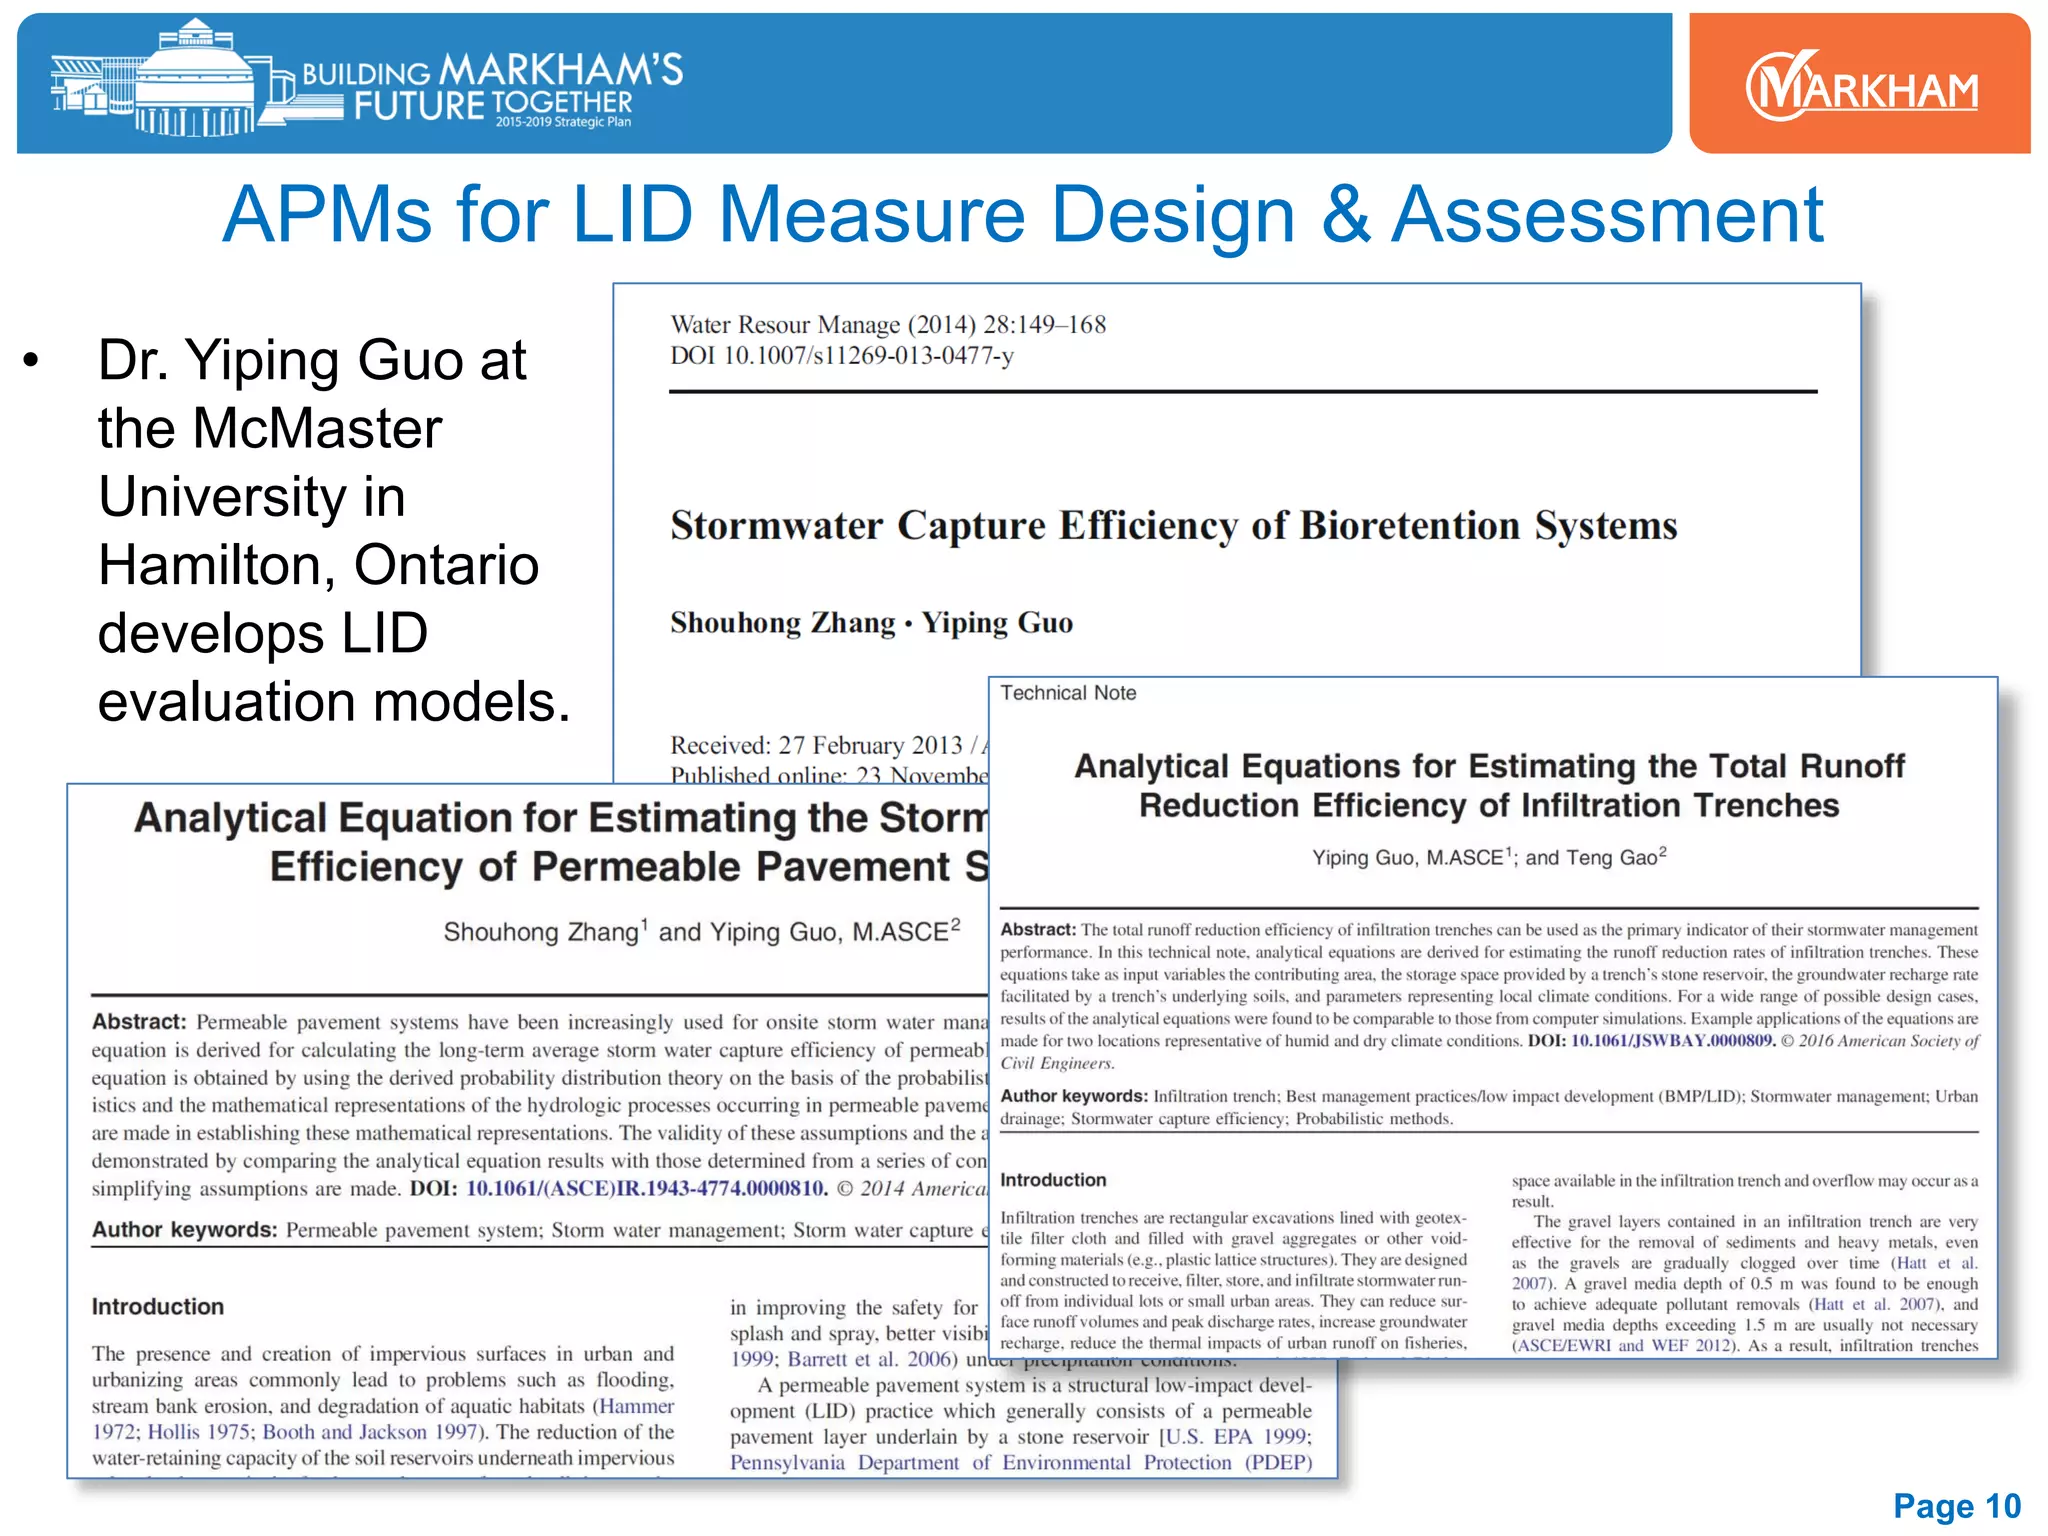
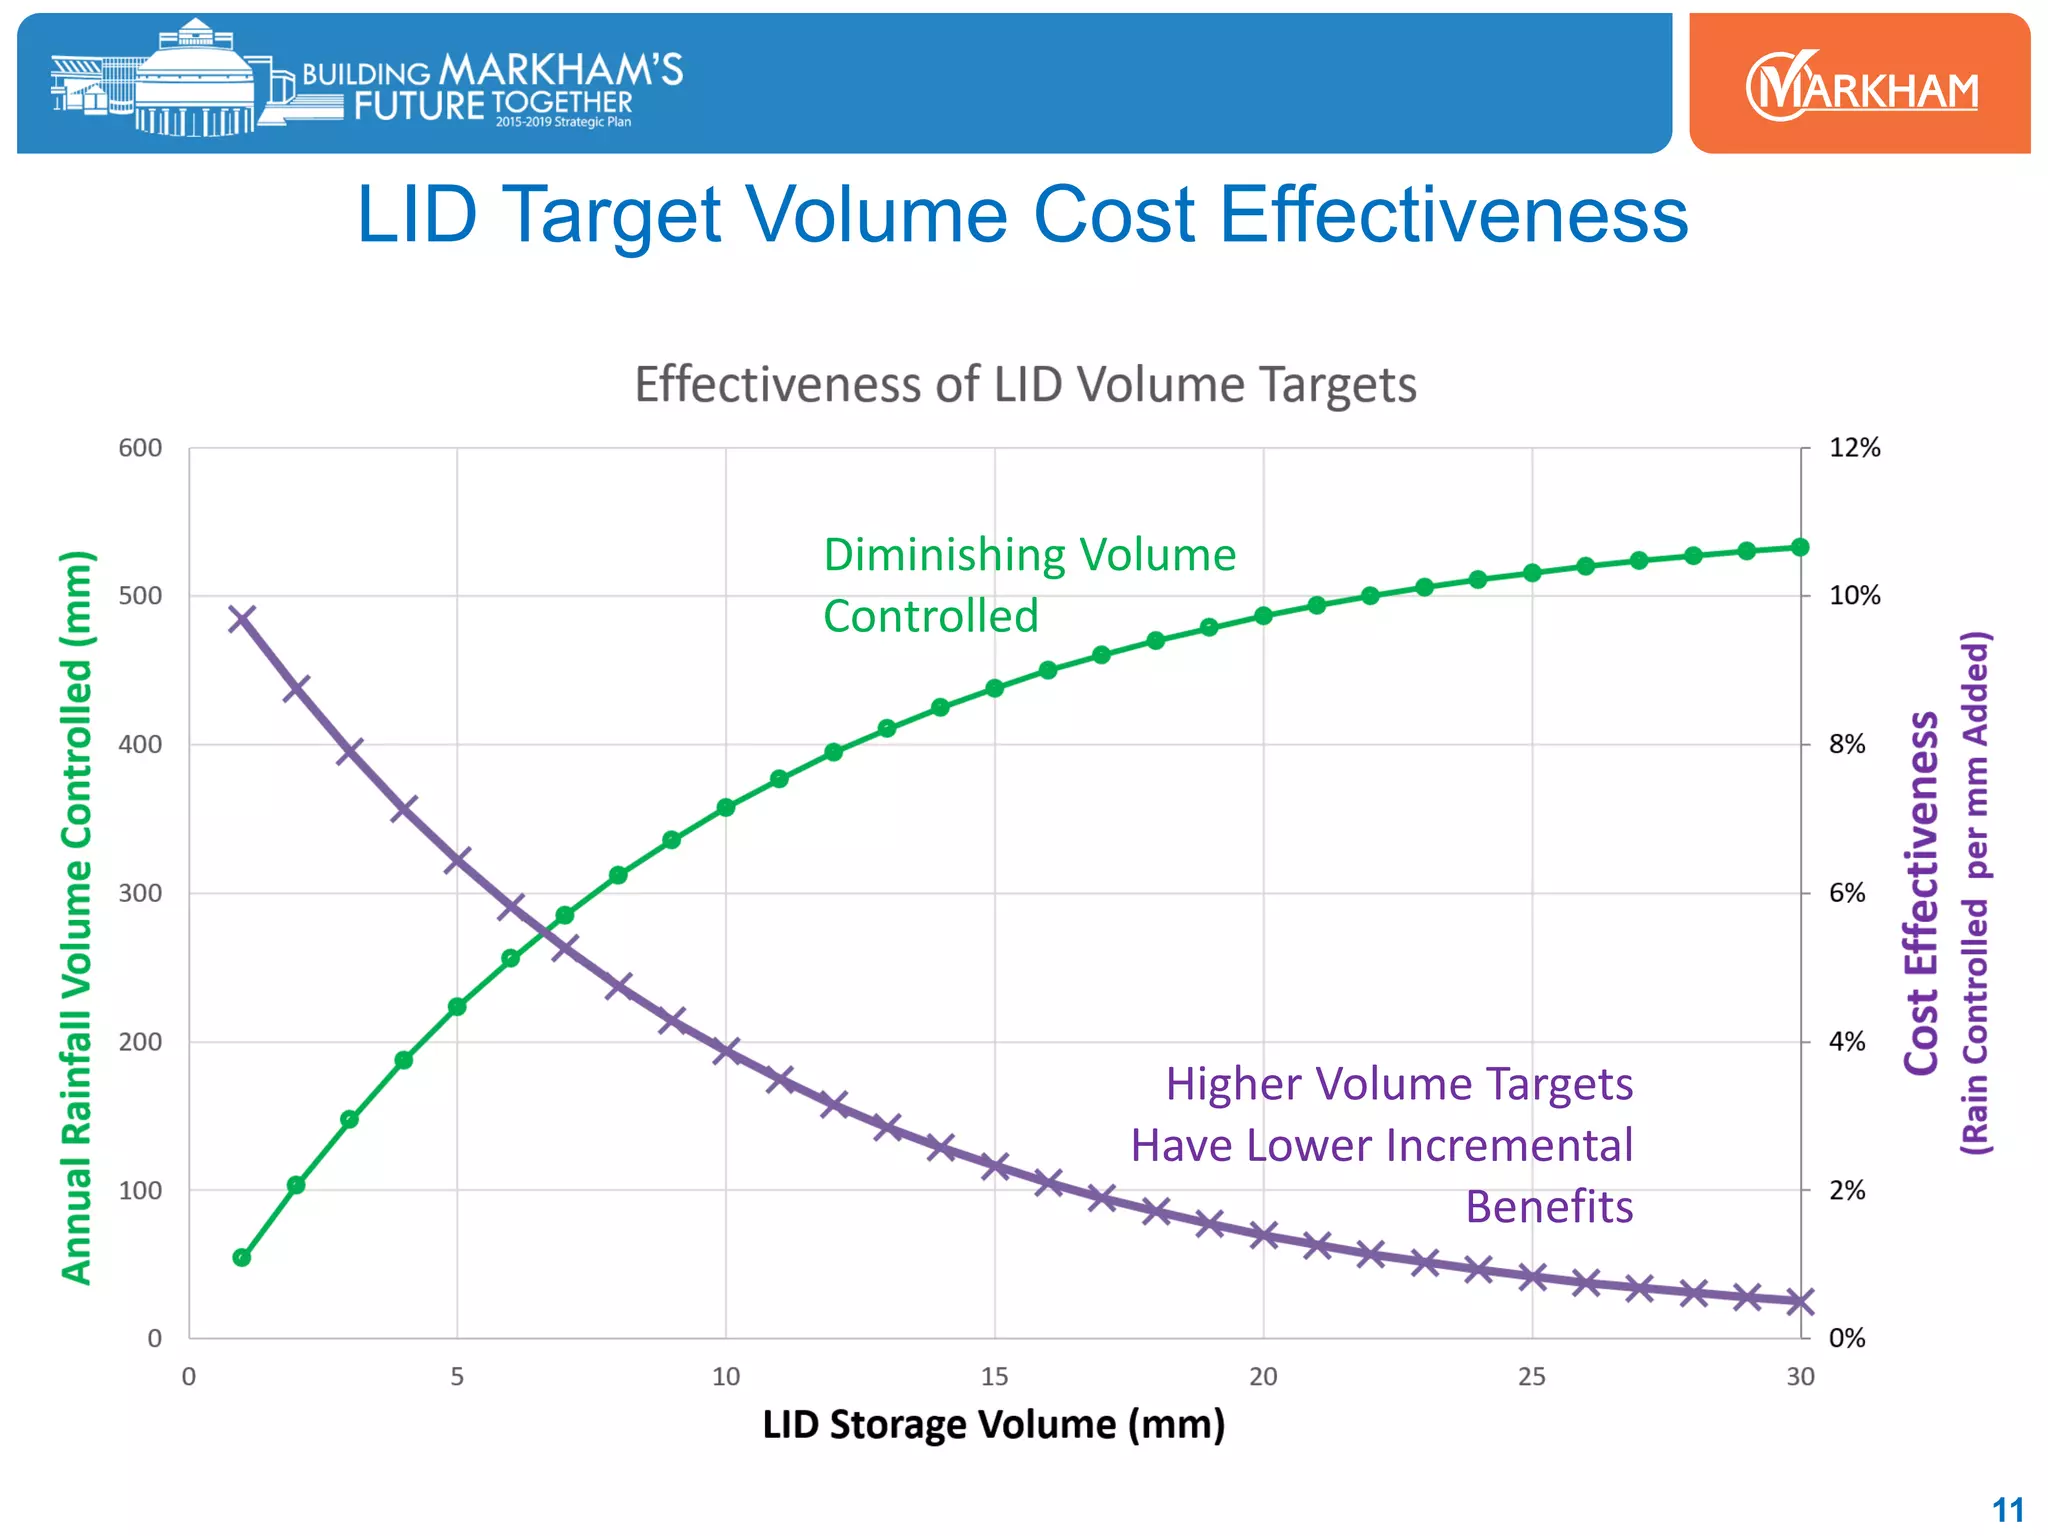
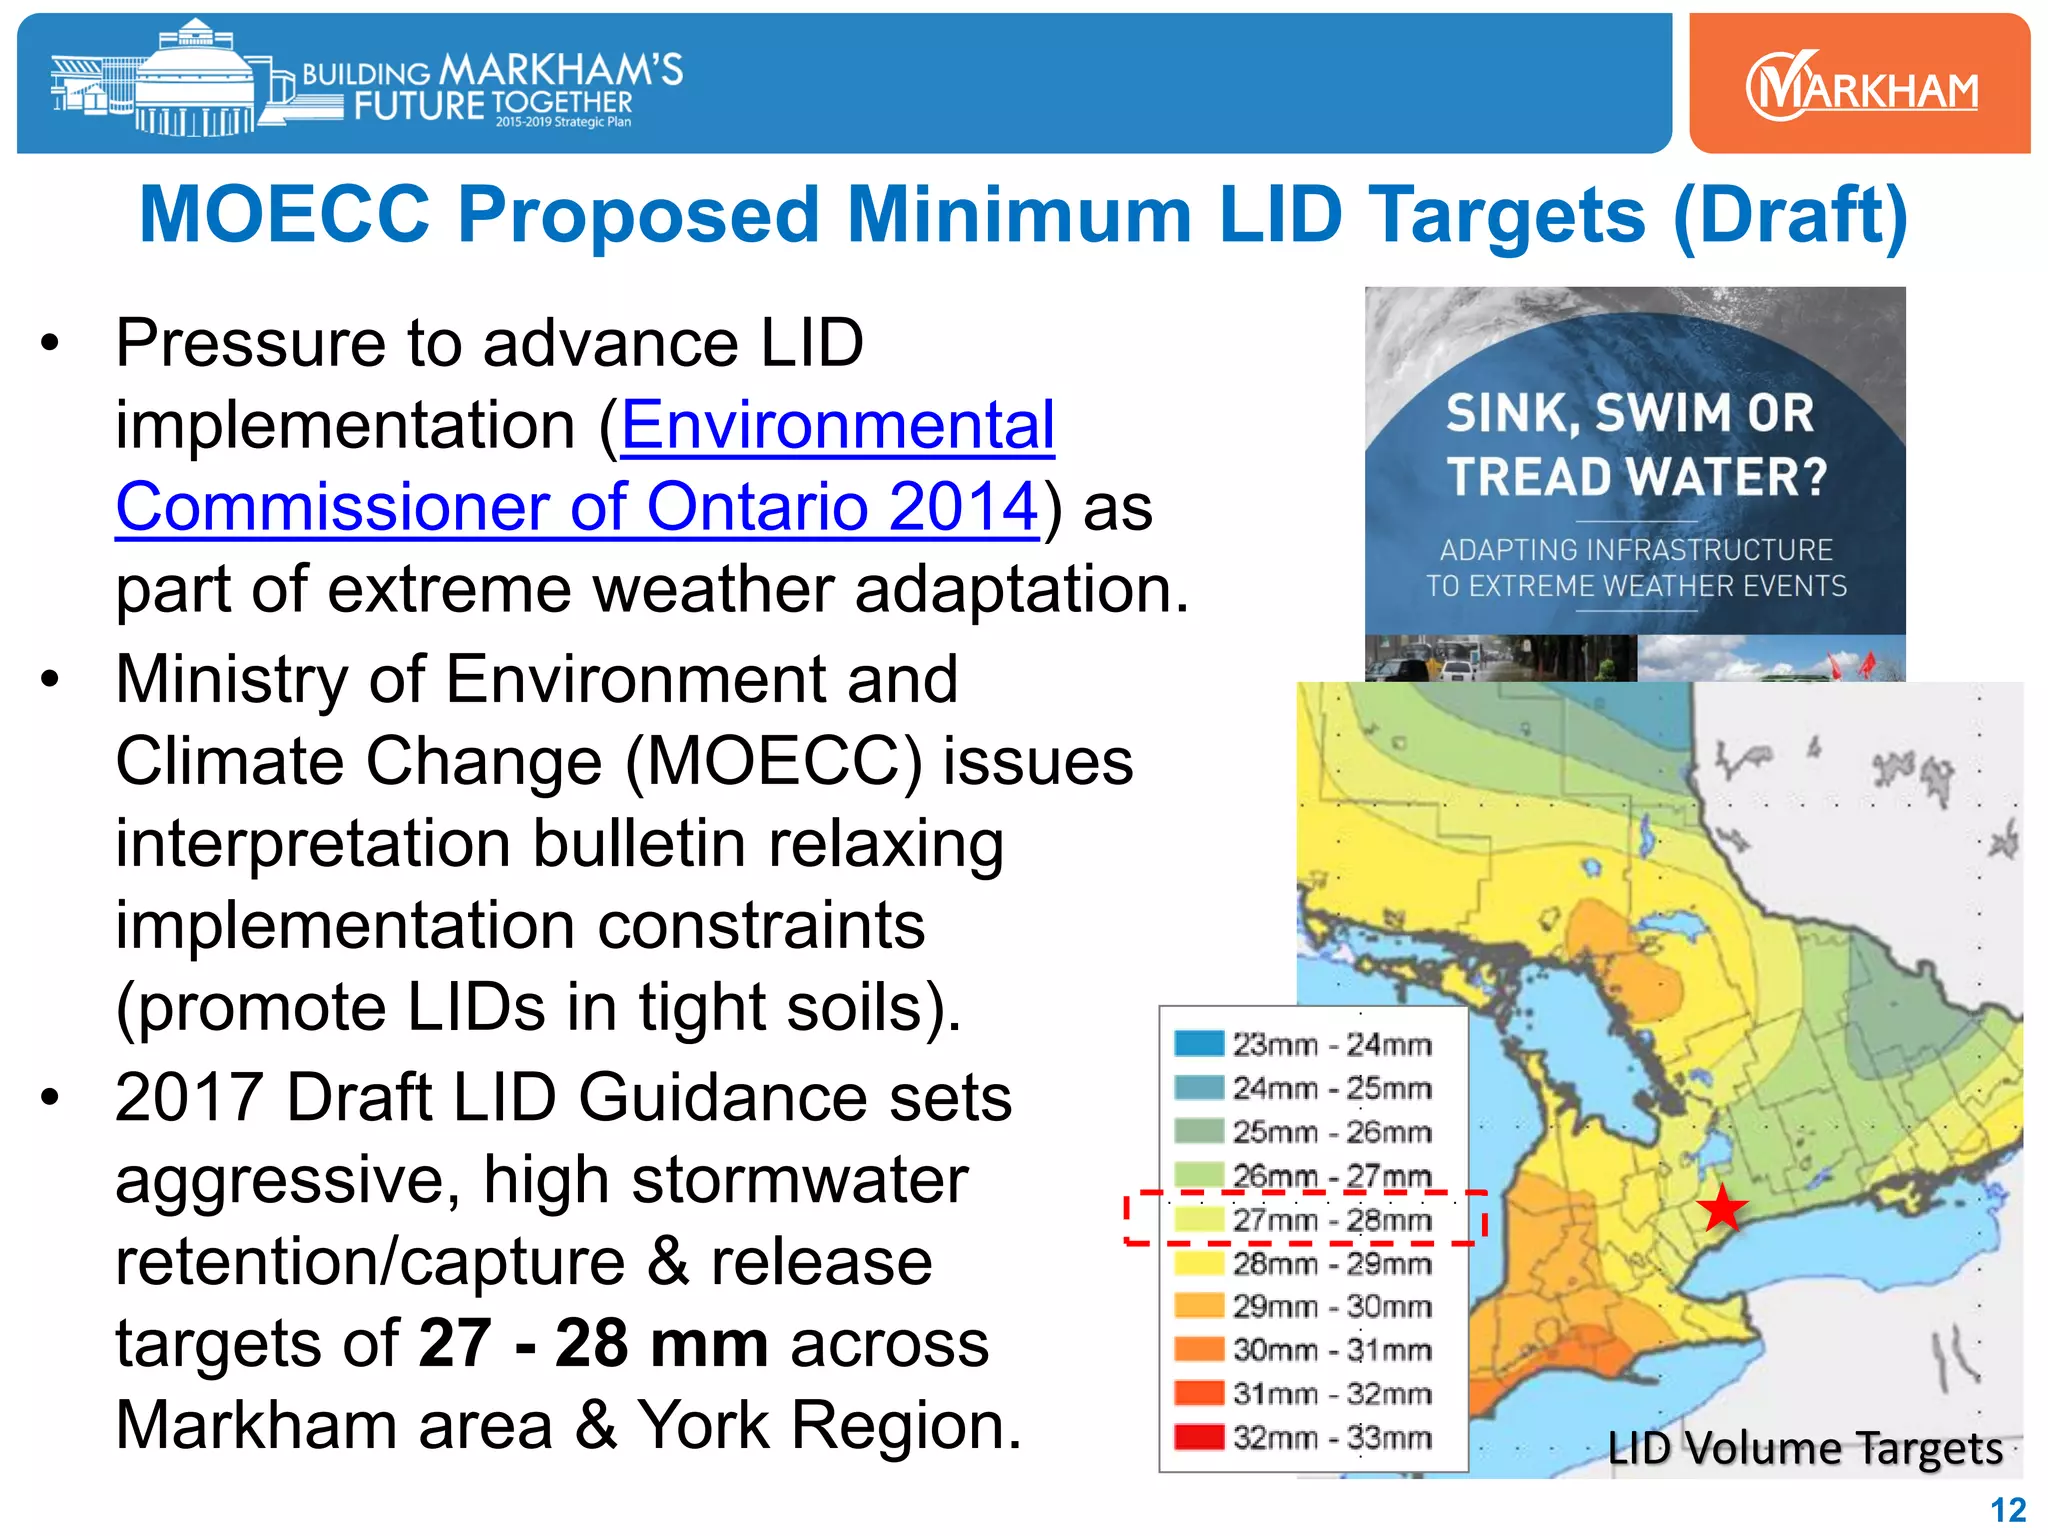
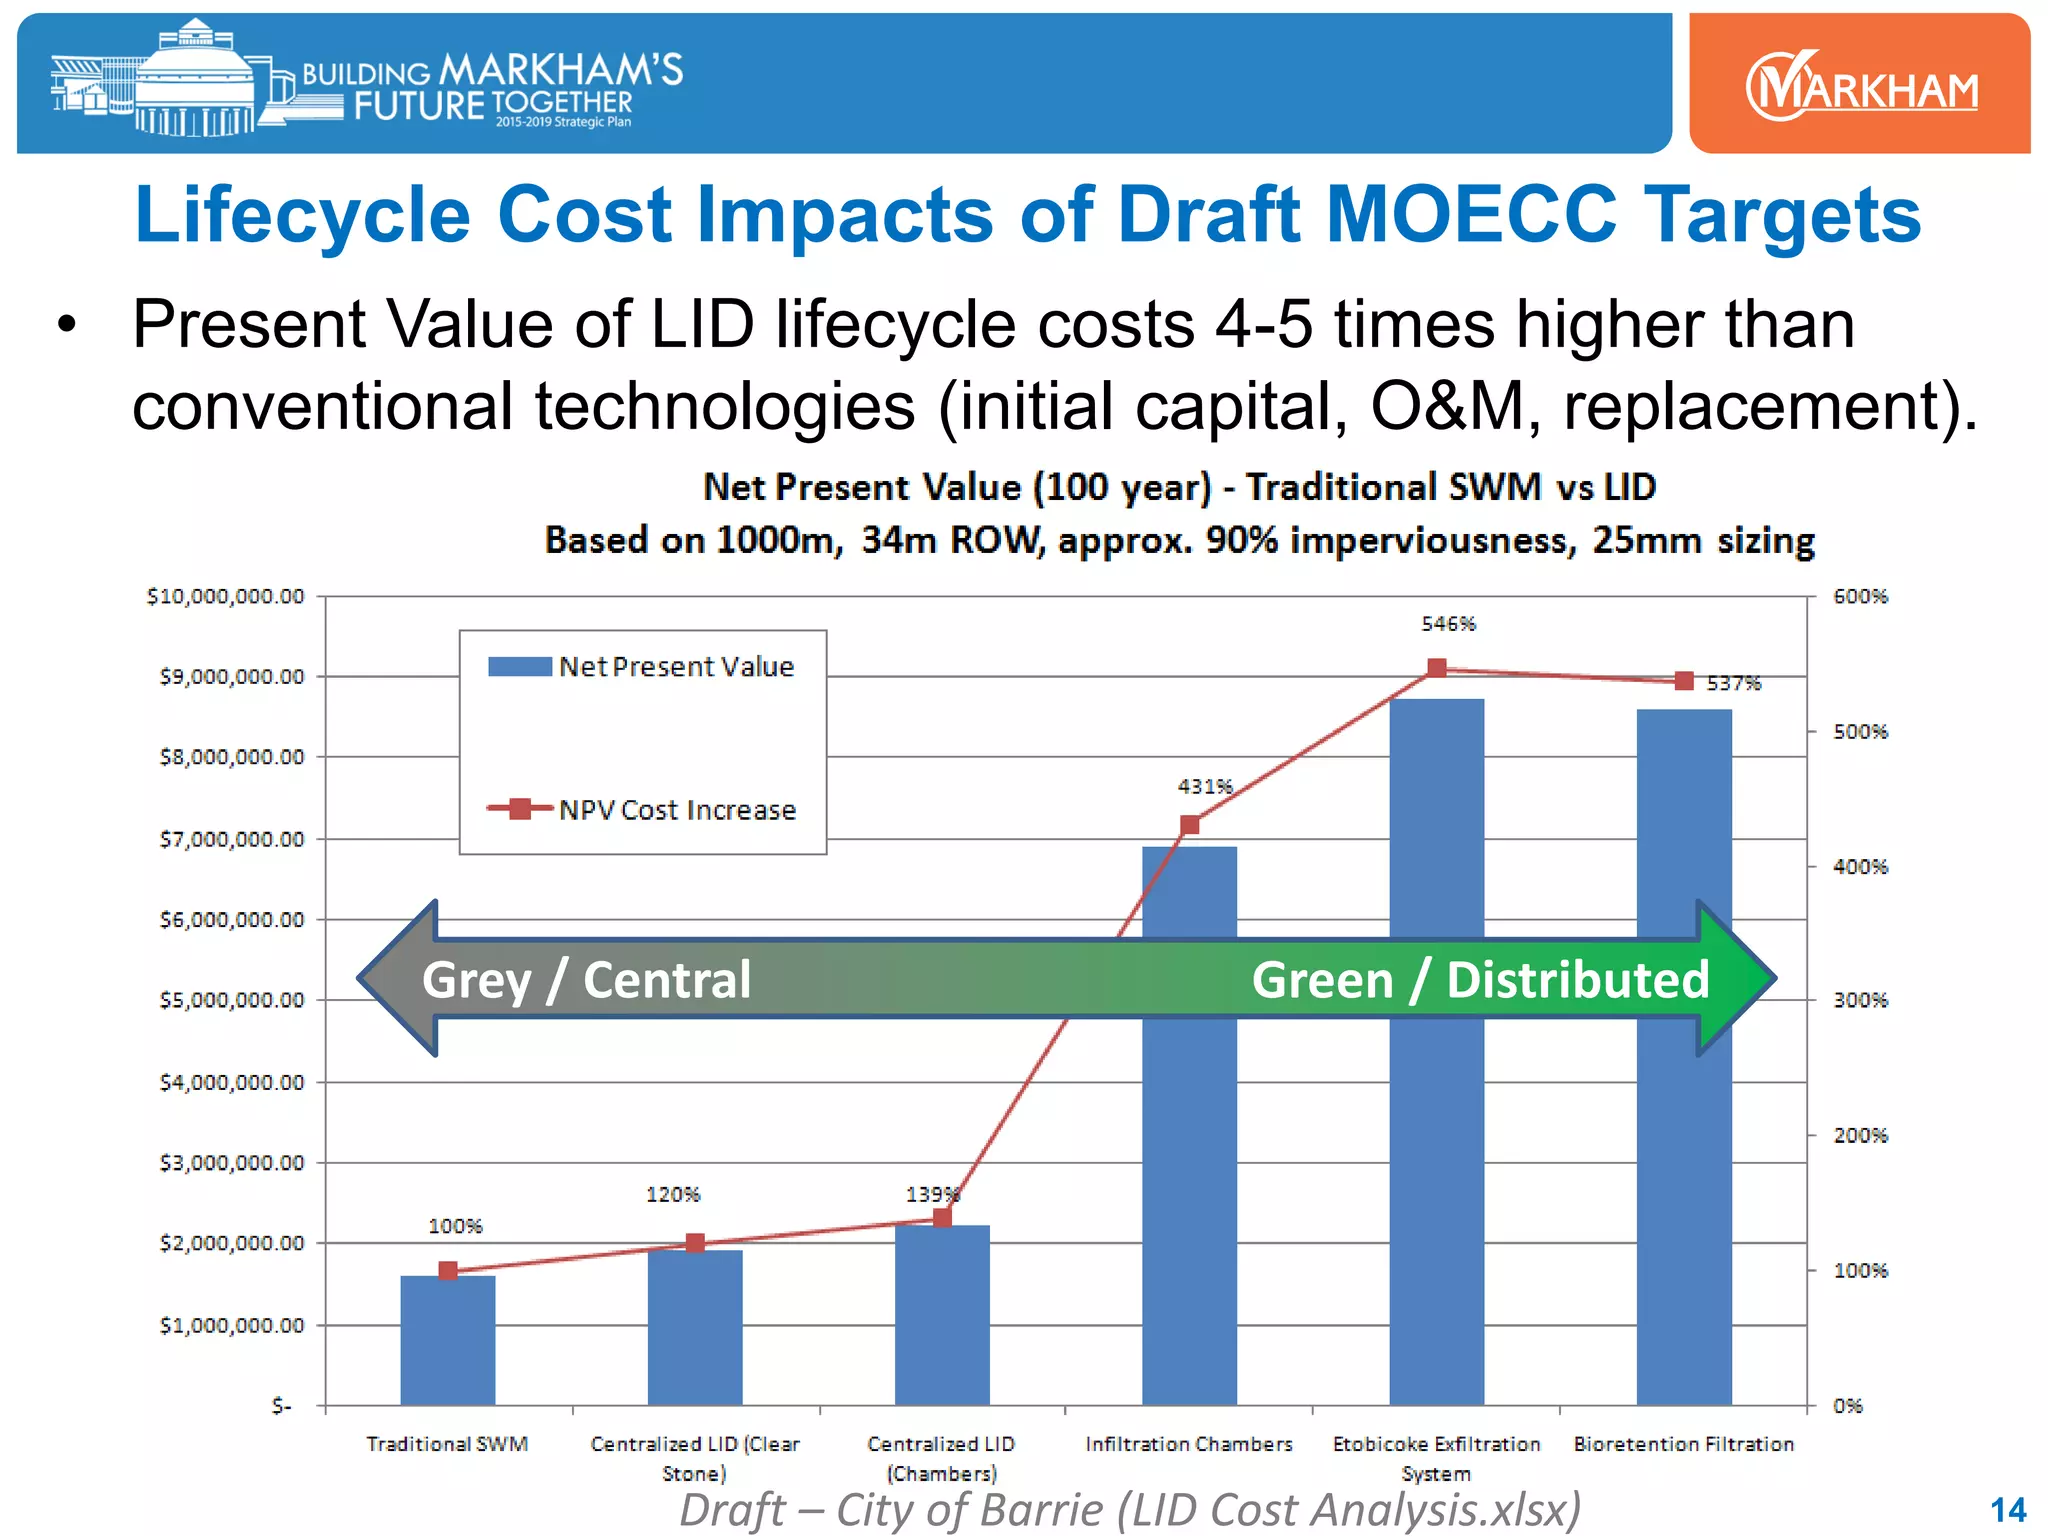
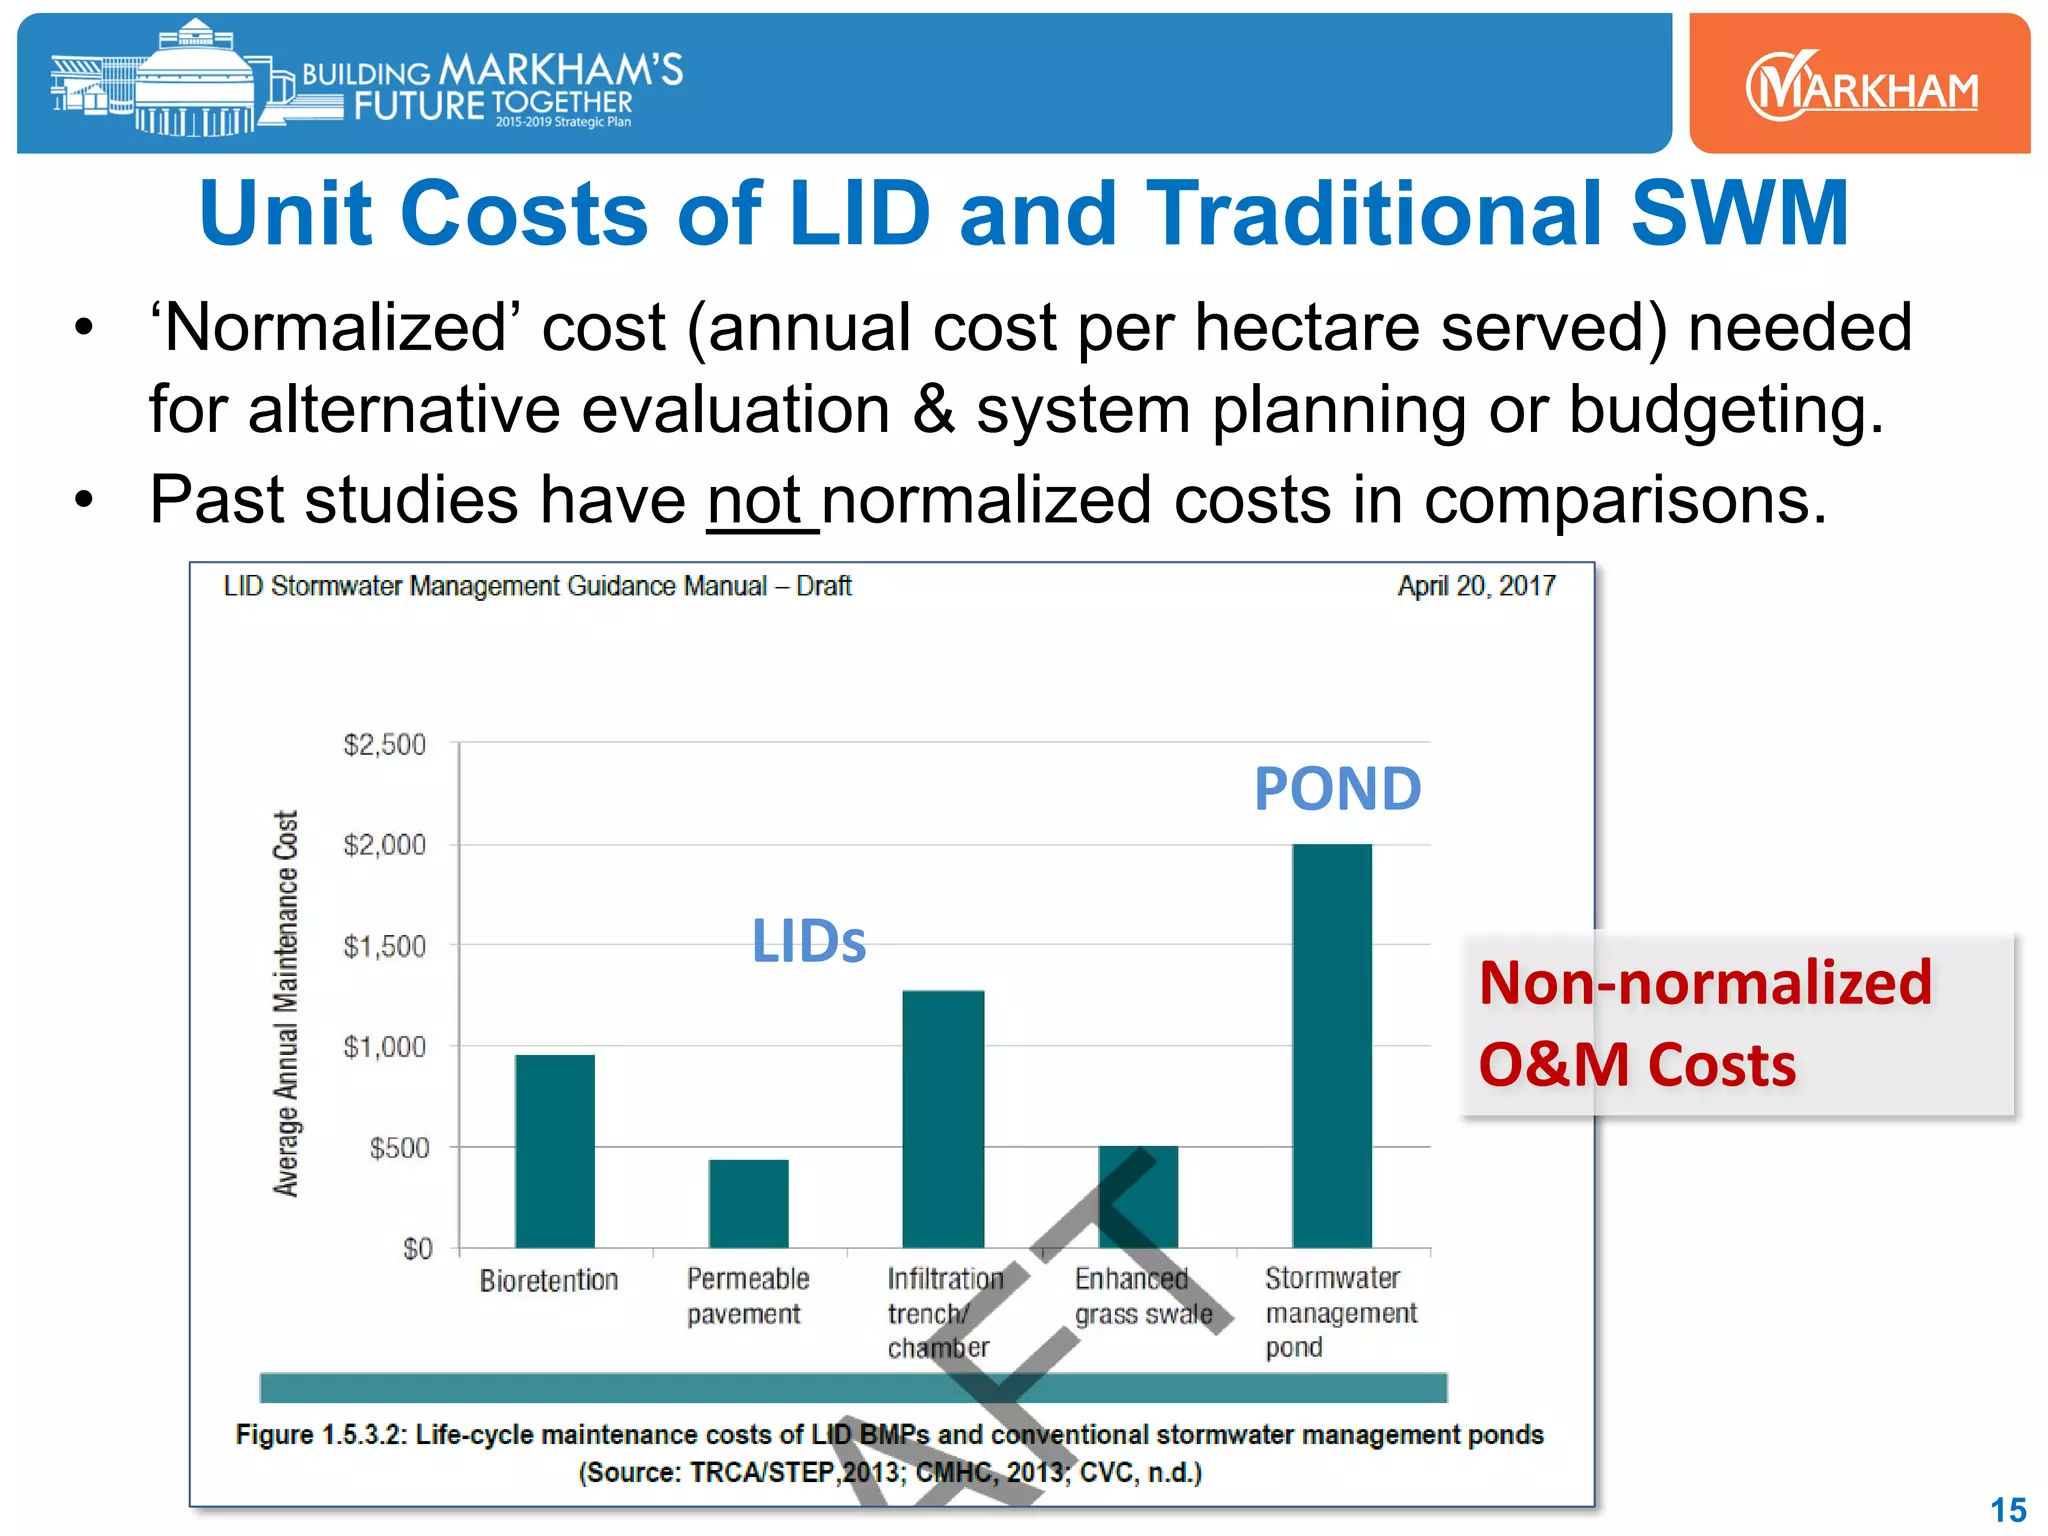
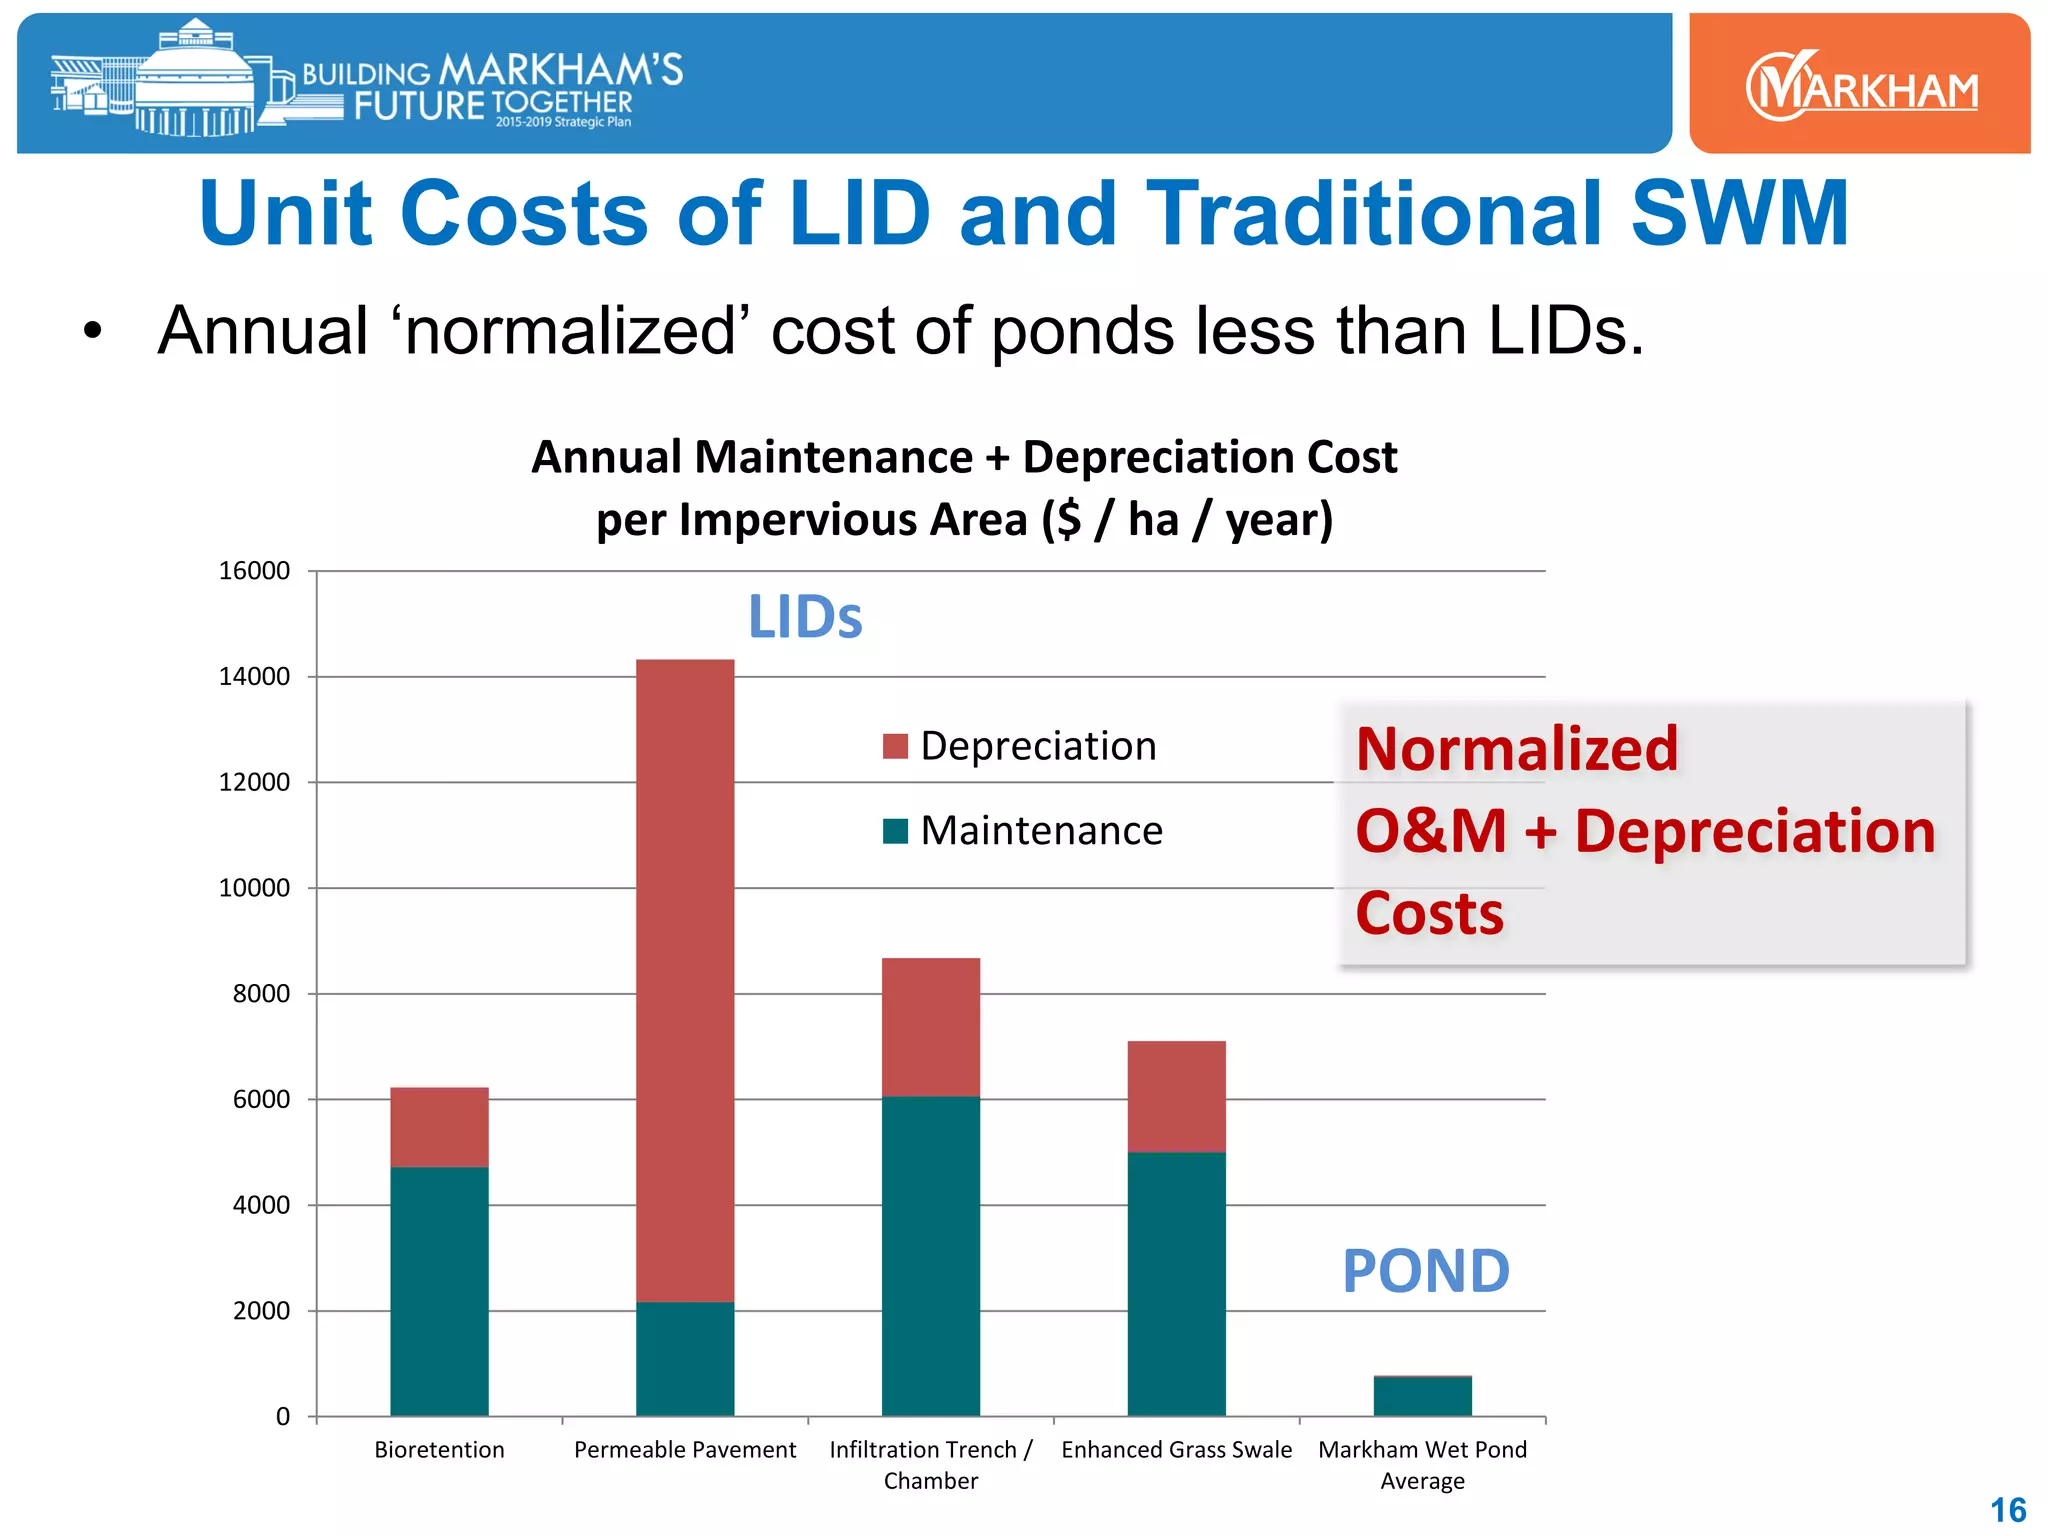
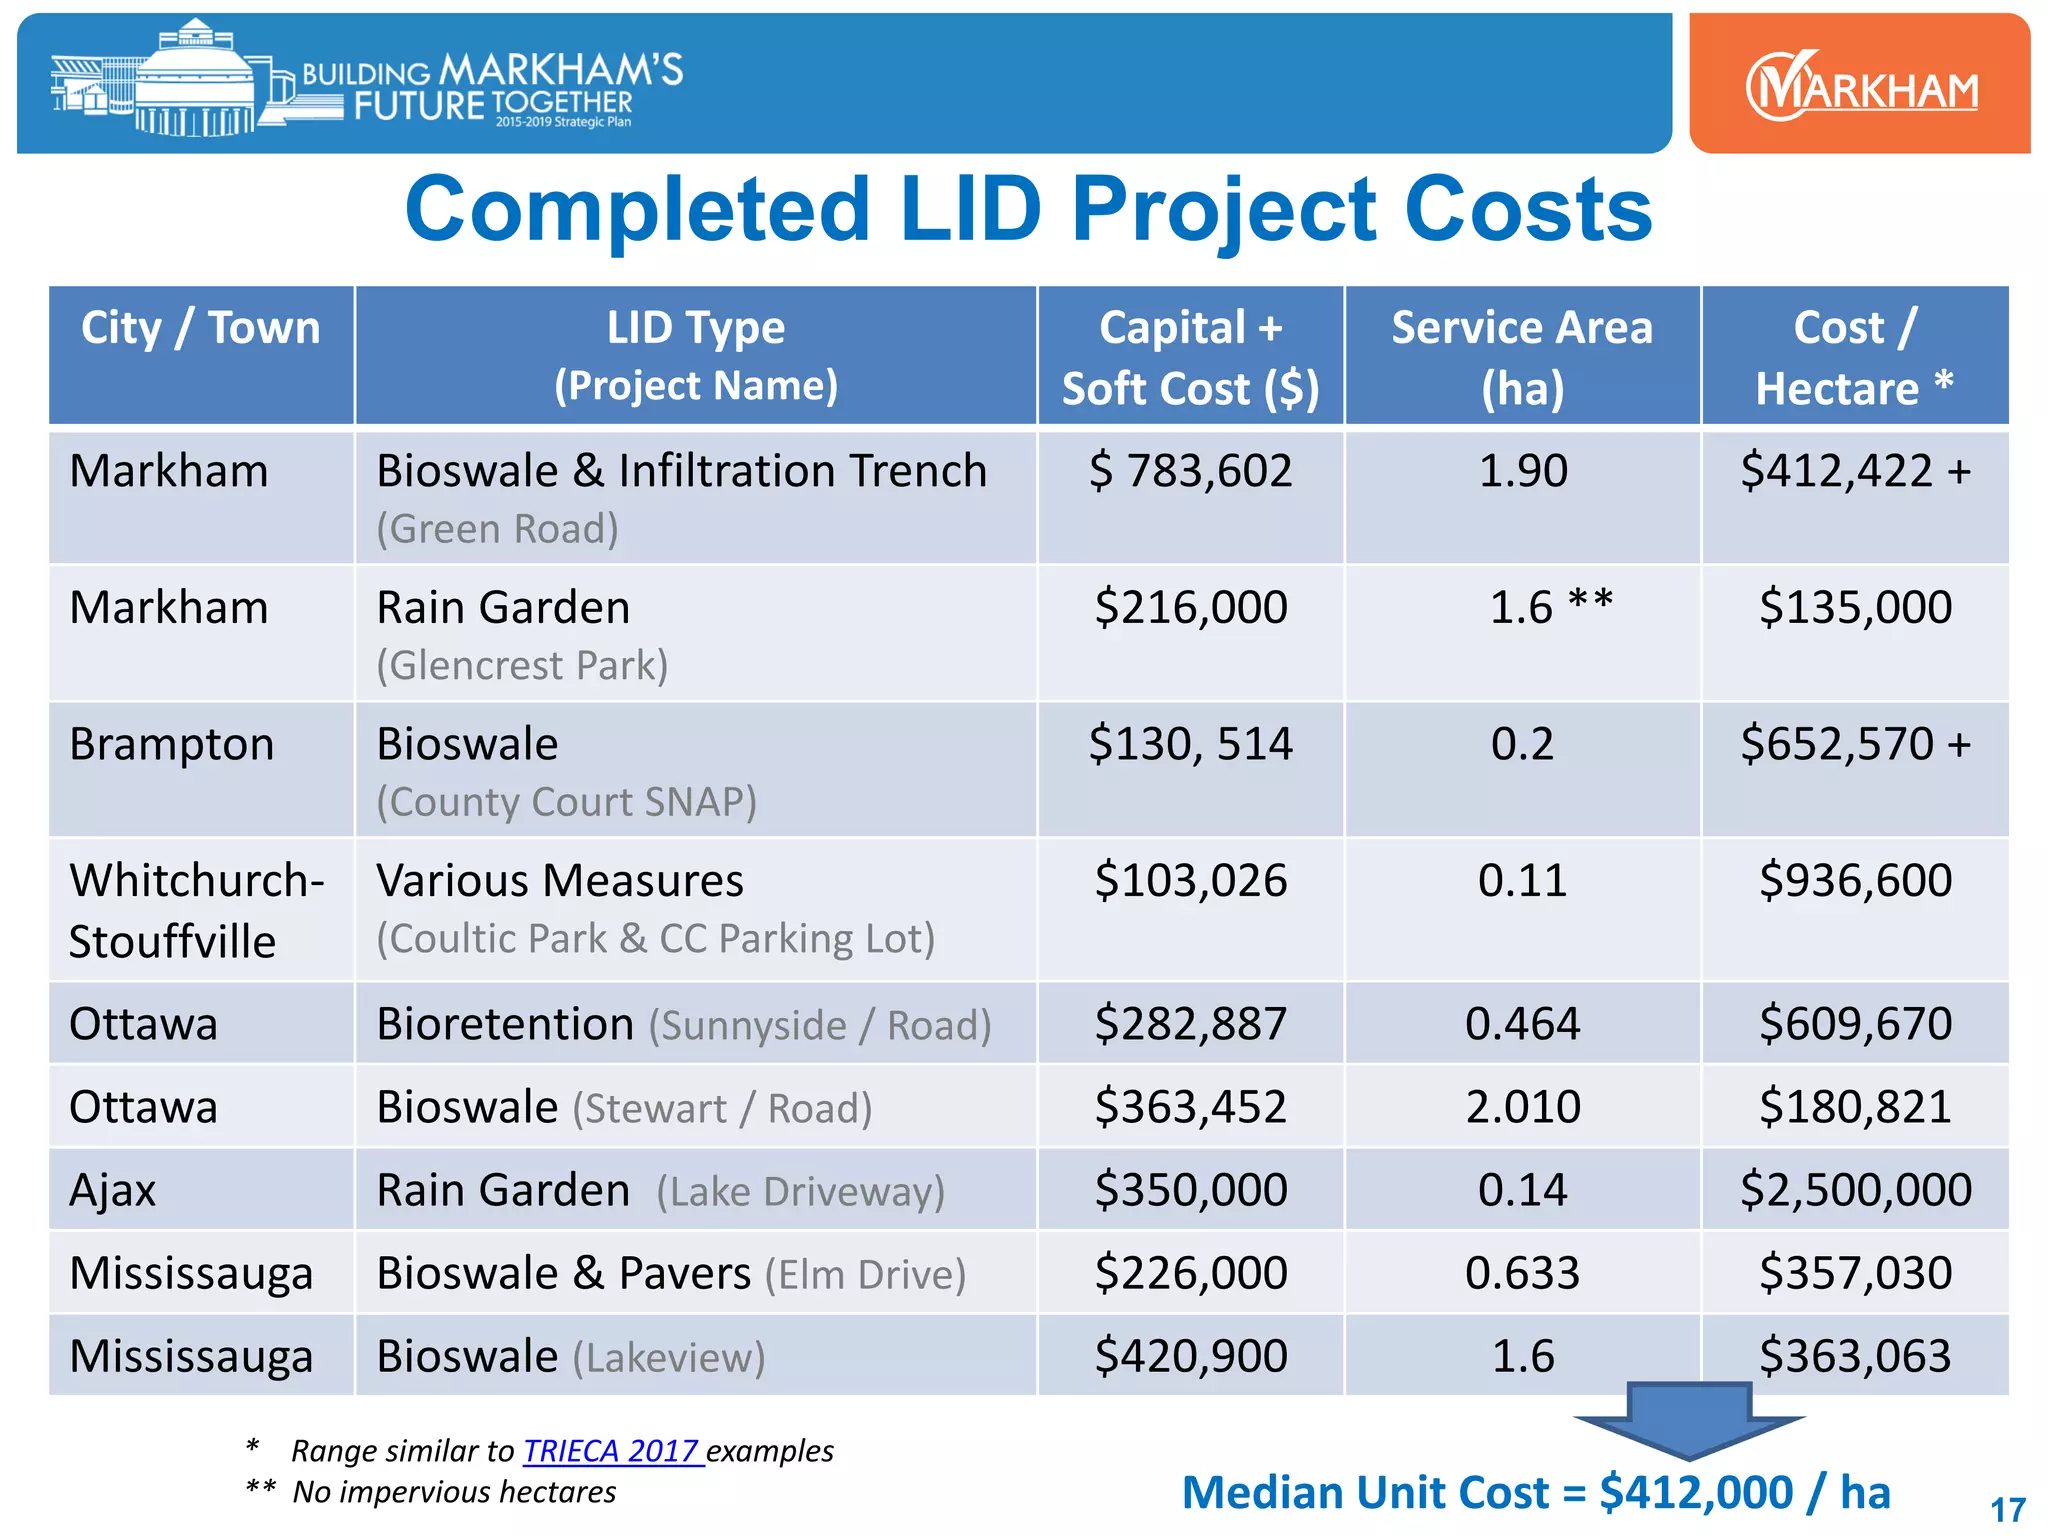
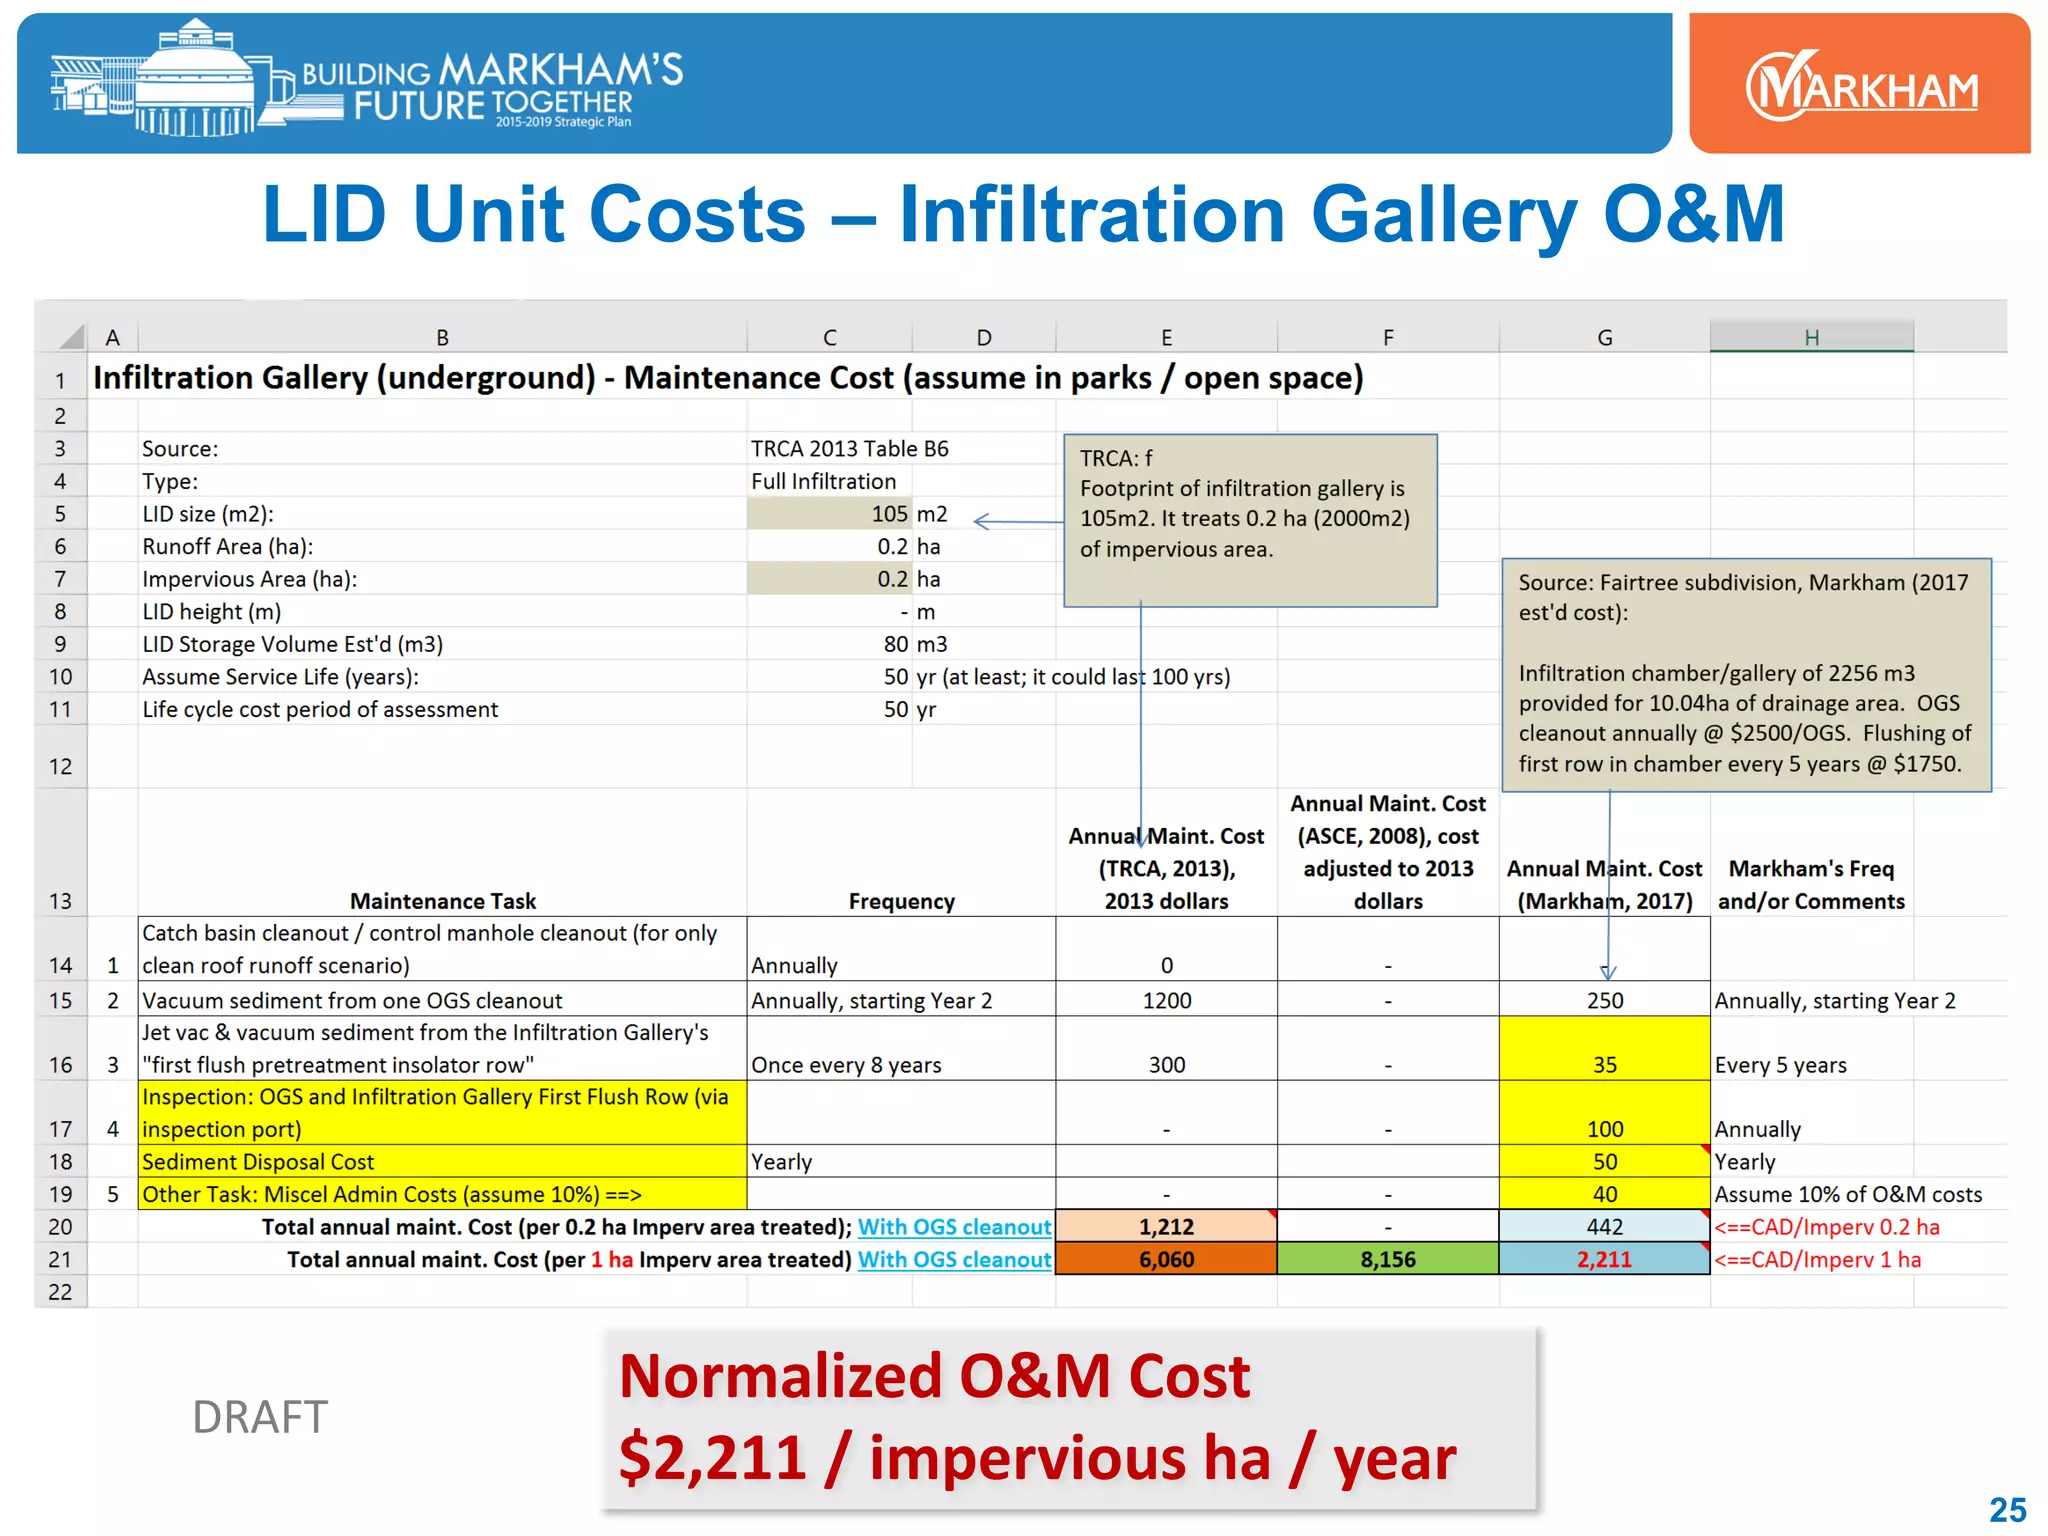
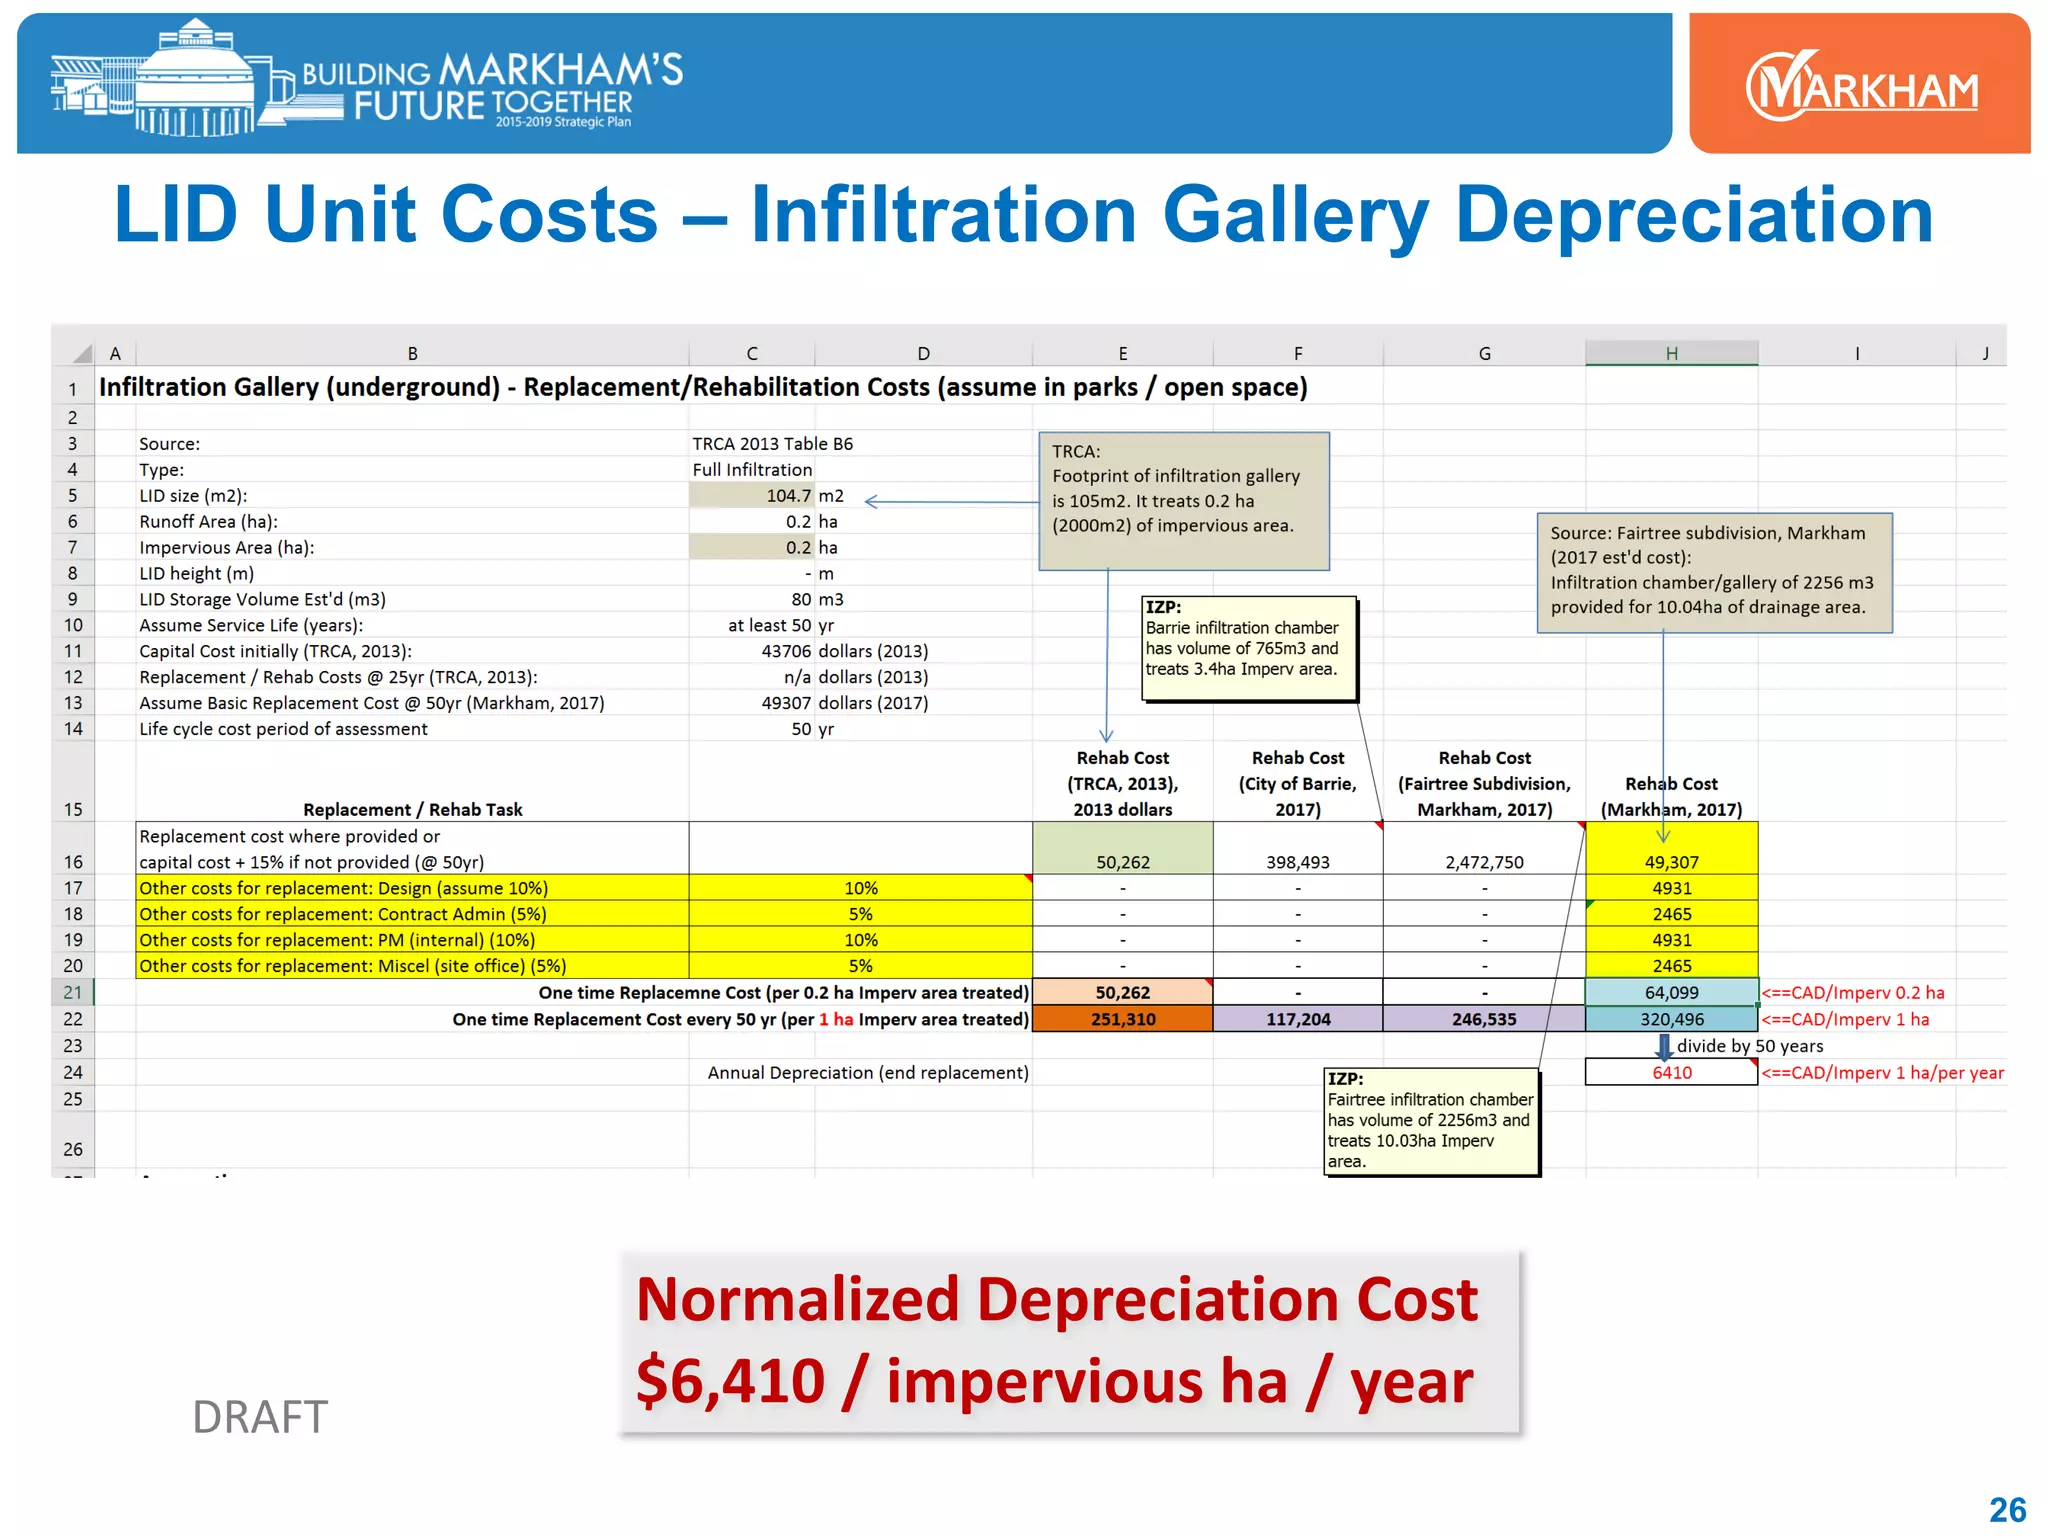
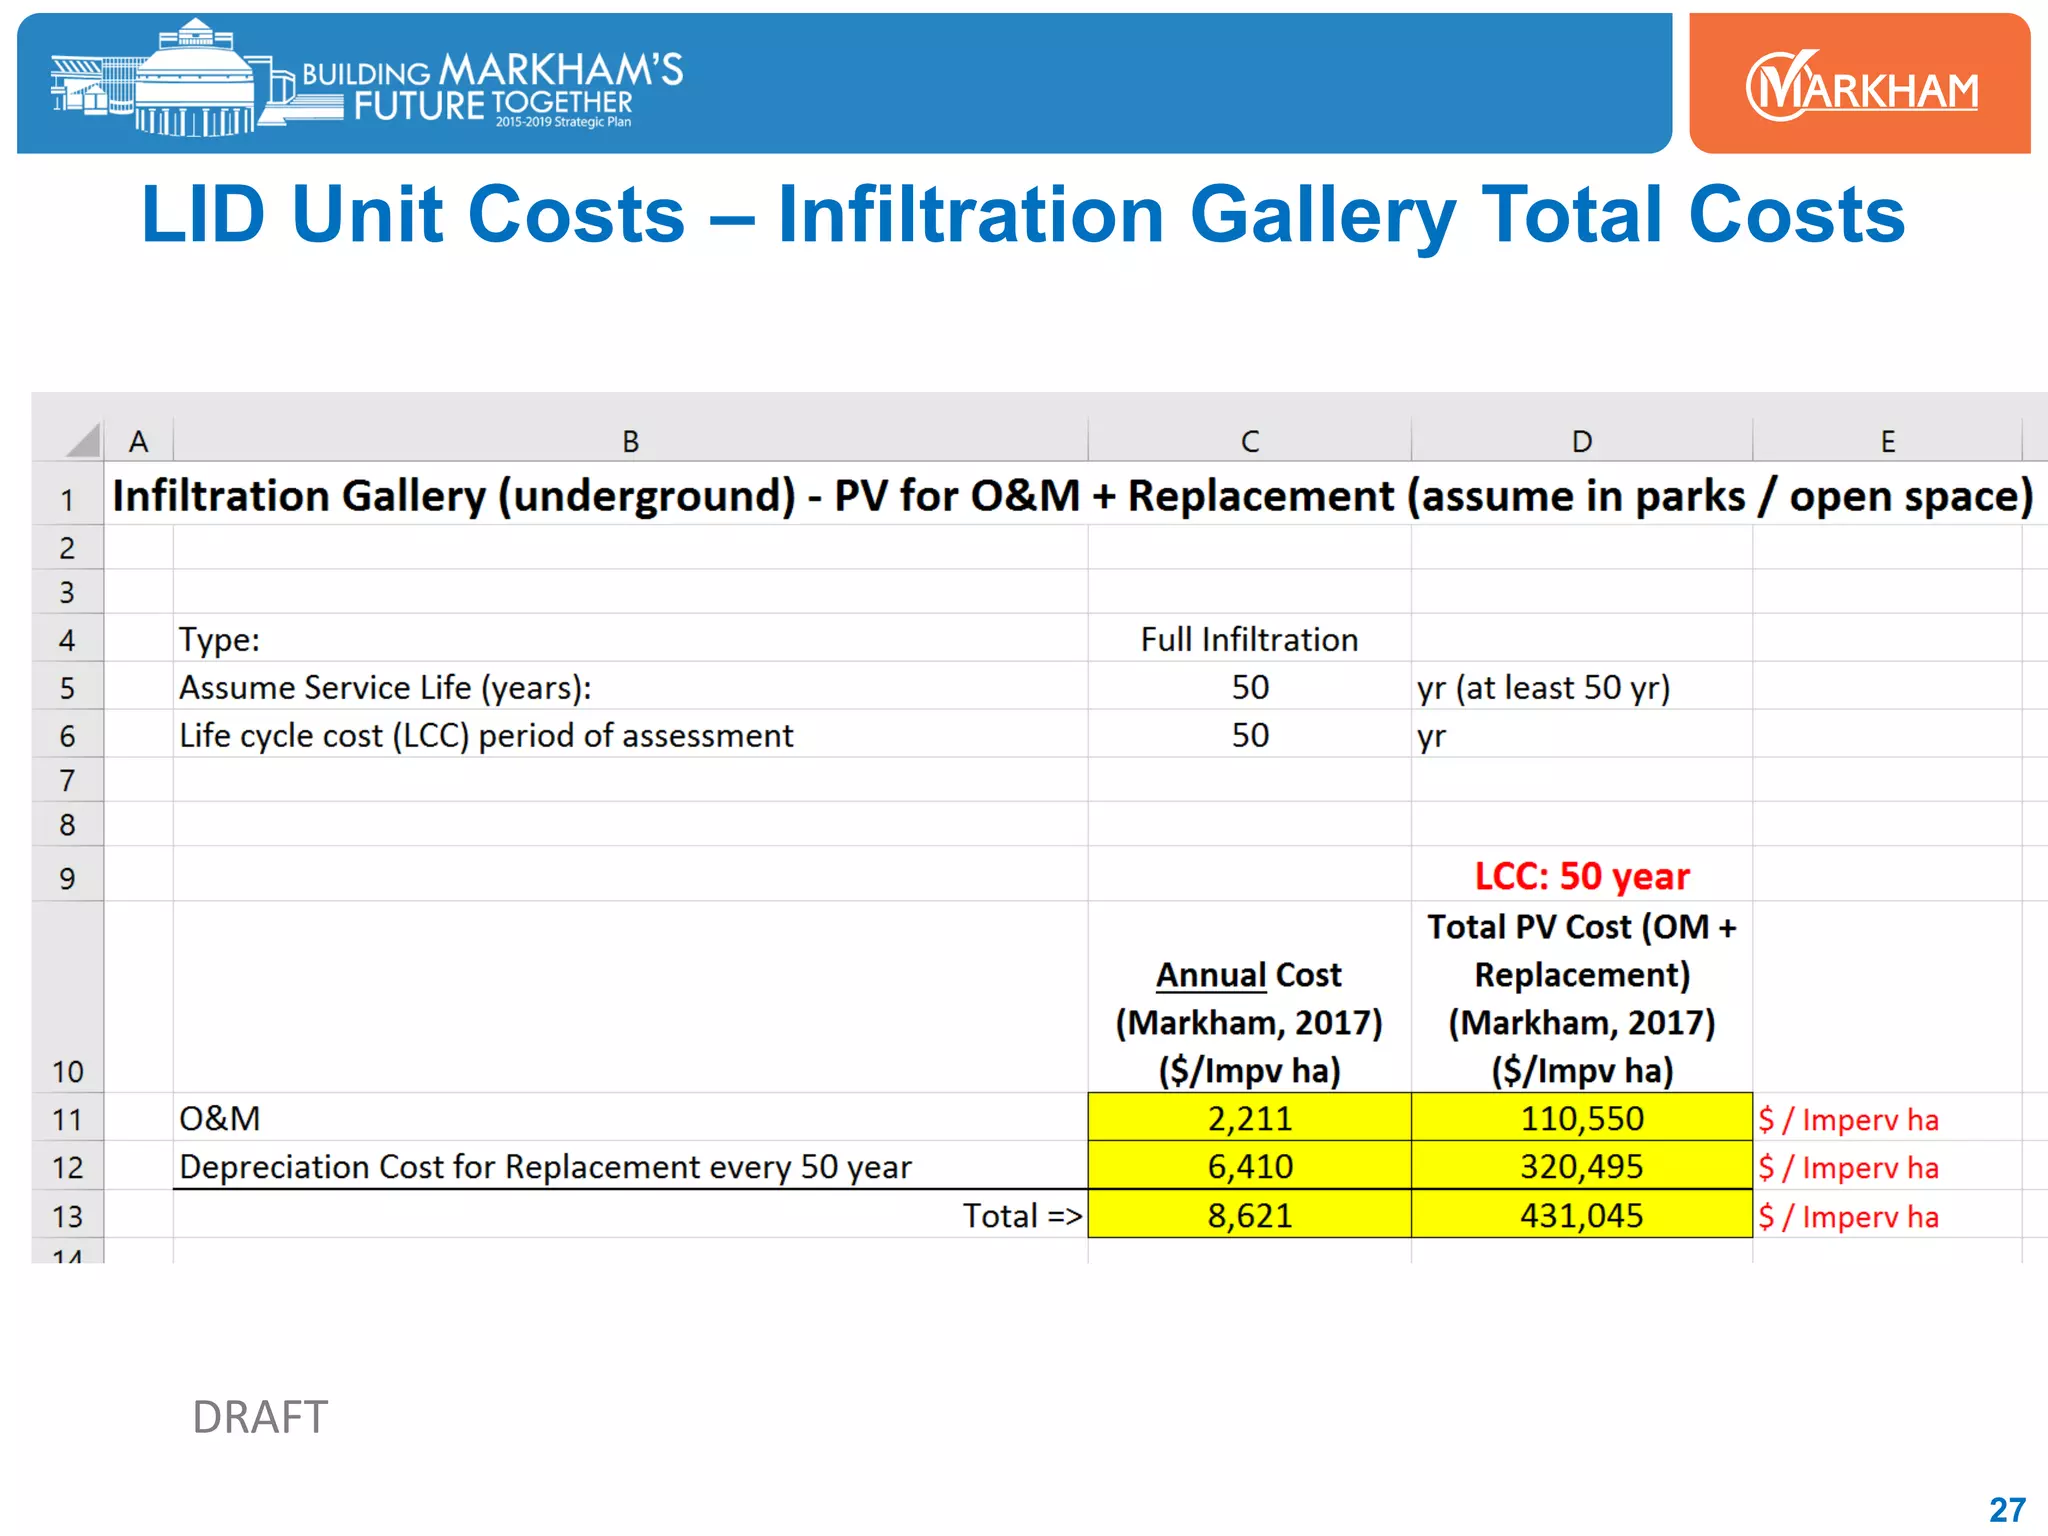
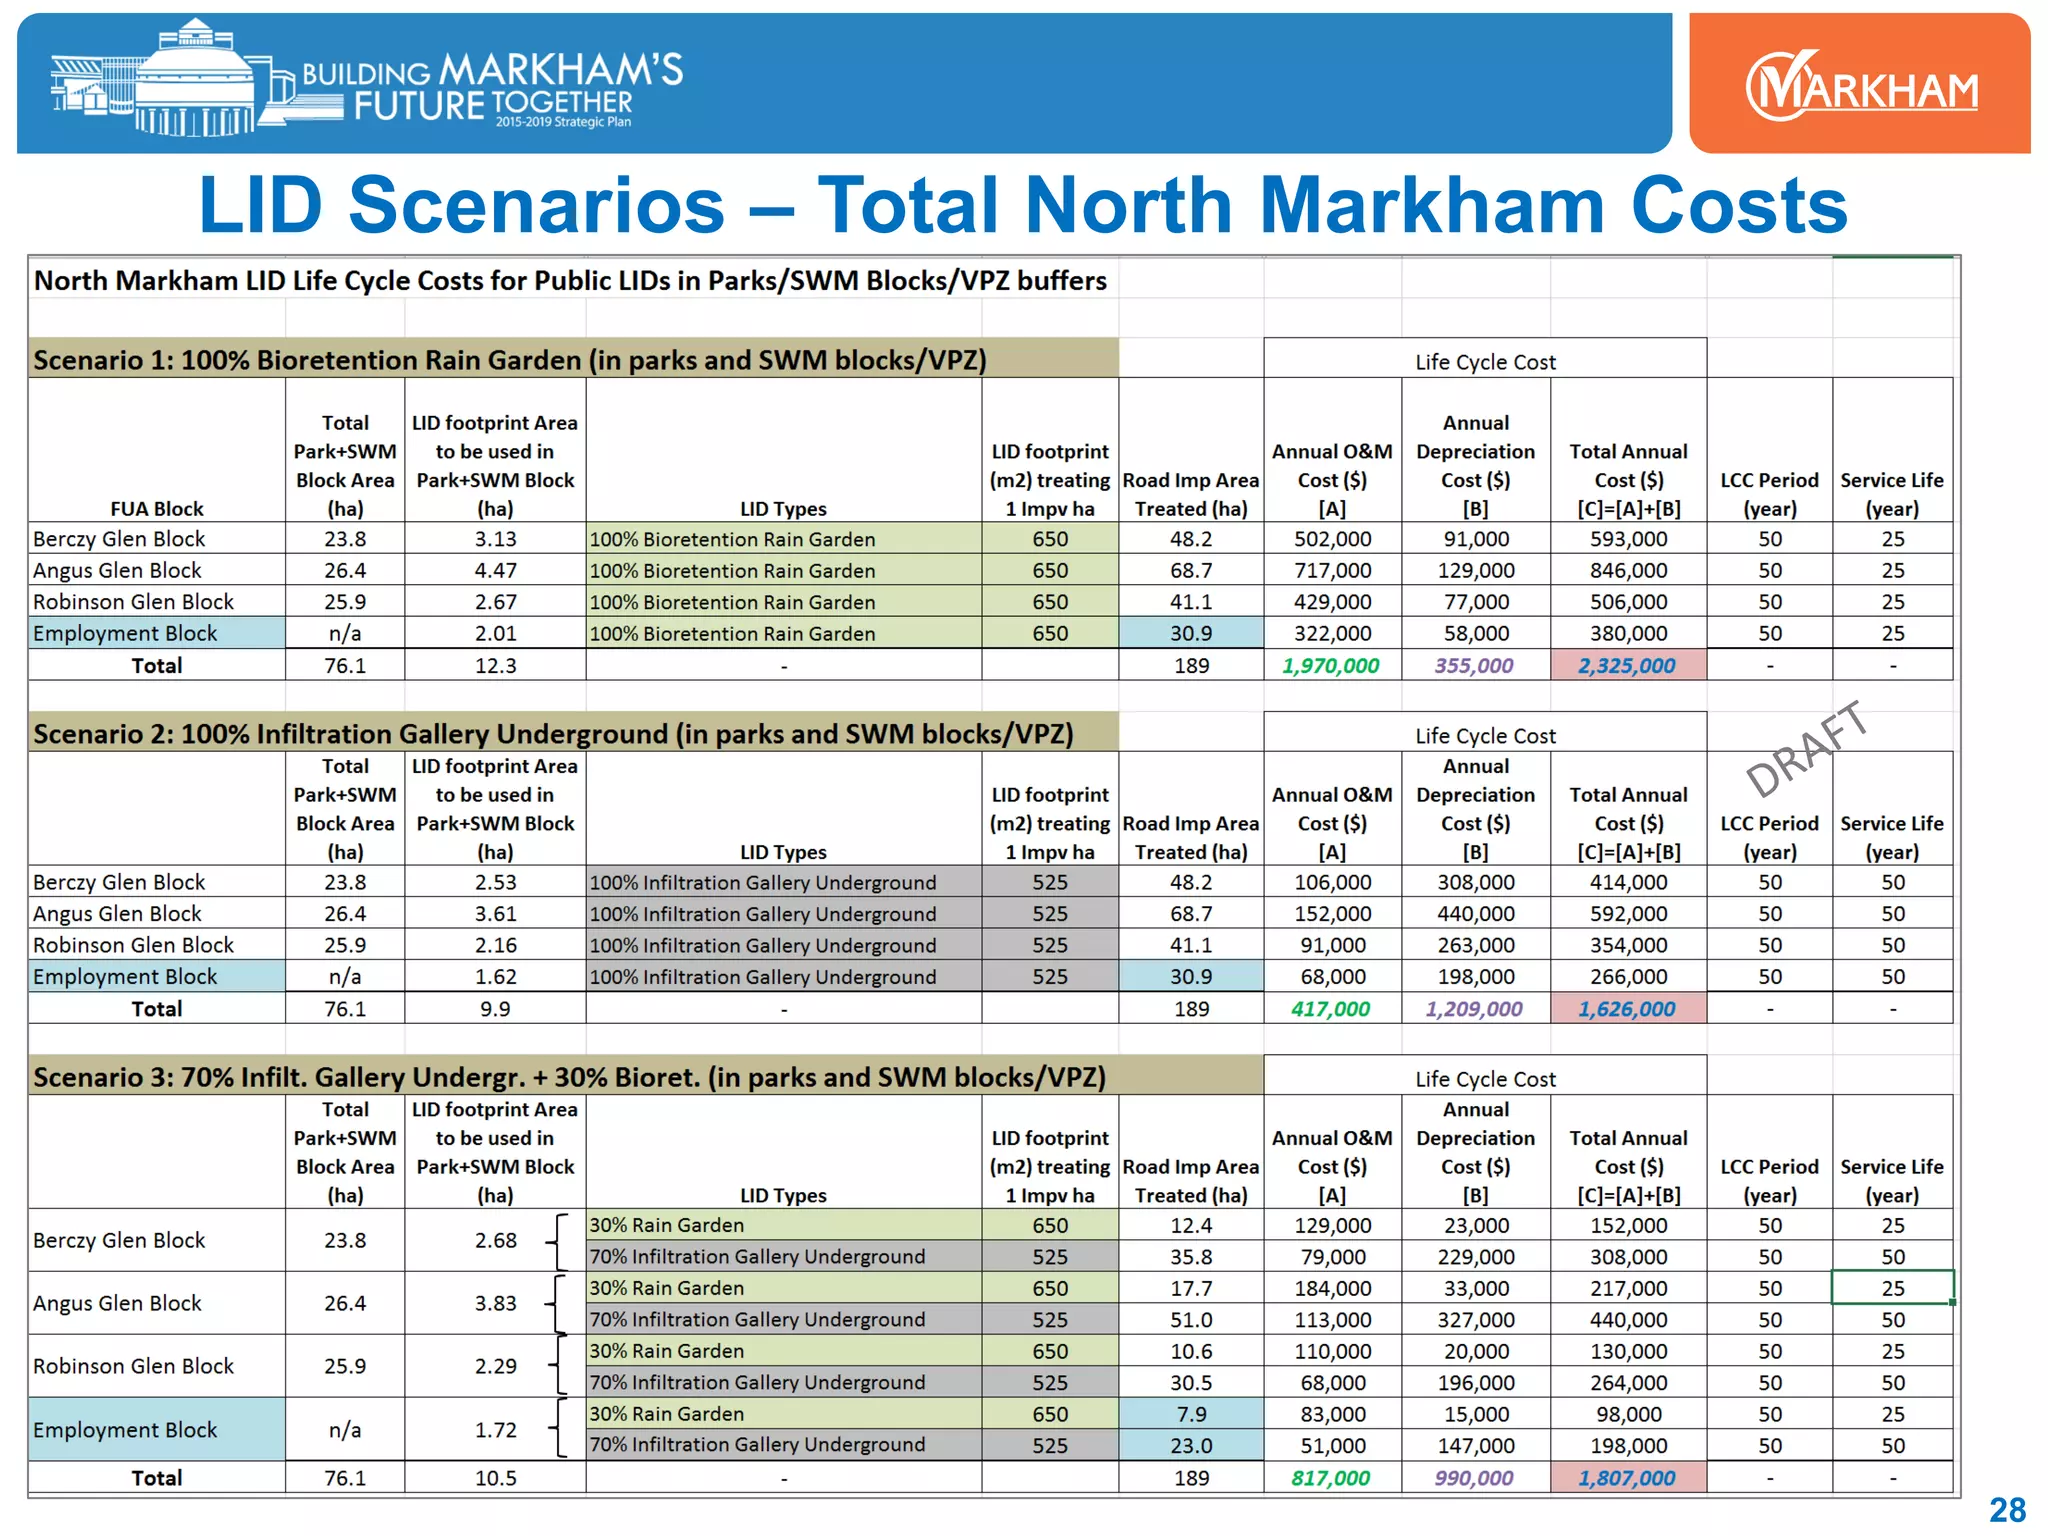
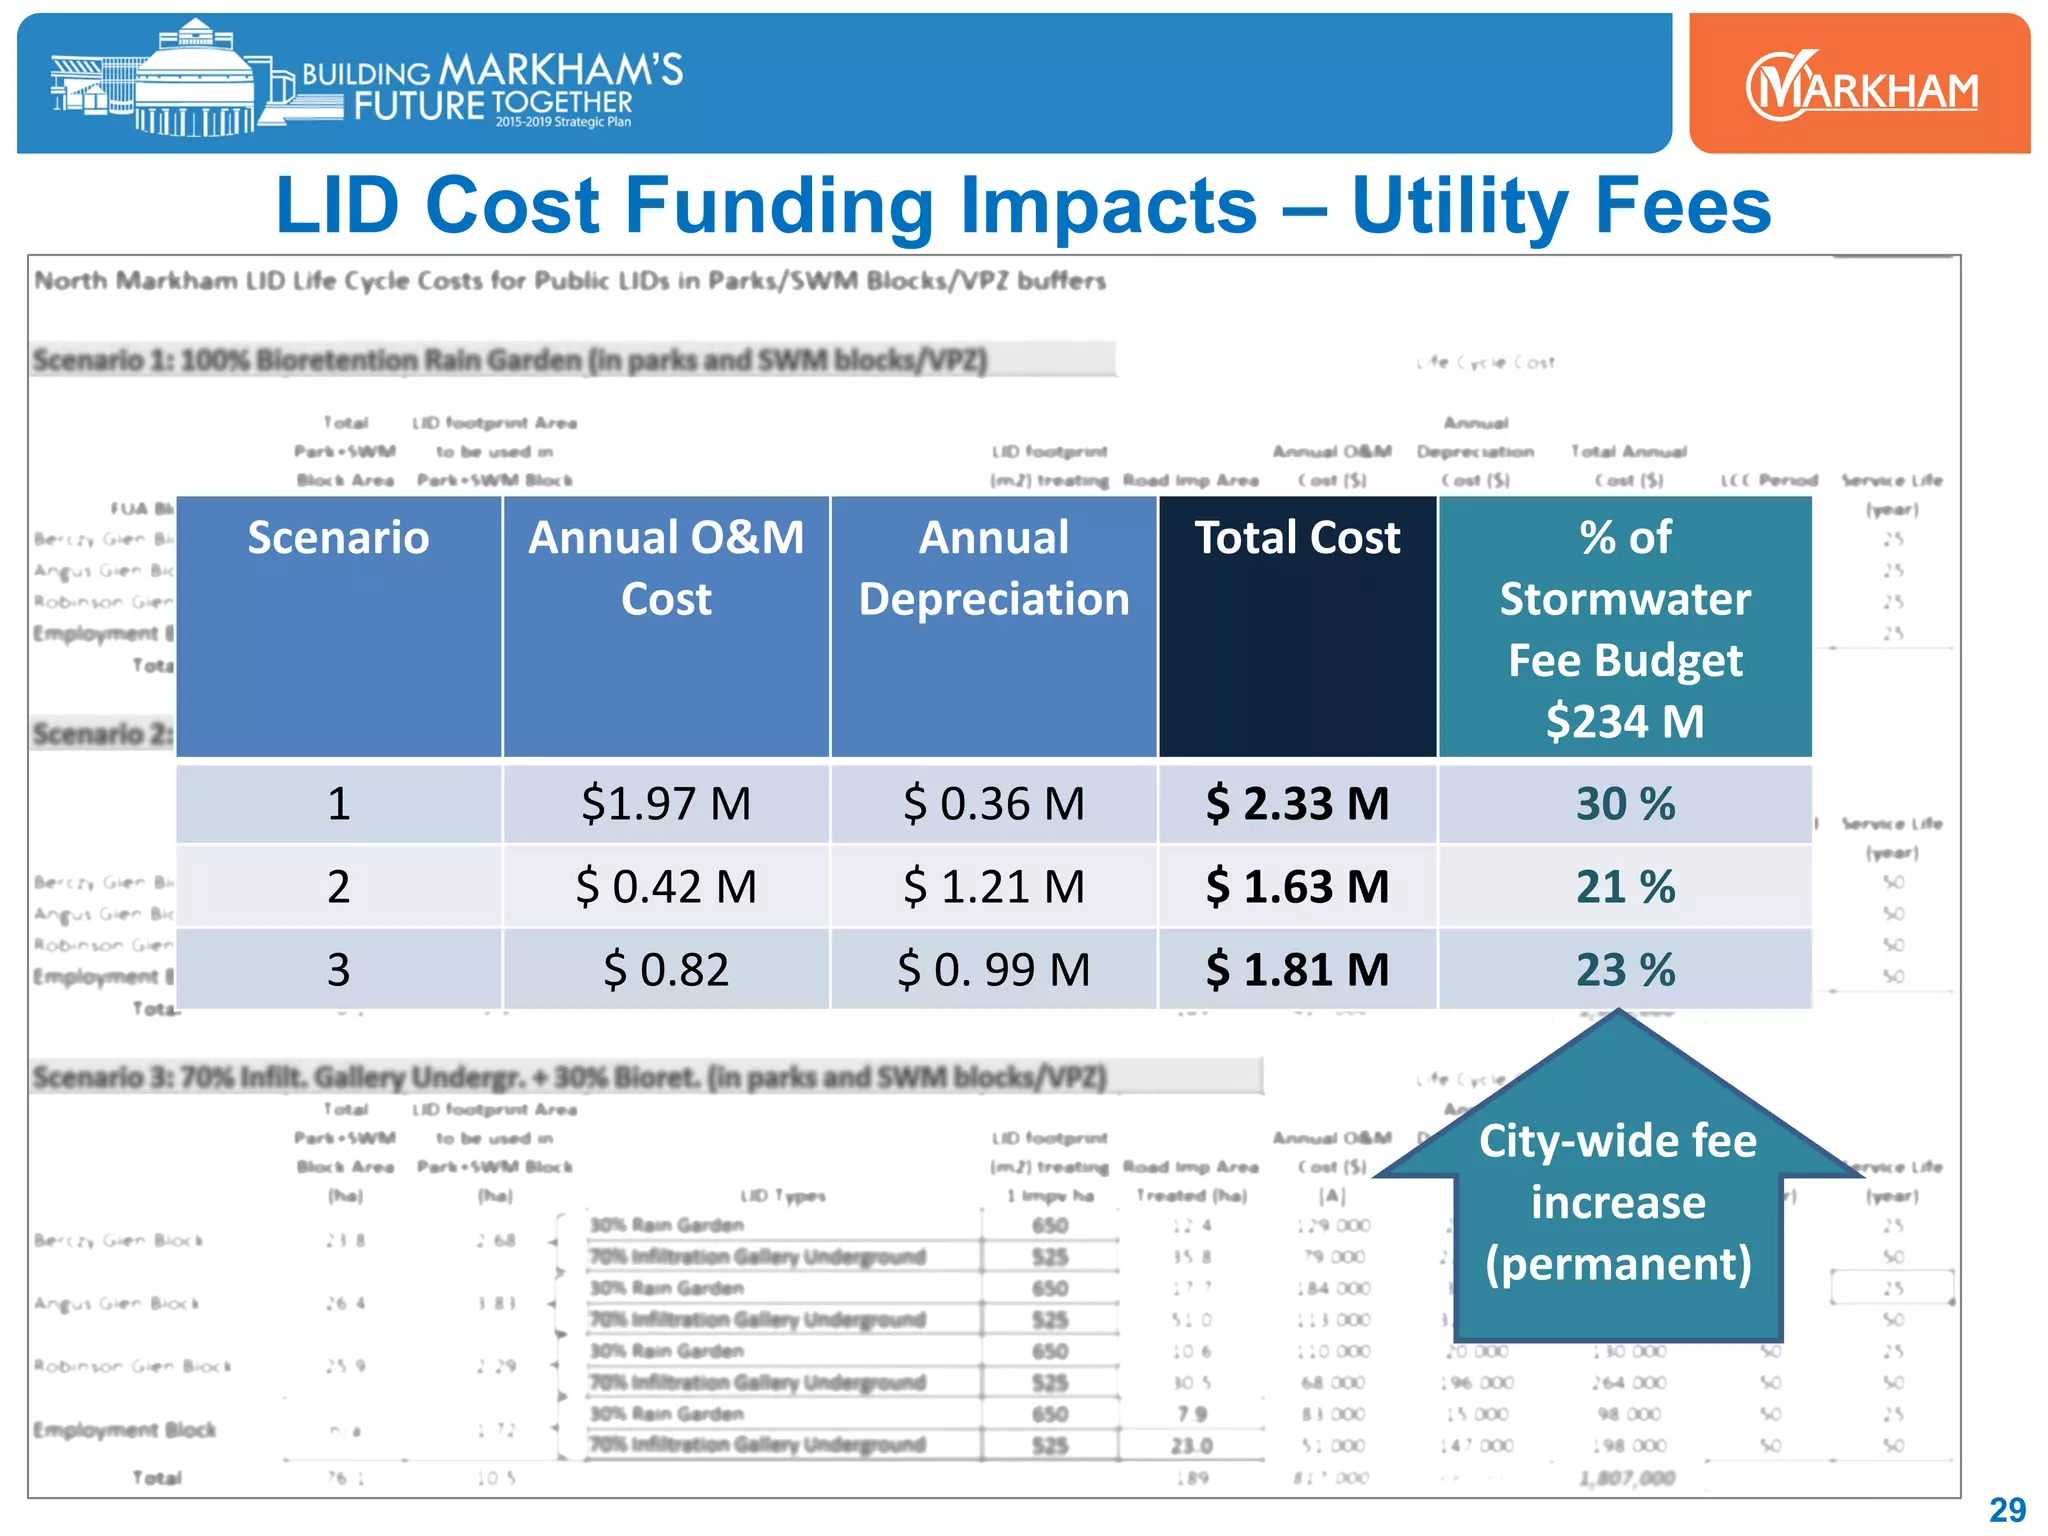
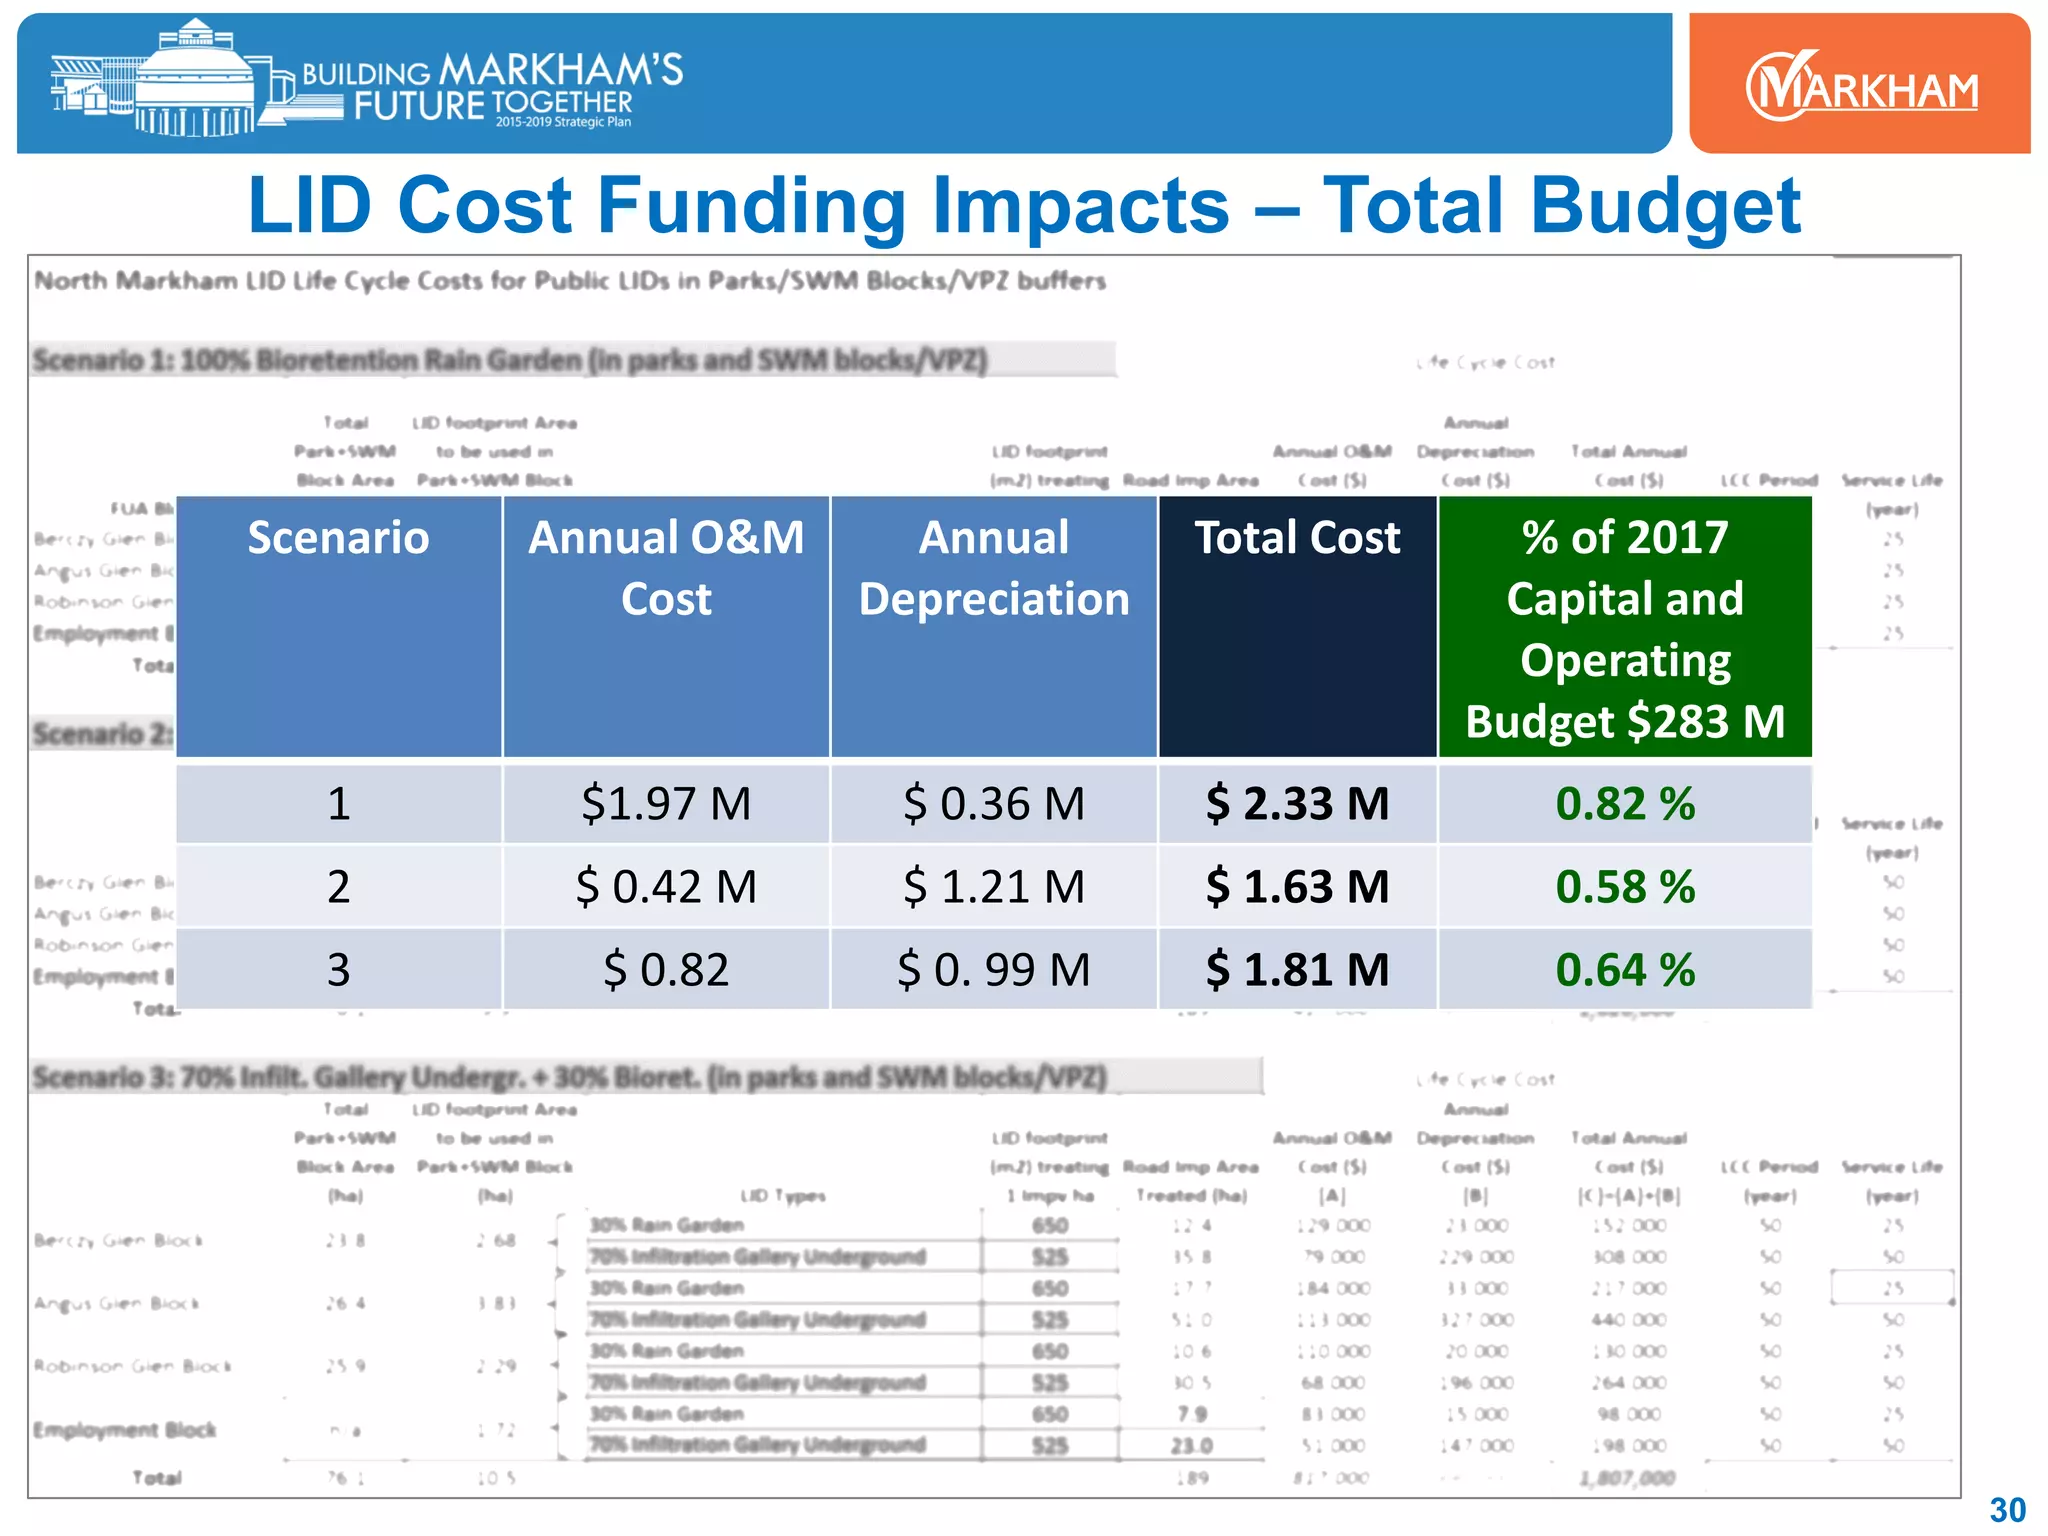
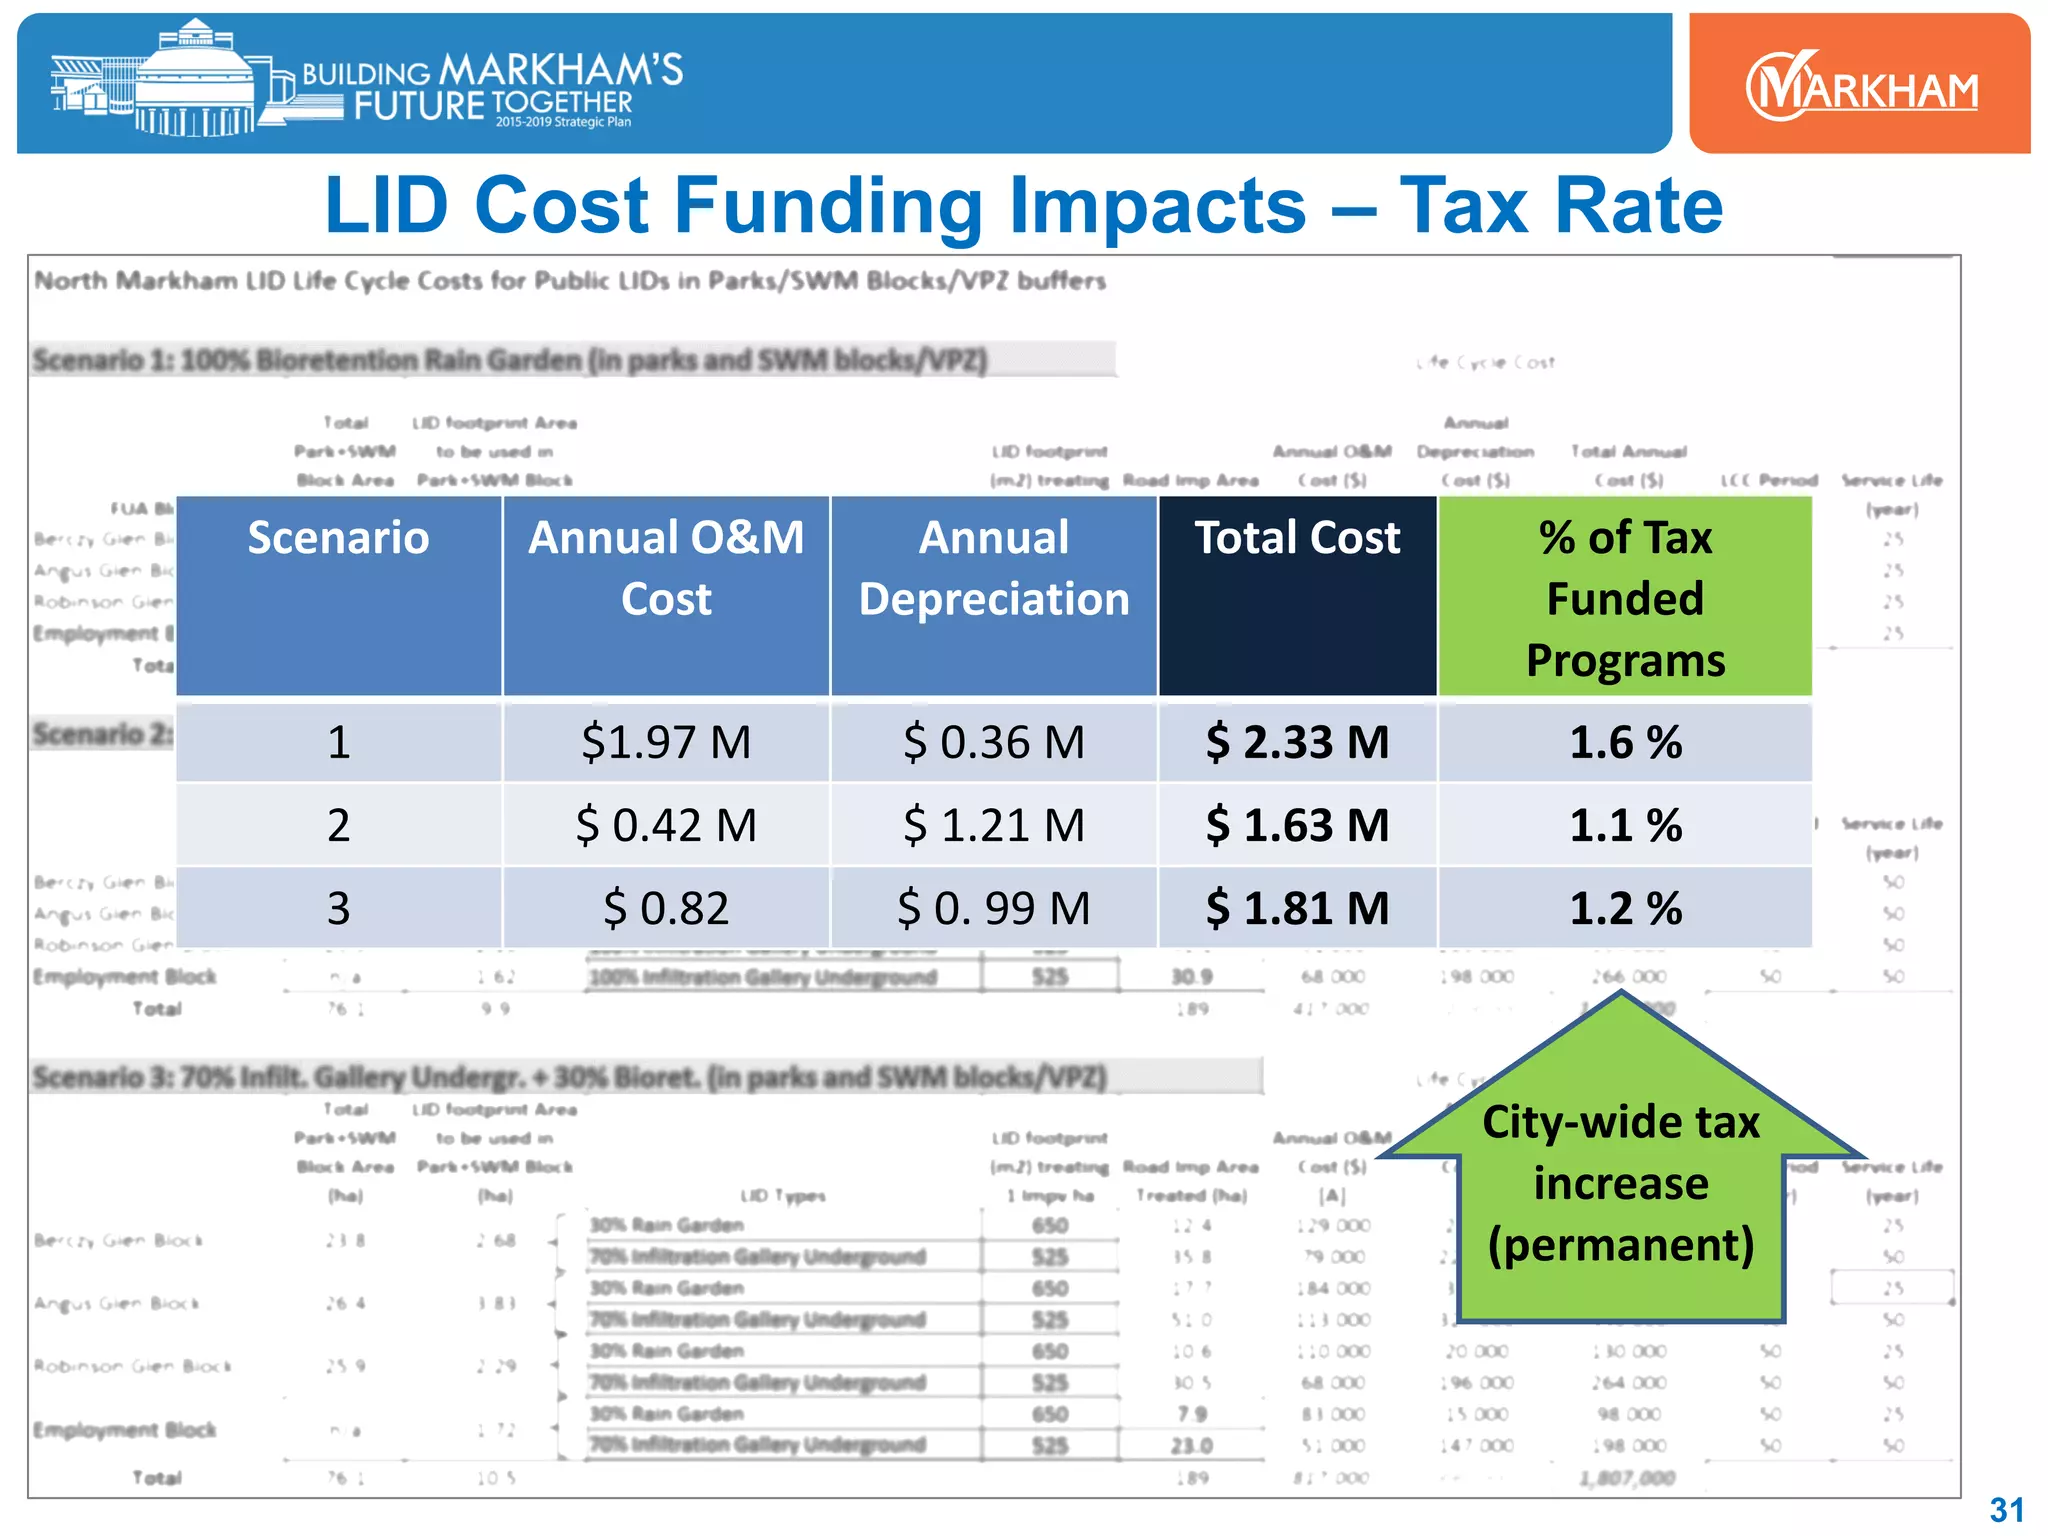
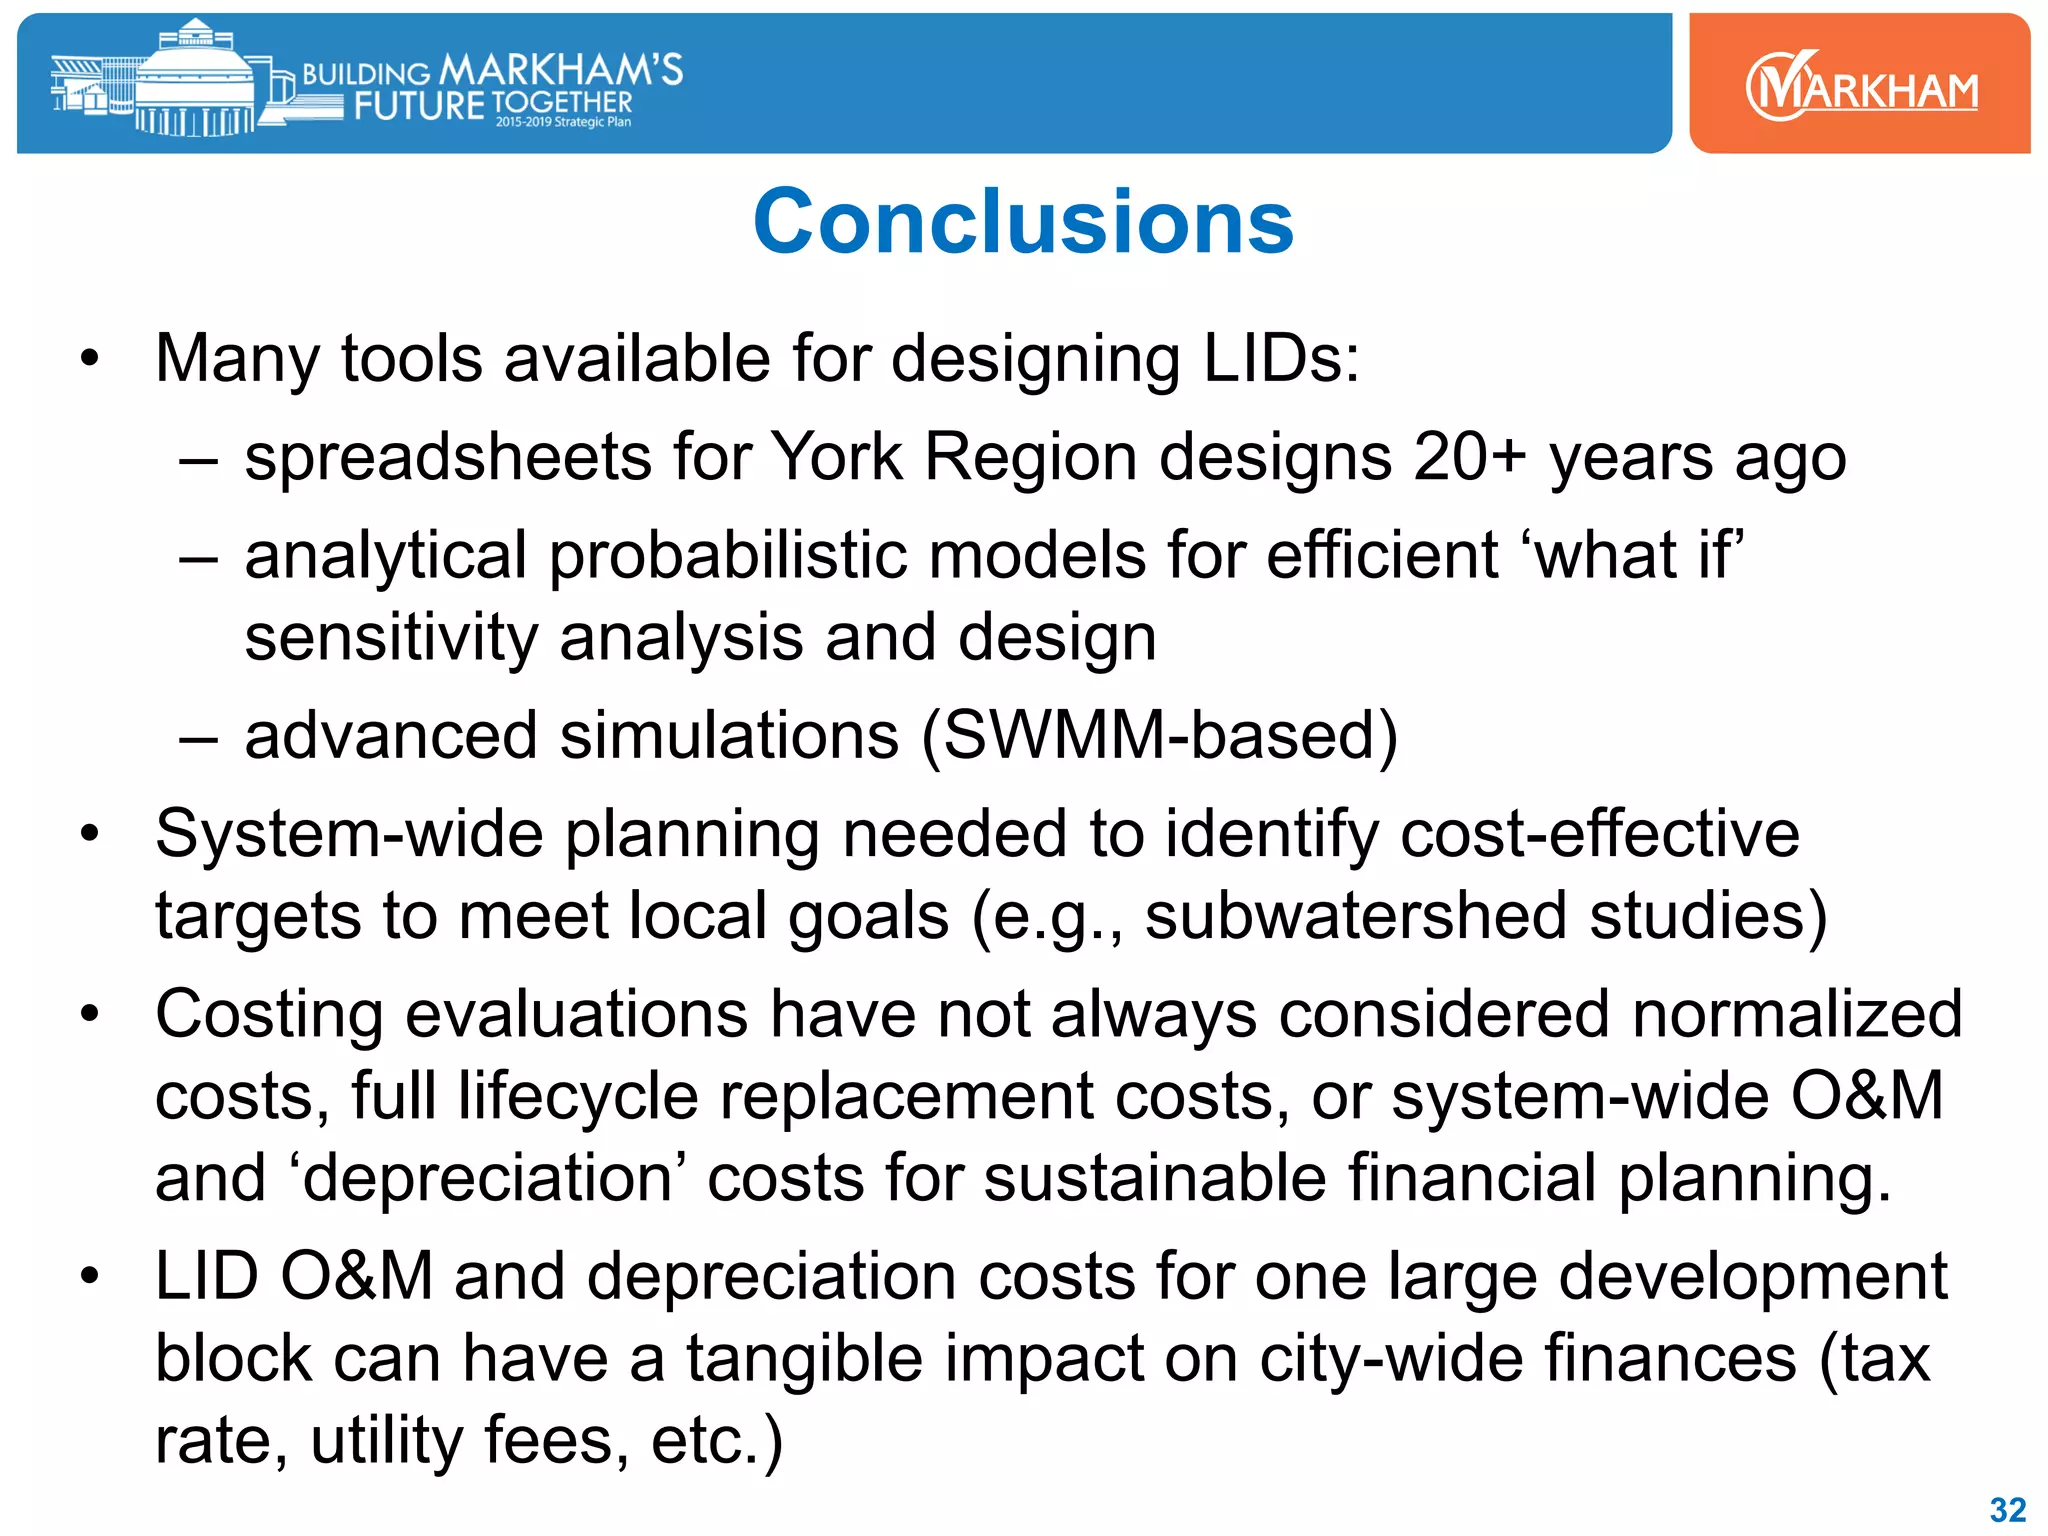
This document discusses stormwater management and low impact development (LID) targets. It provides background on the evolution of LID targets in Ontario. It then describes analytical probability models that can be used to design LID measures and assess their performance. The document analyzes the capital and lifecycle costs of meeting proposed LID volume targets from the Ministry of Environment and Climate Change, finding the costs to be 4-5 times higher than conventional technologies. It also presents unit cost data for completed LID projects and analyzes the lifecycle costs of implementing LIDs in a new development in Markham. The conclusions emphasize the need for system-wide planning to identify cost-effective LID targets and consider full lifecycle costs for sustainable financial
What are the advantages and disadvantages of membrane structures.pptx
Manage Stormwater & Reduce Costs With LID Lifecycle Analysis
1. National Water & Wastewater
Benchmarking Initiative
Stormwater Task Force
LID Design Tool &
Lifecycle Costing
Robert J. Muir. M.A.Sc., P.Eng.
Manager, Stormwater
Richmond Hill, Ontario
October 26, 2017
1
2. • Background
– LID Target Evolution
– Markham & Local Experience
• Analytical Probability Design Tool
– Capacity vs Performance
• MOECC Draft LID Targets
• Capital & Lifecycle Cost Considerations
– Comparison with Traditional Design
– Unit Costs for Completed LID Projects
– North Markham Lifecycle Costs Analysis
2
Outline
3. Background on LID / Green Infrastructure
• LIDs / GI can help replicate the natural hydrologic cycle and
mitigate groundwater and surface water system impacts of
development. Improves quantity and quality management.
3
4. Background on Policy and Targets
• 1991 Ontario interim guidelines to
mitigate new development impacts by
managing stormwater “at source”,
promotes infiltration, vegetated BMPs.
• 1994 & 2003 Ontario design
guidelines include targets for sizing
quality ponds but not sizing LIDs
• LID criteria set based on local needs:
– 1995 OPA 118 match recharge on ORM
– 2006 Toronto 5 mm for water quality
control (Wet Weather Flow Management)
– 2010 Markham target for Eckhart Creek =
10 mm for erosion control
– 2012 TRCA 5 mm for erosion (to retain
on-site per Criteria Document)
4
5. Markham Implementation of LIDs
• First LID features for
meeting water balance goals
approved 10 years ago:
• Kylemore Subdivision
Recharge Basin & Biofilters
• Retrofits completed on an
opportunity basis (combined
with other works):
• Grencrest Park Raingarden
• Demonstration projects to
test new technologies /
approaches:
• Green Road at South East
Community Centre
5
Glencrest Park Raingarden
Markham Green Road Pilot
7. York Region Implementation
• “Etobicoke Exfiltration System”
for meeting Oak Ridges Moraine
MESP water balance goals
approved / built 20 years ago:
– Richmond Hill OPA 118 Ph.4
• Lake Simcoe Protection Act 2008
targets for urban phosphorus
management.
• Clean Water Act polices to
maintain WHPA Q1/Q2 recharge.
• Municipal pilot projects:
– W-Stouffville Community Park
– Newmarket Residential Road
– Aurora Recreation Complex
– E.Gwillimbury Municipal Office
7
Richmond Hill OPA 118 (1997)
8. Analytical Probabilistic Models (APMs)
• Research in early 1980’s
at the University of Toronto
• Alternative to continuous
period simulation for
analysis of urban drainage
systems
• Comparative studies have
validated APM results
• Many applications for the
planning of urban runoff
quantity/quality control
systems
9. How APMs Work
• Characterize rainfall statistics
based on past records:
• Mathematically transform stats into
hydrologic & hydraulic
performance:
Storage
Catchment
‘Treated’ Outflow
(e.g., infiltration)
Bypass
(‘spill’)Runoff
10. APMs for LID Measure Design & Assessment
• Dr. Yiping Guo at
the McMaster
University in
Hamilton, Ontario
develops LID
evaluation models.
Page 10
11. LID Target Volume Cost Effectiveness
11
Diminishing Volume
Controlled
Higher Volume Targets
Have Lower Incremental
Benefits
12. MOECC Proposed Minimum LID Targets (Draft)
• Pressure to advance LID
implementation (Environmental
Commissioner of Ontario 2014) as
part of extreme weather adaptation.
• Ministry of Environment and
Climate Change (MOECC) issues
interpretation bulletin relaxing
implementation constraints
(promote LIDs in tight soils).
• 2017 Draft LID Guidance sets
aggressive, high stormwater
retention/capture & release
targets of 27 - 28 mm across
Markham area & York Region.
12
LID Volume Targets
13. Capital Cost Impacts of Draft MOECC Targets
• Cost for LID higher than conventional technologies.
13Draft – City of Barrie (LID Cost Analysis.xlsx)
Grey / Central Green / Distributed
14. Lifecycle Cost Impacts of Draft MOECC Targets
• Present Value of LID lifecycle costs 4-5 times higher than
conventional technologies (initial capital, O&M, replacement).
14Draft – City of Barrie (LID Cost Analysis.xlsx)
Grey / Central Green / Distributed
15. Unit Costs of LID and Traditional SWM
• ‘Normalized’ cost (annual cost per hectare served) needed
for alternative evaluation & system planning or budgeting.
• Past studies have not normalized costs in comparisons.
15
POND
LIDs
Non-normalized
O&M Costs
16. 0
2000
4000
6000
8000
10000
12000
14000
16000
Bioretention Permeable Pavement Infiltration Trench /
Chamber
Enhanced Grass Swale Markham Wet Pond
Average
Annual Maintenance + Depreciation Cost
per Impervious Area ($ / ha / year)
Depreciation
Maintenance
Unit Costs of LID and Traditional SWM
• Annual ‘normalized’ cost of ponds less than LIDs.
16
POND
LIDs
Normalized
O&M + Depreciation
Costs
17. Completed LID Project Costs
17
City / Town LID Type
(Project Name)
Capital +
Soft Cost ($)
Service Area
(ha)
Cost /
Hectare *
Markham Bioswale & Infiltration Trench
(Green Road)
$ 783,602 1.90 $412,422 +
Markham Rain Garden
(Glencrest Park)
$216,000 1.6 ** $135,000
Brampton Bioswale
(County Court SNAP)
$130, 514 0.2 $652,570 +
Whitchurch-
Stouffville
Various Measures
(Coultic Park & CC Parking Lot)
$103,026 0.11 $936,600
Ottawa Bioretention (Sunnyside / Road) $282,887 0.464 $609,670
Ottawa Bioswale (Stewart / Road) $363,452 2.010 $180,821
Ajax Rain Garden (Lake Driveway) $350,000 0.14 $2,500,000
Mississauga Bioswale & Pavers (Elm Drive) $226,000 0.633 $357,030
Mississauga Bioswale (Lakeview) $420,900 1.6 $363,063
Median Unit Cost = $412,000 / ha
* Range similar to TRIECA 2017 examples
** No impervious hectares
18. MOECC LID Target Policies for City Activities
1) Linear Development shall maintain pre-
development water balance for whole site
or net increase in impervious area.
• Road reconstruction / widening
• Markham “Green Road” example
added cost $1.35M / km
• Barrie lifecycle impact 4-5 times
cost of conventional SWM design
• Ottawa estimates 30% added cost
2) Linear Infrastructure with restrictions meet
75% of target, no cost constraint allowed.
• Flood Control Program sewer
upgrades would add 15% cost
3) Roadway mill and overlay exempt but
”encouraged to undertake SWM retrofits
to the activities Maximum Extent Possible”
• Ottawa estimates 300% more cost
18
19. Impacts of LID Targets on Future Development
• LID targets shall apply to development to meet pre-
development water balance goal including :
– New Development (new lot, change in use, building
construction requiring Planning Act approval),
– Redevelopment (full/partial building demolition),
– Intensification (infill, increased density or units).
• Governance for LID O&M on private sites being
considered by MOECC can have implications on various
City departments:
– Data management / inventory
– Easement & subdivision / site-plan agreements
– Monitoring requirements
– Compliance inspection / enforcement
19
20. Impacts of MOECC LID Targets in Markham
• Local need unclear given
decades of rising baseflows*,
including Rouge River.
– Are LID controls needed
in all catchments ?
• Area-wide targets are set in
comprehensive local
subwatershed studies
– Are MOECC 27-28 mm
targets needed given
North Markham 2-10 mm
recharge targets?
20
North
Markham
Baseflows Increasing for 50 years
* TMIG baseflow study report 2010 link
Urbanization and baseflow resiliency review link
21. North Markham LID Lifecycle Costs
• North Markham, Future Urban Area (FUA) has many
new features compared to conventional developments.
• New services are
evaluated for long-term
lifecycle costs, including
O&M and replacement.
• Analysis allows
sustainable funding to
be secured up front for
Muti-Use Paths, Low
Impact Development
features, etc.
21
North
Markham
1288 ha
22. North Markham LID Unit Costs
• Groups of LID features were assessed for O&M costs
and replacement costs to derive unit costs scaled to
whole 1288 hectare development.
• Sources of maintenance tasks and costs included:
– TRCA 2013 STEP Life Cycle Costs
– City of Barrie LID Lifecycle Analysis
– CVC Permeable Paver O&M Cleaning Costs
– Markham Operations, Engineering, Environmental Services Staff
– Checking with ASCE 2010 publication, consultant cost estimates
• Added activities included:
– Administration (GIS, records management, etc.)
– Design, Contract Admin, Project Management
– Replacement for measures with > 50 year service life
– Labour payroll burden, equipment, travel time (indirect costs)
22
Sources: TRCA 2013, ASCE 2010
23. Indirect O&M Costs Related to Activities
23
15-20% Indirect Costs,
Truck ($60/hr), Payroll
Burden (benefits etc.)
15-20%
24. North Markham LID Groups
24
(A) Bioretenion / Rain Gardens
(B) Infiltration Galleries
(C) Stormwater Planters
(D) Permeable Pavement
(E) Rain Cisterns
25. LID Unit Costs – Infiltration Gallery O&M
25
Normalized O&M Cost
$2,211 / impervious ha / year
DRAFT
26. LID Unit Costs – Infiltration Gallery Depreciation
26
Normalized Depreciation Cost
$6,410 / impervious ha / yearDRAFT
27. LID Unit Costs – Infiltration Gallery Total Costs
27
DRAFT
29. LID Cost Funding Impacts – Utility Fees
29
Scenario Annual O&M
Cost
Annual
Depreciation
Total Cost % of
Stormwater
Fee Budget
$234 M
1 $1.97 M $ 0.36 M $ 2.33 M 30 %
2 $ 0.42 M $ 1.21 M $ 1.63 M 21 %
3 $ 0.82 $ 0. 99 M $ 1.81 M 23 %
City-wide fee
increase
(permanent)
30. LID Cost Funding Impacts – Total Budget
30
Scenario Annual O&M
Cost
Annual
Depreciation
Total Cost % of 2017
Capital and
Operating
Budget $283 M
1 $1.97 M $ 0.36 M $ 2.33 M 0.82 %
2 $ 0.42 M $ 1.21 M $ 1.63 M 0.58 %
3 $ 0.82 $ 0. 99 M $ 1.81 M 0.64 %
31. LID Cost Funding Impacts – Tax Rate
31
Scenario Annual O&M
Cost
Annual
Depreciation
Total Cost % of Tax
Funded
Programs
1 $1.97 M $ 0.36 M $ 2.33 M 1.6 %
2 $ 0.42 M $ 1.21 M $ 1.63 M 1.1 %
3 $ 0.82 $ 0. 99 M $ 1.81 M 1.2 %
City-wide tax
increase
(permanent)
32. Conclusions
• Many tools available for designing LIDs:
– spreadsheets for York Region designs 20+ years ago
– analytical probabilistic models for efficient ‘what if’
sensitivity analysis and design
– advanced simulations (SWMM-based)
• System-wide planning needed to identify cost-effective
targets to meet local goals (e.g., subwatershed studies)
• Costing evaluations have not always considered normalized
costs, full lifecycle replacement costs, or system-wide O&M
and ‘depreciation’ costs for sustainable financial planning.
• LID O&M and depreciation costs for one large development
block can have a tangible impact on city-wide finances (tax
rate, utility fees, etc.)
32