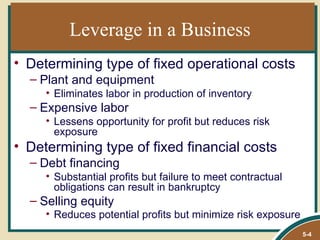
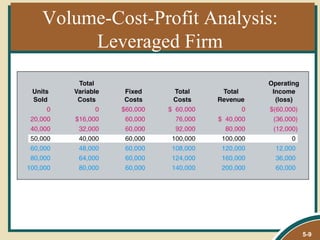
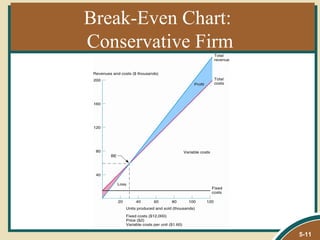
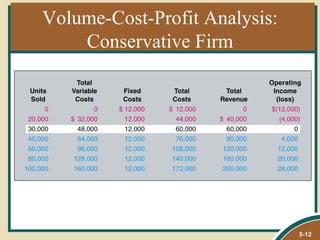
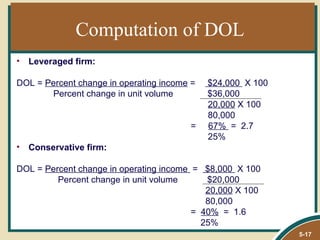
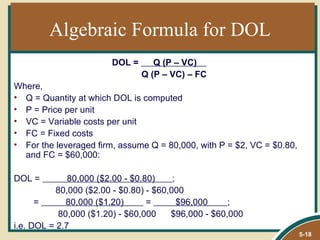
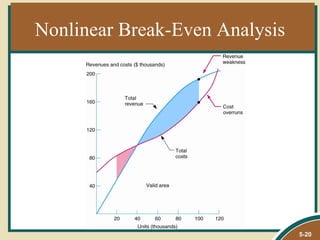
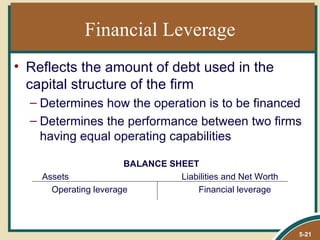
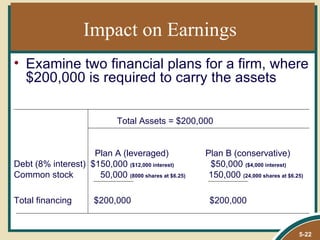
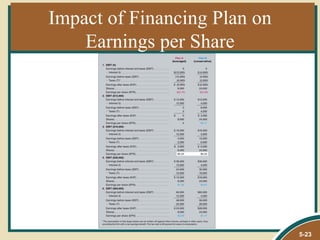
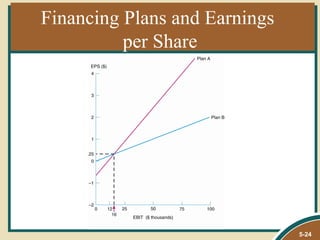
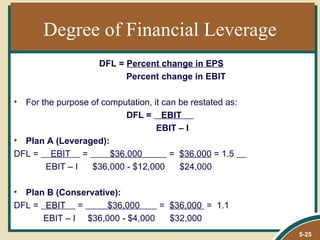
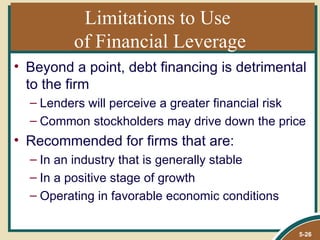
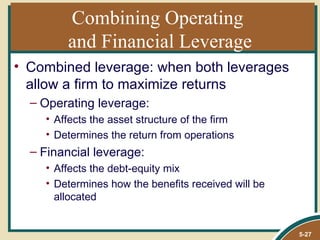
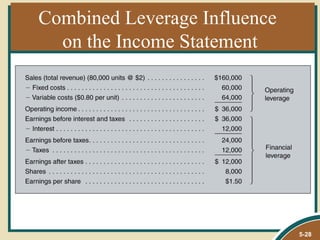
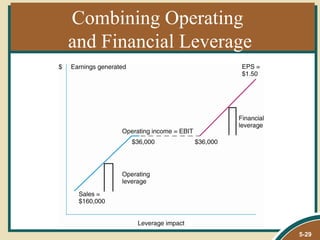
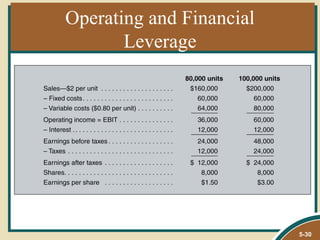
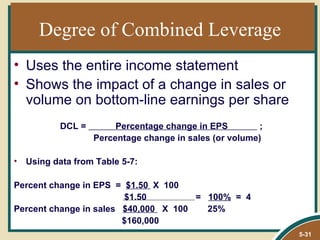
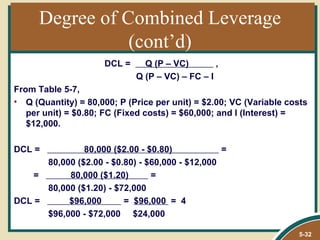
The price of the firm's output is not a determinant of the firm's cost functions. The cost functions are determined by factors of production like labor, capital, technology etc. and not by the price that the firm can charge for its output.
The document discusses various cost concepts in business economics including cost functions, opportunity costs, types of costs, fixed and variable costs, total costs, average costs, marginal costs, break-even analysis, contribution margin, and profit-volume ratio. It provides definitions and formulas for these concepts and illustrates their calculation and application in decision making.
The document discusses concepts related to cost and revenue analysis. It defines costs as expenses incurred to produce output and categorizes them as economic or accounting costs. It also discusses the differences between fixed, variable, total, average, and marginal costs in the short and long run. The document also defines revenue as the money received from sales and discusses concepts like total, average, and marginal revenue. Finally, it discusses the relationship between costs, revenue, and profit and how businesses aim to maximize profit.
- The document discusses different types of costs including explicit, economic, and relevant costs. It also discusses short-run and long-run costs.
- Graphs show cost curves including average total cost, average variable cost, marginal cost, and how they relate to quantity produced.
- The shapes of long-run cost curves are explained, including how returns to scale impact the average cost curve. Economies and diseconomies of scale as well as learning curves are also summarized.
The document discusses various cost concepts including:
- Opportunity cost and actual cost
- Business costs and full costs
- Explicit and implicit costs
- Short-run and long-run costs including fixed, variable, average, and marginal costs
- Traditional theories of costs including short-run cost curves and production rules
- Modern theories including the long-run average cost curve and concepts of economies and diseconomies of scale
Cost Output Relationship; Estimation of Cost and OutputDheeraj Rajput
Dheeraj Rawal presented on cost-output relationships and methods for estimating cost functions. There are two main types of cost estimation: short-run and long-run. Short-run estimation looks at costs when some inputs are fixed, while long-run allows all inputs to vary. Common short-run cost curves include total, average, and marginal cost curves. Long-run estimation derives a minimum cost curve from multiple short-run curves. Methods for estimating cost functions include accounting analysis, high-low analysis, scatterplots, and regression analysis. Challenges include accounting for time periods and cost adjustments over time.
This document provides an overview of key cost and revenue concepts for businesses. It defines accounting costs, opportunity costs, fixed costs, variable costs, average costs, marginal costs, sunk costs, total revenue, average revenue and marginal revenue. It explains how these concepts are used in business decision making and their relationships through diagrams of cost and revenue curves.
In this presentation, we will discuss in details about cost of production and various concepts of cost like fixed cost, variable cost, average cost, marginal costs, etc.
To know more about Welingkar School’s Distance Learning Program and courses offered, visit:
http://www.welingkaronline.org/distance-learning/online-mba.html
Economic Presentation: Cost Theory and AnalysisBilal Mughal
The document discusses different types of costs including:
1. Accounting costs include expenses incurred during production adjusted for depreciation, while economic costs include explicit payments to factors of production as well as implicit opportunity costs.
2. In the short-run, costs are classified as fixed, variable, total, average fixed, average variable, and marginal based on their relationship to changing output levels.
3. In the long-run, all factors are variable and long-run total, average, and marginal cost curves are defined based on minimum cost production at different output scales.
The document discusses theories of costs in the short run and long run for firms. In the short run, costs are classified as fixed or variable. Fixed costs do not change with output while variable costs do change with output. In the long run, nothing is fixed. Long run average cost (LRAC) curves illustrate average costs when all factors of production can be varied. LRAC curves are U-shaped and reflect economies of scale at low outputs and diseconomies of scale at high outputs. LRAC curves envelop multiple short run average cost curves as firms choose the optimal factory size.
The document discusses the theory of cost, including various cost concepts and cost curves. It covers accounting concepts such as opportunity cost and actual cost as well as analytical concepts such as fixed and variable costs. The document also examines cost functions including linear, quadratic and cubic forms. It analyzes short-run and long-run cost curves, discussing total cost, average cost and marginal cost. Finally, the document addresses economies and diseconomies of scale and assigns further reading on the economics of scale.
The cost of production/Chapter 7(pindyck)RAHUL SINHA
content
•MEASURING COST: WHICH COSTS MATTER?
•Fixed and variable cost
•Fixed versus sunk cost
•Amortizing Sunk Costs
•Marginal cost
•Average cost
•Determinants of short run cost
•Diminishing marginal returns
•The shapes of cost curves
•The Average–Marginal Relationship
•Costs in a long run
•Cost minimizing input choices
•Isocost lines
•Marginal rate of technical substitution
•Expansion path
•The Inflexibility of Short-Run Production
•Long run average cost
•Economies and Diseconomies of Scale
•The Relationship Between Short-Run and Long-Run Cost
•Break even analysis
This document provides an overview of key concepts in cost revenue analysis, including the production process, fixed and variable inputs, short-run versus long-run costs, the production function, marginal product, the law of diminishing returns, economic versus accounting costs, cost curves, revenue analysis, break-even and shutdown points, and scales of production in the long run. It defines important terms and concepts and provides examples to illustrate them.
This document discusses production functions and the relationship between production and costs. It defines short-run and long-run costs. In the short-run, some inputs are fixed while in the long-run all inputs are variable. The short-run cost curves are U-shaped and average total cost is minimized at the minimum point where marginal cost intersects average total cost. Changes in input prices can shift these cost curves. In the long-run, multiple short-run average cost curves make up the long-run average cost curve, which is minimized at minimum efficient scale. Economies and diseconomies of scale are also discussed.
Managerial Economics (Chapter 8 - Theory and Estimation of Cost)Nurul Shareena Misran
This document discusses the theory and estimation of cost in the short run for firms. It defines total, fixed, variable, average, and marginal costs. Total cost is the sum of fixed and variable costs. In the short run, as output increases, average fixed cost decreases while average variable and total costs initially decrease due to economies of scale but eventually increase due to diminishing returns. This results in U-shaped average total cost curves. Marginal cost intersects average costs at their minimum points. Technology improvements and input price changes can shift these cost curves. Cost functions are often modeled using cubic, quadratic, or linear equations.
This document discusses different types of costs related to production. It defines money cost, nominal cost, real cost, opportunity cost, implicit cost, explicit cost, accounting cost, social cost, and entrepreneur's cost. It also covers classification of costs, elements of costs, short-run costs including fixed, variable, total, average and marginal costs. Finally, it discusses long-run cost curves including long-run average cost and long-run marginal cost curves.
The document discusses various concepts related to cost analysis and estimation including:
1. It defines different types of costs such as historical costs, replacement costs, opportunity costs, explicit and implicit costs, incremental costs, sunk costs, fixed costs, and variable costs.
2. It explains short-run and long-run costs and how cost curves like total cost, average cost, and marginal cost change in the short-run and long-run.
3. It discusses economies of scale and how long-run average costs are U-shaped, initially falling with scale due to product, plant and firm level economies of scale, before rising again due to diseconomies of scale.
This document discusses cost concepts and types of costs. It defines explicit costs as actual money expenditures paid to outsiders, and implicit costs as the estimated value of owner-supplied inputs including normal profit. Cost is a function of output, and types of costs include total fixed costs, total variable costs, total costs, average fixed costs, average variable costs, average costs, and marginal costs. Long-run costs are all variable as all factors are variable. Economies of scale provide cost advantages from expansion, including pecuniary and real economies, while internal economies come from changes within the firm and external economies from changes outside the firm like government policies.
The document defines short-run and long-run costs, and explains the relationships between total, fixed, and variable costs. It also defines average and marginal costs. Specifically, it states that in the short-run, output can be increased or decreased while fixed costs remain unchanged. Total cost equals fixed plus variable cost. Average and marginal cost curves are also discussed, with average cost initially declining and then increasing due to diminishing returns.
This document discusses cost analysis and various cost concepts. It begins by defining cost analysis and its importance in business decision making. It then outlines several types of costs including: opportunity cost, economic cost, accounting cost, private and social costs, incremental and sunk costs, direct and indirect costs, average, marginal and total costs. It also discusses cost-output relationships in the short-run and long-run, factors determining costs, and break-even analysis. The key purpose is to provide an overview of different cost concepts and cost-output relationships that are important for business analysis and decision making.
This document discusses cost-output relationships in both the short run and long run. In the short run, costs are analyzed using average fixed cost, average variable cost, and average total cost. Average fixed cost decreases with more output while average variable cost first decreases and then increases. Average total cost initially decreases and then increases. In the long run, all factors of production can be varied. Total cost, average cost, and marginal cost are analyzed. The long run cost curve is derived by combining multiple short run cost curves and joining their tangency points. Long run costs are important for determining optimal scale and size through considering factors like demand forecasts and profits.
The document discusses cost theory concepts including opportunity costs, explicit and implicit costs, short-run and long-run costs, fixed and variable costs, total cost, average cost, and marginal cost. It explains how average, marginal, and total costs are related and how their curves are shaped. Specifically, it summarizes that marginal cost and short-run average cost curves slope upward due to diminishing returns, while the long-run average cost curve is U-shaped as economies of scale initially lower costs but diseconomies later raise them. The envelope relationship shows that short-run average costs are always above the minimum long-run average cost.
This document discusses the costs of production for a firm. It defines explicit costs as actual money expenditures and implicit costs as opportunity costs. Fixed costs do not change with output, while variable costs change as output increases. Total costs are the sum of total fixed and total variable costs. The shapes of the average and marginal cost curves are explained, with average costs initially decreasing and then increasing, and marginal costs first decreasing and then increasing. In the long run, as firms expand production, they experience decreasing costs, constant costs, and eventually increasing costs due to returns to scale. The long run average cost curve sits below short run average cost curves and indicates the efficient level of production.
The document discusses cost concepts and their application. It defines different types of costs such as fixed costs, variable costs, opportunity costs, sunk costs, explicit costs, and implicit costs. It also discusses total cost, which is the sum of fixed and variable costs. The total cost equation and linear cost equation are presented. Examples are provided to illustrate calculating total production costs, break-even points, and profits using the total cost equation. Location selection for facilities is also discussed, with factors like proximity to markets and suppliers, labor availability, and costs being considered in a break-even analysis.
This document discusses key concepts related to business costs including:
1. It defines economic costs, accounting costs, and sunk costs.
2. It explains the differences between short-run and long-run costs, and how total, average, and marginal costs are calculated in each time period.
3. It provides examples of cost schedules and diagrams cost curves, discussing their characteristics and relationships.
Cost refers to the total expenditure incurred by a producer to produce a given level of output. It includes explicit costs, which are cash payments to factors of production, and implicit costs, which are imputed costs of self-owned resources. Total cost is the sum of fixed costs, which do not vary with output, and variable costs, which do vary with output. Marginal cost is the change in total cost from producing one additional unit of output. It is U-shaped, initially decreasing and then increasing, reflecting the law of variable proportions. Average cost is total cost divided by output and is the sum of average fixed cost and average variable cost.
- Leverage provides the framework for financing decisions and can be defined as using an asset or source of funds that requires paying a fixed cost or return.
- Operating leverage is associated with fixed operating costs and how much they magnify changes in sales on operating profits. Financial leverage measures how debt impacts changes in earnings per share.
- Degree of operating leverage (DOL) and degree of financial leverage (DFL) are used to measure the sensitivity of profits and earnings to changes in sales and operating profits respectively. Higher leverage means greater risk but also greater potential returns.
FINANCAL MANAGEMENT PPT BY FINMANLeverage and capital structure by bosogon an...Mary Rose Habagat
This document discusses leverage and capital structure. It begins by defining leverage as the use of fixed costs to magnify returns, and discusses how leverage increases risk and return. The document then outlines 6 learning goals covering topics like breakeven analysis, the different types of leverage (operating, financial, total), and theories of capital structure. It provides examples and formulas to demonstrate concepts like calculating breakeven points and measuring the degrees of different types of leverage.
This document discusses various methods for valuing stocks, including discounted cash flow models like the dividend discount model and free cash flow models. It compares the cash flows to bond investors versus equity investors. Key valuation methods covered include relative valuation using price-earnings ratios and multiples of book value per share. The document also provides examples of calculating stock values using these various approaches.
1. Leverage reflects the responsiveness of one financial variable to changes in another variable. It is measured by the percentage change in the dependent variable divided by the percentage change in the independent variable.
2. Leverage refers to using fixed costs to magnify returns. There are operating fixed costs like rent and financial fixed costs like interest. Operating, financial, and total leverage can be measured.
3. Operating leverage measures the relationship between sales and earnings before interest and taxes (EBIT). It indicates how much EBIT changes with sales. Firms with high operating leverage face more risk from changes in sales.
The document discusses financial evaluation methods for analyzing decision alternatives. It defines key terms like investment costs, cost of capital, discounted cash flow analysis, and presents examples. The objectives of financial evaluation are to array and quantify expected results by comparing investment costs to financial benefits. Common metrics used are net present value, benefit-cost ratio, payback period, and internal rate of return.
This document discusses the concepts of leverage in financial management, including:
- Operating leverage refers to using fixed operating costs to magnify changes in profits relative to sales changes. It establishes the relationship between EBIT and sales.
- Financial leverage refers to using fixed financial charges to magnify the effect of EBIT changes on earnings per share. It establishes the relationship between EBIT and EPS.
- Combined leverage is the product of operating leverage and financial leverage, representing the relationship between contribution and taxable income. It measures the percentage change in EPS resulting from a percentage change in sales.
- Examples are provided to illustrate how to calculate operating, financial, and combined leverage based on information about a company's sales, costs,
This PPT contains the full detail of topic leverage in financial management
it covers following topics :-
Meaning of Leverage
Types of Leverage
Operating Leverage
Financial Leverage
Difference between Operating & Financial Leverage
Combined Leverage
Illustrations
Exercise
This document provides an overview of leverage and different types of leverage from a lecture on financial management. It begins by defining leverage as the relationship between two interrelated variables and how it refers to using fixed costs or assets to increase shareholder returns. It then discusses three main types of leverage - operating, financial, and combined leverage. Operating leverage is the relationship between sales and operating profit, and is affected by fixed costs. Financial leverage is the relationship between operating profit and earnings per share. The document provides examples and formulas for calculating operating and combined leverage.
Leverage refers to using borrowed capital to increase the potential return of an investment. It is calculated as the debt-to-equity ratio. There are different types of leverage including operating leverage and financial leverage. Operating leverage measures how fixed costs affect earnings, while financial leverage measures how interest expenses affect earnings. The degree of combined leverage summarizes how operating and financial leverage together impact earnings per share given a change in sales. It can help determine the optimal levels of operating and financial leverage for a firm.
The document discusses various capital budgeting techniques for evaluating investment projects, including net present value (NPV), payback period, internal rate of return (IRR), and relevant cash flows. It explains how to calculate NPV, payback period, and IRR, and highlights the advantages and disadvantages of each method. Special considerations are discussed for situations with unconventional cash flows, mutually exclusive projects, and multiple rates of return.
The document discusses capital structure and the advantages and disadvantages of debt versus equity financing. It summarizes Modigliani and Miller's seminal work which established that in a perfect capital market without taxes, a firm's value is independent of its capital structure. When taxes are considered, debt provides a tax shield that increases firm value up to a point, after which additional debt increases financial distress costs. The optimal capital structure balances the tax benefits of debt against the costs of financial distress.
The document discusses capital structure and the tradeoffs between debt and equity financing. It summarizes Modigliani and Miller's seminal work which established that in a perfect capital market without taxes, a firm's value is independent of its capital structure. Specifically, M&M Proposition 1 states that splitting cash flows between debt and equity holders does not change total firm value. Proposition 2 states that the expected return of equity increases with leverage in a way that exactly offsets the reduced risk of debt.
Leverage and sharia law b.v.raghunandanSVS College
This document discusses leverages and Sharia law. It defines leverage as cost-volume-profit analysis where costs are divided into fixed and variable costs. Economists derived the break-even point, which is a managerial decision making tool. Operating leverage measures the impact of sales changes on earnings before interest and taxes, while financial leverage measures the impact on earnings per share. Sharia law prohibits interest but allows profit sharing, contributing to sustainable financial management principles like absorbing risk rather than hedging with derivatives.
Leverage refers to using fixed costs to increase returns for owners. In finance, leverage allows firms to use fixed-cost funds like debt and preferred shares to increase earnings for equity shareholders. There are three types of leverage: operating, financial, and combined. Operating leverage measures how fixed costs affect operating income with sales changes. Financial leverage measures how interest expenses affect EPS. Combined leverage multiplies operating and financial leverage to measure total leverage.
Analytical techniques like ratio analysis, vertical analysis, horizontal analysis, and trend analysis allow businesses to study financial reports and make informed decisions. Key financial ratios analyze profitability, financial stability, and management effectiveness. Profitability ratios like gross profit ratio and net profit ratio indicate ability to earn income. Current ratio and quick ratio measure short-term liquidity. Equity ratio and debt ratio show sources of financing. Accounts receivable and inventory turnover ratios evaluate management policies. Comparing ratios to benchmarks helps assess performance.
1) The document discusses how a company's capital structure and use of debt can impact its value and shareholder returns. It considers how debt can lower the weighted average cost of capital but also increase bankruptcy risk.
2) An example is provided showing how debt can increase earnings per share but also expose shareholders to more risk in economic downturns. The optimal level of debt depends on factors like a company's fixed costs and risk of bankruptcy.
3) Tax benefits of debt are discussed, as interest expenses are tax deductible. However, higher debt also increases financial risk and the required return on equity. The overall impact on the weighted average cost of capital from debt is uncertain and depends on specific company and economic conditions
This document discusses investment in securities. It begins by introducing securities and how they are traded in capital markets. There are two main types of securities - equity instruments and debt instruments, with hybrids having characteristics of both. Equity represents ownership while debt represents borrowing with a fixed maturity. Common stocks are the most common equity instrument, providing residual ownership, while bonds are the most common debt instrument with fixed interest payments. The document then discusses various equity-related concepts like initial public offerings, stock screening for Shariah compliance, and the components of an Islamic equities market.
Wealth planning and management is a comprehensive program to plan and manage one's finances. It is useful for high-net-worth individuals and corporations. Users require services like investments, taxes, banking, and insurance. Providers include banks, fund managers, insurance agents, and more. Various organizations govern the industry and establish codes of ethics for professionals to act with integrity, objectivity, and put clients' interests first. Regulators also oversee the industry to protect consumers and maintain confidence.
The document discusses capital markets and securities. It covers various topics such as the types of security markets (money markets and capital markets), listing requirements for exchanges like the NYSE, how the organization of markets has changed with the rise of electronic communication networks, and how efficiently markets incorporate information into stock prices. It provides an overview of the key components and functioning of capital markets.
The document discusses wealth planning and management through the Islamic instrument of waqf (endowment). It begins by explaining the hadith about a person's good deeds continuing after death through recurring charity, beneficial knowledge, and righteous children. It then defines waqf and describes the three main types: public waqf, family waqf, and combined public-family waqf. The conditions for valid waqf creation and permissible waqf assets are also summarized.
Based on the information provided:
- Short-term rates increased to 11%
- Long-term rates remain at 13%
- Temporary current assets remain at $1,000,000
- Permanent current assets remain at $2,000,000
- Fixed assets remain at $1,200,000
- Earnings before interest and taxes remain at $996,000
- Tax rate remains at 40%
With the new short-term rate of 11%, short-term interest expense would be:
Temporary current assets of $1,000,000 at 11% = $110,000
Long-term interest expense and the calculation of earnings after taxes remains the same.
Therefore
The document provides an overview of capital markets and security markets. It discusses how capital is raised in capital markets through various financial instruments like bonds, stocks, and funds. It also describes the three main sectors of the US economy and how physical and electronic security markets work. It outlines the key legislation governing security markets and how prices rapidly adjust in efficient markets.
This chapter discusses various topics in investment banking including public and private placements. It describes the roles of investment bankers such as underwriting securities, making markets, and advising clients. It also covers the process of distributing securities including setting prices and dealing with dilution. Additionally, it compares public versus private financing and discusses leveraged buyouts. In closing, it briefly touches on going private, methods of doing so, and privatization.
The document provides an overview of capital markets and security markets. It discusses how capital is raised in capital markets through various financial instruments like bonds, stocks, and funds. It also describes the key participants in capital markets like households, corporations, and government entities. The security markets are organized into various submarkets and exchanges. Over time, markets have become more electronic and integrated through technological advances. Regulations aim to make markets fair, transparent, and protect investors.
The document discusses various models for modern applications of cash waqf, including:
1. Waqf shares model where investors purchase shares in a religious institution that manages the funds.
2. Waqf takaful model where contributors pay monthly amounts that are invested, with profits used for charitable purposes.
3. Direct model where contributors deposit funds directly into bank accounts of religious authorities.
4. Mobile model allowing contributions via SMS that are invested and profits used for charity.
The document provides an overview of capital markets and security markets. It discusses how capital is raised in capital markets through various financial instruments like bonds, stocks, and funds. It also describes the key participants in capital markets like households, corporations, and government entities. The security markets are organized into various submarkets and exchanges. Over time, markets have become more electronic and integrated through technological advances. Stringent regulations aim to promote efficiency and protect investors.
The document discusses various sources of short-term financing including trade credit, bank loans, commercial paper, and borrowing larger amounts. It covers topics such as lines of credit, prime rates, LIBOR rates, compensating balances, maturity provisions, and the costs of commercial bank financing. The document also discusses using accounts receivable as collateral through methods like pledging receivables or factoring receivables.
The document discusses current asset management, including cash management, marketable securities, accounts receivable, and inventory management. It covers topics such as cash flow cycles, float, credit policies, inventory levels, and inventory decision models. The goal of current asset management is to balance liquidity needs with maximizing returns through techniques like minimizing cash balances and actively managing accounts receivable and inventory levels.
The document discusses current asset management, including cash management, management of marketable securities, accounts receivable, and inventory management. It covers topics such as cash flow cycles, improving collections and extending disbursements, inventory policy and economic order quantity models, just-in-time inventory management, and areas of concern for various current asset management strategies and techniques. The overall document provides an overview of key considerations and approaches for managing a company's current assets.
The document discusses current asset management, including cash management, marketable securities, accounts receivable, and inventory management. It covers topics such as cash flow cycles, float, credit policies, inventory levels, and inventory decision models. The goal of current asset management is to balance liquidity needs with maximizing returns through techniques like minimizing cash balances and actively managing receivables, marketable securities, and inventory levels.
This document outlines key concepts around working capital management and financing decisions. It discusses matching a firm's current asset levels with forecasted sales and production schedules. It also covers controlling assets by matching sales and production levels. Additionally, it examines using long-term versus short-term financing to fund different types of current assets, as well as how financing decisions impact risk and profitability. Overall, the document provides an overview of effective working capital management strategies.
The document discusses key concepts related to Islamic wealth planning and management, including:
1) It describes the asset allocation process as systematic for reducing overall market risk and unsystematic for reducing company-specific risks through diversification.
2) It outlines the degrees of market efficiency from strong to weak and their implications for using fundamental and technical analysis.
3) It explains that investors should buy undervalued stocks expected to increase in price and sell overvalued stocks expected to decrease in price.
The document discusses the importance of wealth allocation in successful wealth planning. It describes the main components of the wealth allocation process as establishing objectives, identifying opportunities and risks/constraints, and determining potential investment channels. The two major components are the investment policy statement and portfolio management process. It then provides details on what should be included in the investment policy statement and introduces the portfolio allocation scoring system used to determine the appropriate asset allocation mix based on a client's total score.
The document discusses the nature and scope of wealth planning in Islam. It defines wealth planning and compares it to financial planning, noting their similarities such as both aiming to enhance value, but also their differences like wealth planning being long term focused. It also compares conventional and Islamic wealth planning, noting similarities like both containing accumulation and distribution functions, but differences like Islamic wealth planning needing to follow Shariah law. The significance of different stages in the wealth planning process is explained. The concept of trade-offs is discussed in relation to risk and return, and how the Islamic concept differs by also considering trade-offs between this life and the next.
This document provides an overview of the goals and functions of financial management. It discusses how financial management links economic theory and accounting data. The primary goal of financial managers is to maximize shareholder wealth while balancing risk. Modern issues include risk-return analysis, capital structure, and the impact of inflation and technology. Financial markets help allocate capital and provide feedback to companies on performance.
ISO/IEC 27001, ISO/IEC 42001, and GDPR: Best Practices for Implementation and...PECB
Denis is a dynamic and results-driven Chief Information Officer (CIO) with a distinguished career spanning information systems analysis and technical project management. With a proven track record of spearheading the design and delivery of cutting-edge Information Management solutions, he has consistently elevated business operations, streamlined reporting functions, and maximized process efficiency.
Certified as an ISO/IEC 27001: Information Security Management Systems (ISMS) Lead Implementer, Data Protection Officer, and Cyber Risks Analyst, Denis brings a heightened focus on data security, privacy, and cyber resilience to every endeavor.
His expertise extends across a diverse spectrum of reporting, database, and web development applications, underpinned by an exceptional grasp of data storage and virtualization technologies. His proficiency in application testing, database administration, and data cleansing ensures seamless execution of complex projects.
What sets Denis apart is his comprehensive understanding of Business and Systems Analysis technologies, honed through involvement in all phases of the Software Development Lifecycle (SDLC). From meticulous requirements gathering to precise analysis, innovative design, rigorous development, thorough testing, and successful implementation, he has consistently delivered exceptional results.
Throughout his career, he has taken on multifaceted roles, from leading technical project management teams to owning solutions that drive operational excellence. His conscientious and proactive approach is unwavering, whether he is working independently or collaboratively within a team. His ability to connect with colleagues on a personal level underscores his commitment to fostering a harmonious and productive workplace environment.
Date: May 29, 2024
Tags: Information Security, ISO/IEC 27001, ISO/IEC 42001, Artificial Intelligence, GDPR
-------------------------------------------------------------------------------
Find out more about ISO training and certification services
Training: ISO/IEC 27001 Information Security Management System - EN | PECB
ISO/IEC 42001 Artificial Intelligence Management System - EN | PECB
General Data Protection Regulation (GDPR) - Training Courses - EN | PECB
Webinars: https://pecb.com/webinars
Article: https://pecb.com/article
-------------------------------------------------------------------------------
For more information about PECB:
Website: https://pecb.com/
LinkedIn: https://www.linkedin.com/company/pecb/
Facebook: https://www.facebook.com/PECBInternational/
Slideshare: http://www.slideshare.net/PECBCERTIFICATION
This presentation includes basic of PCOS their pathology and treatment and also Ayurveda correlation of PCOS and Ayurvedic line of treatment mentioned in classics.
A workshop hosted by the South African Journal of Science aimed at postgraduate students and early career researchers with little or no experience in writing and publishing journal articles.
Chapter wise All Notes of First year Basic Civil Engineering.pptxDenish Jangid
Chapter wise All Notes of First year Basic Civil Engineering
Syllabus
Chapter-1
Introduction to objective, scope and outcome the subject
Chapter 2
Introduction: Scope and Specialization of Civil Engineering, Role of civil Engineer in Society, Impact of infrastructural development on economy of country.
Chapter 3
Surveying: Object Principles & Types of Surveying; Site Plans, Plans & Maps; Scales & Unit of different Measurements.
Linear Measurements: Instruments used. Linear Measurement by Tape, Ranging out Survey Lines and overcoming Obstructions; Measurements on sloping ground; Tape corrections, conventional symbols. Angular Measurements: Instruments used; Introduction to Compass Surveying, Bearings and Longitude & Latitude of a Line, Introduction to total station.
Levelling: Instrument used Object of levelling, Methods of levelling in brief, and Contour maps.
Chapter 4
Buildings: Selection of site for Buildings, Layout of Building Plan, Types of buildings, Plinth area, carpet area, floor space index, Introduction to building byelaws, concept of sun light & ventilation. Components of Buildings & their functions, Basic concept of R.C.C., Introduction to types of foundation
Chapter 5
Transportation: Introduction to Transportation Engineering; Traffic and Road Safety: Types and Characteristics of Various Modes of Transportation; Various Road Traffic Signs, Causes of Accidents and Road Safety Measures.
Chapter 6
Environmental Engineering: Environmental Pollution, Environmental Acts and Regulations, Functional Concepts of Ecology, Basics of Species, Biodiversity, Ecosystem, Hydrological Cycle; Chemical Cycles: Carbon, Nitrogen & Phosphorus; Energy Flow in Ecosystems.
Water Pollution: Water Quality standards, Introduction to Treatment & Disposal of Waste Water. Reuse and Saving of Water, Rain Water Harvesting. Solid Waste Management: Classification of Solid Waste, Collection, Transportation and Disposal of Solid. Recycling of Solid Waste: Energy Recovery, Sanitary Landfill, On-Site Sanitation. Air & Noise Pollution: Primary and Secondary air pollutants, Harmful effects of Air Pollution, Control of Air Pollution. . Noise Pollution Harmful Effects of noise pollution, control of noise pollution, Global warming & Climate Change, Ozone depletion, Greenhouse effect
Text Books:
1. Palancharmy, Basic Civil Engineering, McGraw Hill publishers.
2. Satheesh Gopi, Basic Civil Engineering, Pearson Publishers.
3. Ketki Rangwala Dalal, Essentials of Civil Engineering, Charotar Publishing House.
4. BCP, Surveying volume 1
हिंदी वर्णमाला पीपीटी, hindi alphabet PPT presentation, hindi varnamala PPT, Hindi Varnamala pdf, हिंदी स्वर, हिंदी व्यंजन, sikhiye hindi varnmala, dr. mulla adam ali, hindi language and literature, hindi alphabet with drawing, hindi alphabet pdf, hindi varnamala for childrens, hindi language, hindi varnamala practice for kids, https://www.drmullaadamali.com
How to Make a Field Mandatory in Odoo 17Celine George
In Odoo, making a field required can be done through both Python code and XML views. When you set the required attribute to True in Python code, it makes the field required across all views where it's used. Conversely, when you set the required attribute in XML views, it makes the field required only in the context of that particular view.
Main Java[All of the Base Concepts}.docxadhitya5119
This is part 1 of my Java Learning Journey. This Contains Custom methods, classes, constructors, packages, multithreading , try- catch block, finally block and more.
2. Chapter Outline
• What is leverage?
• Break-even analysis
• Operating leverage
• Financial leverage
• Combined leverage
• Potential profits or increased risk?
5-2
3. What is Leverage?
• Use of special forces and effects to magnify
or produce more than the normal results
from a given course of action
– Can produce beneficial results in favorable
conditions
– Can produce highly negative results in
unfavorable conditions
5-3
4. Leverage in a Business
• Determining type of fixed operational costs
– Plant and equipment
• Eliminates labor in production of inventory
– Expensive labor
• Lessens opportunity for profit but reduces risk
exposure
• Determining type of fixed financial costs
– Debt financing
• Substantial profits but failure to meet contractual
obligations can result in bankruptcy
– Selling equity
• Reduces potential profits but minimize risk exposure
5-4
5. Operating Leverage
• Extent to which fixed assets and associated
fixed costs are utilized in a business
• Operational costs include:
– Fixed
– Variable
– Semivariable
5-5
7. Break-Even Analysis
• The break-even point is at 50,000 units,
where the total costs and total revenue lines
intersect
Units = 50,000 .
Total Variable Fixed Costs Total Costs Total Revenue Operating Income
Costs (TVC) (FC) (TC) (TR) (loss)
(50,000 X $0.80) (50,000 X $2)
$40,000 $60,000 $100,000 $100,000 0
5-7
8. Break-Even Analysis (cont’d)
• The break-even point can also be calculated
by:
Fixed costs = Fixed costs = FC
Contribution margin Price – Variable cost per unit P – VC
i.e. $60,000 = $60,000 = 50,000 units
$2.00 - $0.80 $1.20
5-8
10. A Conservative Approach
• Some firms choose not to operate at high
degrees of operating leverage
– More expensive variable costs may be
substituted for automated plant and equipment
– This approach may cut into potential profitability
of the firm
5-10
13. The Risk Factor
• Factors influencing decision on maintaining
a conservative or leveraged stance include:
– Economic condition
– Competitive position within industry
– Future position – stability versus market
leadership
– Matching an acceptable return with a desired
level of risk
5-13
14. Cash Break-Even Analysis
• Helps in analyzing the short-term outlook of
a firm
• Noncash items are excluded:
– Depreciation
– Sales (accounts receivable rather than cash)
– Purchase of materials
– Accounts payable
5-14
15. Degree of Operating Leverage
(DOL)
• Percentage change in operating income
– Occurs as a result of a percentage change in
units sold
– Computed only over a profitable range of
operations
– Directly proportional to the firm’s break-even
point
DOL = Percent change in operating income
Percent change in unit volume
5-15
17. Computation of DOL
• Leveraged firm:
DOL = Percent change in operating income = $24,000 X 100
Percent change in unit volume $36,000
20,000 X 100
80,000
= 67% = 2.7
25%
• Conservative firm:
DOL = Percent change in operating income = $8,000 X 100
Percent change in unit volume $20,000
20,000 X 100
80,000
= 40% = 1.6
25%
5-17
18. Algebraic Formula for DOL
DOL = Q (P – VC)
Q (P – VC) – FC
Where,
• Q = Quantity at which DOL is computed
• P = Price per unit
• VC = Variable costs per unit
• FC = Fixed costs
• For the leveraged firm, assume Q = 80,000, with P = $2, VC = $0.80,
and FC = $60,000:
DOL = 80,000 ($2.00 - $0.80) ;
80,000 ($2.00 - $0.80) - $60,000
= 80,000 ($1.20) = $96,000 ;
80,000 ($1.20) - $60,000 $96,000 - $60,000
i.e. DOL = 2.7
5-18
19. Limitations of Analysis
• Weakening of price in an attempt to capture
an increasing market
• Cost overruns when moving beyond an
optimum-size operation
• Relationships are not fixed
5-19
21. Financial Leverage
• Reflects the amount of debt used in the
capital structure of the firm
– Determines how the operation is to be financed
– Determines the performance between two firms
having equal operating capabilities
BALANCE SHEET
Assets Liabilities and Net Worth
Operating leverage Financial leverage
5-21
22. Impact on Earnings
• Examine two financial plans for a firm, where
$200,000 is required to carry the assets
Total Assets = $200,000
Plan A (leveraged) Plan B (conservative)
Debt (8% interest) $150,000 ($12,000 interest) $50,000 ($4,000 interest)
Common stock 50,000 (8000 shares at $6.25) 150,000 (24,000 shares at $6.25)
Total financing $200,000 $200,000
5-22
25. Degree of Financial Leverage
DFL = Percent change in EPS
Percent change in EBIT
• For the purpose of computation, it can be restated as:
DFL = EBIT .
EBIT – I
• Plan A (Leveraged):
DFL = EBIT = $36,000 = $36,000 = 1.5
EBIT – I $36,000 - $12,000 $24,000
• Plan B (Conservative):
DFL = EBIT = $36,000 = $36,000 = 1.1
EBIT – I $36,000 - $4,000 $32,000
5-25
26. Limitations to Use
of Financial Leverage
• Beyond a point, debt financing is detrimental
to the firm
– Lenders will perceive a greater financial risk
– Common stockholders may drive down the price
• Recommended for firms that are:
– In an industry that is generally stable
– In a positive stage of growth
– Operating in favorable economic conditions
5-26
27. Combining Operating
and Financial Leverage
• Combined leverage: when both leverages
allow a firm to maximize returns
– Operating leverage:
• Affects the asset structure of the firm
• Determines the return from operations
– Financial leverage:
• Affects the debt-equity mix
• Determines how the benefits received will be
allocated
5-27
31. Degree of Combined Leverage
• Uses the entire income statement
• Shows the impact of a change in sales or
volume on bottom-line earnings per share
DCL = Percentage change in EPS ;
Percentage change in sales (or volume)
• Using data from Table 5-7:
Percent change in EPS = $1.50 X 100
$1.50 = 100% = 4
Percent change in sales $40,000 X 100 25%
$160,000
5-31
32. Degree of Combined Leverage
(cont’d)
DCL = Q (P – VC) ,
Q (P – VC) – FC – I
From Table 5-7,
• Q (Quantity) = 80,000; P (Price per unit) = $2.00; VC (Variable costs
per unit) = $0.80; FC (Fixed costs) = $60,000; and I (Interest) =
$12,000.
DCL = 80,000 ($2.00 - $0.80) =
80,000 ($2.00 - $0.80) - $60,000 - $12,000
= 80,000 ($1.20) =
80,000 ($1.20) - $72,000
DCL = $96,000 = $96,000 = 4
$96,000 - $72,000 $24,000
5-32