Downloaded 225 times


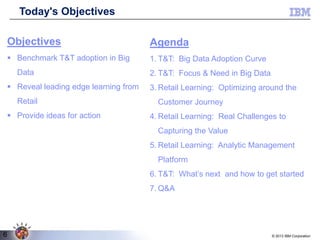
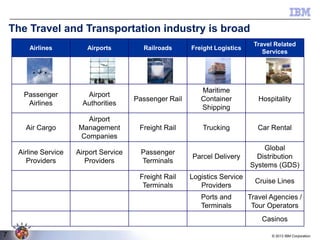
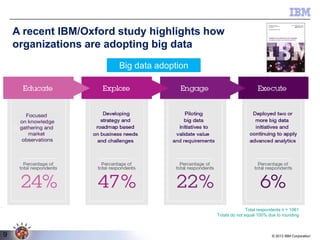
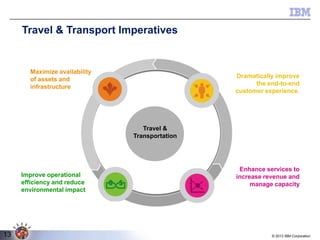

The webinar discusses how the travel and transportation industry can leverage big data, social media, and customer analytics, highlighting the adoption curve and the importance of understanding customer insights. It presents the opportunity to enhance operational efficiency while improving customer experiences, presenting solutions such as an analytic management platform to connect data sources and optimize marketing strategies. Key takeaways include the need for targeted initiatives to capture emerging trends and the fragmented landscape that necessitates a coordinated approach to analytics.


