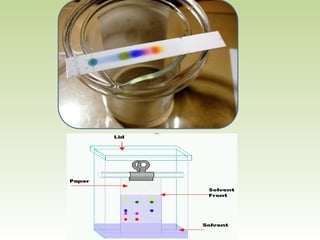
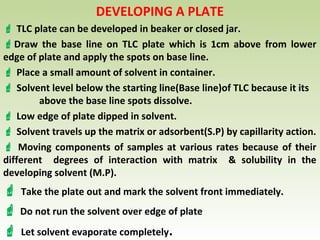
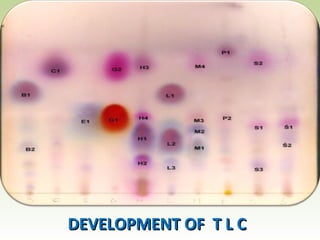
THIN LAYER CHROMATOGRAPHY
Presented By
Mr. K.Sudheerkumar
M Pharmacy., (PhD)
Faculty, Sri Shivani College of Pharmacy
Mulugu road,Warangal, Telangana State
India, E. mail : ksum2810@gmail.com
 TLC is widely used to separate chemical compounds
 It involves S.P – Consists of thin layer adsorbent material
 S.P usually consists of – silica gel , alumina, cellulose
immobilized onto a flat inert carrier sheet.
 M.P consists of the solution to be separated dissolved in
appropriate solvent.
 It is drawn through the plate via capillary action
 Used to determine and detect pigments in plant, pesticides or
insecticides in food, in forensic dept. to analyze dye composition
of fiber & identification of various compounds.
 TLC is universal analytical technique in chemical analysisTLC is universal analytical technique in chemical analysis
for separation of organic and inorganic matter.for separation of organic and inorganic matter.
 InIn 19381938, Izmailov and Shraiber describe basic principle, Izmailov and Shraiber describe basic principle
used it for separation of plant extract.used it for separation of plant extract.
 InIn 19441944, Consden, Gorden & Martin used filter papers for, Consden, Gorden & Martin used filter papers for
separating the Amino acids.separating the Amino acids.
 InIn 19501950, Kirchner identified terpenes on filter paper., Kirchner identified terpenes on filter paper.
 InIn 19581958, Stahl mainly created with bringing out the work, Stahl mainly created with bringing out the work
on preparing plates and separation of wide variety ofon preparing plates and separation of wide variety of
compounds.compounds.
 TLC – common used technique in synthetic chemistry for
identifying compounds
 Determining their purity
 Analyzing the progress of the reaction and also mechanism
involved.
 S.P may be solid or liquid & hold as a layer on solid support.
 It permits optimization of the solvent system for given
separation problem.
 Compared b/w C.C & TLC – this requires less quantity of
compounds & also much faster in progress.
PRINCIPLEPRINCIPLE
 The basic Principle is based on ADSORPTIONThe basic Principle is based on ADSORPTION
ChromatographyChromatography
 The component with more affinity towards the S.P-The component with more affinity towards the S.P-
travel slowertravel slower
 The component with lesser affinity towards the S.P -The component with lesser affinity towards the S.P -
travel fastertravel faster
 TLC is simple and rapid method - carried out by using thinTLC is simple and rapid method - carried out by using thin
layer of adsorbent on plates.layer of adsorbent on plates.
 TLC is included under both adsorption and partition
chromatographs.
 Separation of component may result due to adsorption
or partition
 both phenomenon depend upon nature of adsorbent
used on plate and solvent system used for the development.
 S.P – TLC plate, TLC paper is coated with silica gel
 In TLC separation – hydrogen bonding is main
intermolecular forces involved
 Polar molecules stick to plate
 Non- polar molecules do not stick to plate
 Non-polar molecules will spend a great amount of time
dissolved in eluent
 Separation of compounds occur due to differences in
partitioning b/w liquid and S.P
 More sensitive & less sample required
 Spraying with corrosive agents for identification possible
 TLC can be automated using forced solvent flow
 Running the plate in vacuum
 Capable chamber to dry the plate
 Recording the finished chromatograph – absorption /
fluorescence spectroscopy with light source
 Ability to program the solvent delivery makes it
convenient to do multiple developments in which the
solvent flows for a short period of time and TLC dried and
process repeated. This method refocuses the spots to
achieve higher resolution than in single run.
ADVANTAGES
 Low cost
 Short analysis time
 All spots can be visualized
 Adaptable to most pharmaceuticals
 Uses small quantities of solvents
 Requires minimal training
 Reliable and quick
 Minimal amount of equipment is needed
Densitometers can be used to increase
accuracy of spot concentration
TLC SUPERIOR OVER OTHER METHODS
 It requires little equipment
 Require little time for separation
 It is more sensitive
 Very small quantity of sample require for analysis
The method use for adsorption, partition, ion
exchange chromatography
 Component which are separated can be recovered
easily .
 Quantative separation of spot and zone are possible
 For identification is permitted
 Spraying of corrosive agent
OPERATIONAL TECHNIQUE INVOLVED
 Choice of adsorbent
 Preparation of plate
 Preparation and application of sample
 Choice of solvent
 Development of chromatogram
 Drying of chromatogram
 Location of spot
 Quantitative estimation
CHOICE OF ADSORBENT
 Two properties decide the selection:
1.particle size
2. homogeniscity
 Factors affecting selection:
1. Colorless
2. should have great mechanical strength
3. should not catalyze or decompose of
substance
4. should be insoluble with mobile phase
& the solvent used for elution
5. no reaction at time of separation
6. Adsorbent do not adhere to glass plate
7. Adsorbent particle size
8. To see whether compound is liable to react
chemically with adsorbent.
9. Nature of substance to be separated
10.Characteristic of compound to be separated
11. Solubility of compound
CLASSIFICATION OF ADSORBENTS USED
1.Classification according to binding strength:
A.Weak adsorbent: sucrose, starch, talc, cellulose
B. Intermediate adsorbent: silica gel, calcium carbonate, calcium
phosphate, magnesia
C.Strong adsorbent: alumina, charcoal
2. Classification according to nature:
A. Inorganic adsorbent: Silica, Silica gel, Alumina, Calcium phosphate,
Glass powder, Kieselguhr ,Magnesium silicate, Calcium silicate,
Phosphate , Ferric & Chromic oxides, Zinc carbonate & zinc ferro
cyanides, Bentonites
B. Organic adsorbent: Normal cellulose powder, Charcoal & activated
carbon, Starch, Sucrose, Manitol, Dextran gel
 SILICA GEL is granular porous form of silica
 Made synthetically from sodium silicate
 Silica gel is solid and used in chromatography as S.P
 Due to silica gel polarity – non polar components tend to
elute before polar ones hence named as NPC
 Hydrophobic groups (C18) attached to silica gel then polar
components elute first hence names as RPC.
 Synthetic nature of silica gel enables careful control of
pore size.
CELLULOSE
 Cellulose (C6H10O5)n is a long chain polymeric
polysaccharide carbohydrate of β – glucose
 Adsorbed water or alcohol can be retained by interaction
with hydroxyl groups
 Two types of cellulose are used in planar
chromatography:
1.Polymerization b/w 400-500 glucopyranose units
2. 40 – 200 glucopyranose units
ALUMINIUM OXIDE
 It is a chemical compound of aluminum and oxygen with
chemical formula – Al2O3
 Commonly referred to as alumina
 Manufactured in 3 pH ranges – acidic, basic and neutral
 Acidic compounds – phenols, sulphonic, carboxylic &
Amino acids are separated on acidic alumina
 Basic compounds – amines , dyes separated
Reverse Phase ChromatographyReverse Phase Chromatography
 In this the S.P is Non-polar & M.P is polar & it is widelyIn this the S.P is Non-polar & M.P is polar & it is widely
used in pharmaceutical analysis.used in pharmaceutical analysis.
1. Polar compounds get eluted first1. Polar compounds get eluted first
2. Non-polar compounds are retained for long time2. Non-polar compounds are retained for long time
Comparison of Normal Phase & Reverse Phase :Comparison of Normal Phase & Reverse Phase :
PARAMETER NORMAL PHASENORMAL PHASE REVERSE PHASEREVERSE PHASE
Stationary phaseStationary phase PolarPolar Non-polarNon-polar
Mobile phaseMobile phase Non-polarNon-polar PolarPolar
Compound elutedCompound eluted
firstfirst
Non-polarNon-polar PolarPolar
Compound elutedCompound eluted
lastlast
PolarPolar Non-polarNon-polar
Example of stationaryExample of stationary
phasephase
Silica gelSilica gel CC44 ,c,c88 –bonded phase–bonded phase
STATIONARY PHASE
NAMENAME COMPOSITIONCOMPOSITION
Silica gel HSilica gel H Silica gel without binderSilica gel without binder
Silica gel GSilica gel G Silica gel + CaSOSilica gel + CaSO44
Silica gel GFSilica gel GF Silica gel + Binder + fluorescentSilica gel + Binder + fluorescent
indicatorindicator
AluminaAlumina AlAl220033 Without BinderWithout Binder
AlAl220033 GG AlAl220033 + Binder+ Binder
Cellulose powderCellulose powder Cellulose Without BinderCellulose Without Binder
Cellulose powderCellulose powder Cellulose With BinderCellulose With Binder
Kieselguhr GKieselguhr G Diatomaceous earth + binderDiatomaceous earth + binder
Polyamide powderPolyamide powder PolyamidePolyamide
Fuller’s earthFuller’s earth Hydrous magnesium aluminaHydrous magnesium alumina
Magnesium SilicateMagnesium Silicate magnesolmagnesol
MOBILE PHASE
1)1)Nature of the substance to be separated i.e whether it isNature of the substance to be separated i.e whether it is
polar or non-polar.polar or non-polar.
2)2)Mode of ChromatographyMode of Chromatography
3)3)Nature of Stationary phaseNature of Stationary phase
4)4)Mode Separation i.e Analytical or Preparative techniqueMode Separation i.e Analytical or Preparative technique
 Examples: 1) Petroleum ether 2) CyclohexaneExamples: 1) Petroleum ether 2) Cyclohexane
3) Acetone 4) Toluene3) Acetone 4) Toluene
5) Ethyl acetate 6) Benzene5) Ethyl acetate 6) Benzene
7) Alcohols 8) Water7) Alcohols 8) Water
9) Chloroform 10) Pyridine9) Chloroform 10) Pyridine
CHOICE OF SOLVENT
Selection of M.P depends upon nature of substance
to be separated
Viscosity and polarity of S.P
Solvent used may be single or double phase system
e.g: n-hexane < cyclohexane< CCl4 < benzene <
toluene < CHCl3 < diethyl ether < ethyl acetate <
acetone < ethanol < Methanol < water
GLASS PLATES
 Three types :Three types :
1)1)Full plate : 20cm × 20 cm.Full plate : 20cm × 20 cm.
2)2)Half plate : 20cm × 10 cm.Half plate : 20cm × 10 cm.
3)3)Quarter plate : 20cm × 5 cm.Quarter plate : 20cm × 5 cm.
 Microscopic slides can also be used forMicroscopic slides can also be used for
monitoring the progress of a chemical reaction.monitoring the progress of a chemical reaction.
DEVELOPING A PLATE
 TLC plate can be developed in beaker or closed jar.
Draw the base line on TLC plate which is 1cm above from lower
edge of plate and apply the spots on base line.
 Place a small amount of solvent in container.
 Solvent level below the starting line(Base line)of TLC because it its
above the base line spots dissolve.
 Low edge of plate dipped in solvent.
 Solvent travels up the matrix or adsorbent(S.P) by capillarity action.
 Moving components of samples at various rates because of their
different degrees of interaction with matrix & solubility in the
developing solvent (M.P).
 Take the plate out and mark the solvent front immediately.
 Do not run the solvent over edge of plate
 Let solvent evaporate completely.
PREPARATION AND ACTIVATION OF PLATES
 The T L C plates can be prepared by following techniques :The T L C plates can be prepared by following techniques :
1)1)PouringPouring
2)2)DippingDipping
3)3)SprayingSpraying
4)4)SpreadingSpreading
 Activation :It is nothing but removing of water/ moisture & otherActivation :It is nothing but removing of water/ moisture & other
adsorbed substance from the surface of any adsorbent by heating.adsorbed substance from the surface of any adsorbent by heating.
METHOD FOR APPLICATION OF ADSORBENT ON THE PLATE
1.POURING- adsorbent of homogeneous particle size
made in slurry and pour on plate.
2.DIPPING- it used for small plate by dipping two
plate back to back in slurry of adsorbent in
chloroform or other volatile solvent.
3.SPRAYING- simply by spraying slurry on plate
4.SPREADING- slurry spread by using spatula or glass
rod
ACTIVATION OF PLATE
 TLC plates made by mixing adsorbent – silica gel + inert
binder calcium sulphate (gypsum) + water
 Mixer spread as thick slurry on un-reactive carrier sheet –
glass, thick aluminum foil, plastic etc
 Resultant plate dried and activated by heating in oven for
30 minutes at 110° C
 Thickness of adsorbent layer:
A. 0.1 – 0.25 mm for analytical purpose
B. 1- 2 mm for preparative TLC
APPLICATION OF SAMPLE
DEVELOPMENT CHAMBER / TANK
 TLC plates are placed vertically in rectangular
chromatography tank or chamber .
 Glass and stainless steel are suitable
chambers.
 If tank is not saturated, solvent will evaporate
and affect the Rf value.
 Development should be carried out at room
temperature by covering chamber with glass
The development tankThe development tank
should be lined Insideshould be lined Inside
with filter paper moistenedwith filter paper moistened
with mobile phase towith mobile phase to
saturate the atmospheresaturate the atmosphere
& also prevent the& also prevent the
““ EDGE EFFECT ” .EDGE EFFECT ” .
Different development techniques are :Different development techniques are :
1)1)One dimensional development.One dimensional development.
2)2)Two dimensional development.Two dimensional development.
3)3)Horizontal development.Horizontal development.
4)4)Multiple development.Multiple development.
DEVELOPMENTDEVELOPMENT
TECHNIQUETECHNIQUE
DEVELOPMENT OF CHROMATOGRAMS
 Ascending development-
plate after spotting placed in chamber
flow of solvent from bottom to top.
 Descending development-
in this flow of solvent from reservoir to plate by means
of filter paper strip.
solvent move from top to bottom.
 Place spotted plate in developing chamber
 Developing solution is drawn up the plate by capillary action
 Compounds in the original spots are pulled by silica gel.
DEVELOPMENT OF T L CDEVELOPMENT OF T L C
VISUALIZATION METHOD
 Previous slide shows colored spots. Most of the time
spots wont show unless visualized.
 Visualization is a method used to render TLC spots visible
 A visualization method can be:
 UV light
 iodine vapors to stain spots
 colored reagents to stain spots
 reagents that selectively stain spots leaving others
unaffected
Detecting agents are two types:Detecting agents are two types:
(A)(A)Non-Specific methodNon-Specific method
1) Iodine chamber method.1) Iodine chamber method.
2) Sulphuric acid spray method.2) Sulphuric acid spray method.
3) UV chamber for fluorescent compounds.3) UV chamber for fluorescent compounds.
4) Using fluorescent stationary phase.4) Using fluorescent stationary phase.
(B) Specific method(B) Specific method
1) Ferric chloride – for Phenolic compounds and Tannins.1) Ferric chloride – for Phenolic compounds and Tannins.
2) Ninhydrine in acetone – For Amino acids.2) Ninhydrine in acetone – For Amino acids.
3) Dregendroff reagent – For Alkaloids.3) Dregendroff reagent – For Alkaloids.
4) 3,5 – Dinitro benzoic acid – For Cardiac glycosides.4) 3,5 – Dinitro benzoic acid – For Cardiac glycosides.
5) 2,4 - Dinitro phenyl hydrazines – For Aldehyd and Ketones.5) 2,4 - Dinitro phenyl hydrazines – For Aldehyd and Ketones.
DETECTING AGENTSDETECTING AGENTS
VARIOUS TECHNIQUES TO VISUALIZE THE COMPOUNDS:
1.Sulfuric acid/ heat: destructive, leaves charred blots
behind
2. ceric stain: destructive, leaves a dark blue blot behind
polar compounds
3.Iodine: semi- destructive , iodine absorbs onto the
spots , not permanent
4. UV light: non – destructive, long wavelength,
(background plate green, spots dark) short wavelength
(background plate dark, spots glow)
The RThe Rff value is calculated forvalue is calculated for
identification "Rfidentification "Rf value is thevalue is the
ratio of distance travelled byratio of distance travelled by
The solute to the distanceThe solute to the distance
travelled by the solvent front”travelled by the solvent front”
Distance travelled by soluteDistance travelled by solute
RRff ==
Distance travelled by solvent frontDistance travelled by solvent front
DETECTIONDETECTION
 Rf value is constant for each component only under
identical experimental condition.
Polar compounds have low Rf value
 It depend on following factors-
 Nature of adsorbent
 Mobile phase
 Activity
 Thickness of layer
 The temperature
 Equilibration
 Loading
 Dipping zone
 Chromatographic technique
PERFORMING THE TLC ANALYSIS: CALCULATE THE RF
VALUES
 The Rf value is calculated by measuring the distance the
sample zone travels divided by the distance the developing
solvent travels
 Values below 0.1 is considered poor: the spots are too
close to origin
 Values of 0.1 to 0.8 are good and any other spots
(impurities) or other actives are resolved form each
other
 Above 0.8: poor: spots may be too broad or distorted
1)1) Separation of mixture of drug ofSeparation of mixture of drug of
chemical,biological,plant origin.chemical,biological,plant origin.
2)2) Separation of Carbohydrates, vitamin, antibiotics,Separation of Carbohydrates, vitamin, antibiotics,
proteins, etc.proteins, etc.
3)3) Identification of drug. Ex :Amoxicillin, LevodopaIdentification of drug. Ex :Amoxicillin, Levodopa
4)4) Detection of foreign substances.Detection of foreign substances.
5)5) To detect the decomposition products of drug.To detect the decomposition products of drug.
APPLICATIONS / USESAPPLICATIONS / USES
6). To determine how many compounds are there in
a mixture – is it real pure?
7). To determine the best solvent conditions for
separation on column
8). To identify the substances being studied
9). To monitor the compositions & appropriate
conditions of the fractions collected from Column
Chromatography
10). To monitor the progress of the reaction
11). To determine identity of two substances
12). To determine effectiveness of purification
TLC TROUBLESHOOTING
1. CAUSE: the compound runs as streak rather than a spot
REASON:  the sample was overloaded
 Run the TLC again after diluting your sample
 Sample might contain many components
 It creates many spots which run together & appear as
streak
2. CAUSE: the sample runs as a smear or a upward crescent (moon)
REASON: compounds which possess strongly acidic or basic
groups (amines or carboxylic acids) show this behavior
 Add few drops of ammonium hydroxide(amines) or
acetic acid (carboxylic acids) to the eluting solvent to obtain
clear plates.
3. CAUSE: the sample runs as a downward crescent (moon)
REASON: adsorbent was disturbed during spotting
caused
4. CAUSE: plate solvent front runs crookedly (curved)
REASON:  adsorbent flaked of the sides of plate
 Adsorbent moved towards the side of the plate
or touching the sides of the container or the
paper used to saturate the container as plate
develops.
 Crookedly run plates makes it harder to measure
the Rf value accurately.
5. CAUSE: many random spots are seen on the plate
REASON:  accidently check not any organic compound
on the plate or any new foreign substance touched
6. CAUSE: no spots seen on plate
REASON: you might have not spotted enough compound,
perhaps because the solution of the compound is too
dilute.
 Try concentrating the solution or else spot it several
times in one place allowing solvents to dry b/w capillaries
 Some compounds do not show under UV light
 Try another method of visualization of plate
 Perhaps you don’t have any compounds because the
experiment did not go as well planned
 If solvent level in developing jar is deeper than the origin
of the TLC plate
 Solvent will dissolve the compounds into the solvent
reservoir
 It allows them to move up the plate by capillary actions.
 Thus you will not see the spots after the plate is developed.
THANK YOUTHANK YOU

Thin layer chromatogaphy bpharm sud

  • 1.
    THIN LAYER CHROMATOGRAPHY PresentedBy Mr. K.Sudheerkumar M Pharmacy., (PhD) Faculty, Sri Shivani College of Pharmacy Mulugu road,Warangal, Telangana State India, E. mail : ksum2810@gmail.com
  • 3.
     TLC iswidely used to separate chemical compounds  It involves S.P – Consists of thin layer adsorbent material  S.P usually consists of – silica gel , alumina, cellulose immobilized onto a flat inert carrier sheet.  M.P consists of the solution to be separated dissolved in appropriate solvent.  It is drawn through the plate via capillary action  Used to determine and detect pigments in plant, pesticides or insecticides in food, in forensic dept. to analyze dye composition of fiber & identification of various compounds.
  • 4.
     TLC isuniversal analytical technique in chemical analysisTLC is universal analytical technique in chemical analysis for separation of organic and inorganic matter.for separation of organic and inorganic matter.  InIn 19381938, Izmailov and Shraiber describe basic principle, Izmailov and Shraiber describe basic principle used it for separation of plant extract.used it for separation of plant extract.  InIn 19441944, Consden, Gorden & Martin used filter papers for, Consden, Gorden & Martin used filter papers for separating the Amino acids.separating the Amino acids.  InIn 19501950, Kirchner identified terpenes on filter paper., Kirchner identified terpenes on filter paper.  InIn 19581958, Stahl mainly created with bringing out the work, Stahl mainly created with bringing out the work on preparing plates and separation of wide variety ofon preparing plates and separation of wide variety of compounds.compounds.
  • 5.
     TLC –common used technique in synthetic chemistry for identifying compounds  Determining their purity  Analyzing the progress of the reaction and also mechanism involved.  S.P may be solid or liquid & hold as a layer on solid support.  It permits optimization of the solvent system for given separation problem.  Compared b/w C.C & TLC – this requires less quantity of compounds & also much faster in progress.
  • 6.
    PRINCIPLEPRINCIPLE  The basicPrinciple is based on ADSORPTIONThe basic Principle is based on ADSORPTION ChromatographyChromatography  The component with more affinity towards the S.P-The component with more affinity towards the S.P- travel slowertravel slower  The component with lesser affinity towards the S.P -The component with lesser affinity towards the S.P - travel fastertravel faster  TLC is simple and rapid method - carried out by using thinTLC is simple and rapid method - carried out by using thin layer of adsorbent on plates.layer of adsorbent on plates.
  • 7.
     TLC isincluded under both adsorption and partition chromatographs.  Separation of component may result due to adsorption or partition  both phenomenon depend upon nature of adsorbent used on plate and solvent system used for the development.  S.P – TLC plate, TLC paper is coated with silica gel  In TLC separation – hydrogen bonding is main intermolecular forces involved
  • 8.
     Polar moleculesstick to plate  Non- polar molecules do not stick to plate  Non-polar molecules will spend a great amount of time dissolved in eluent  Separation of compounds occur due to differences in partitioning b/w liquid and S.P  More sensitive & less sample required  Spraying with corrosive agents for identification possible
  • 9.
     TLC canbe automated using forced solvent flow  Running the plate in vacuum  Capable chamber to dry the plate  Recording the finished chromatograph – absorption / fluorescence spectroscopy with light source  Ability to program the solvent delivery makes it convenient to do multiple developments in which the solvent flows for a short period of time and TLC dried and process repeated. This method refocuses the spots to achieve higher resolution than in single run.
  • 10.
    ADVANTAGES  Low cost Short analysis time  All spots can be visualized  Adaptable to most pharmaceuticals  Uses small quantities of solvents  Requires minimal training  Reliable and quick  Minimal amount of equipment is needed Densitometers can be used to increase accuracy of spot concentration
  • 11.
    TLC SUPERIOR OVEROTHER METHODS  It requires little equipment  Require little time for separation  It is more sensitive  Very small quantity of sample require for analysis The method use for adsorption, partition, ion exchange chromatography  Component which are separated can be recovered easily .  Quantative separation of spot and zone are possible  For identification is permitted  Spraying of corrosive agent
  • 12.
    OPERATIONAL TECHNIQUE INVOLVED Choice of adsorbent  Preparation of plate  Preparation and application of sample  Choice of solvent  Development of chromatogram  Drying of chromatogram  Location of spot  Quantitative estimation
  • 13.
    CHOICE OF ADSORBENT Two properties decide the selection: 1.particle size 2. homogeniscity  Factors affecting selection: 1. Colorless 2. should have great mechanical strength 3. should not catalyze or decompose of substance 4. should be insoluble with mobile phase & the solvent used for elution 5. no reaction at time of separation
  • 14.
    6. Adsorbent donot adhere to glass plate 7. Adsorbent particle size 8. To see whether compound is liable to react chemically with adsorbent. 9. Nature of substance to be separated 10.Characteristic of compound to be separated 11. Solubility of compound
  • 15.
    CLASSIFICATION OF ADSORBENTSUSED 1.Classification according to binding strength: A.Weak adsorbent: sucrose, starch, talc, cellulose B. Intermediate adsorbent: silica gel, calcium carbonate, calcium phosphate, magnesia C.Strong adsorbent: alumina, charcoal 2. Classification according to nature: A. Inorganic adsorbent: Silica, Silica gel, Alumina, Calcium phosphate, Glass powder, Kieselguhr ,Magnesium silicate, Calcium silicate, Phosphate , Ferric & Chromic oxides, Zinc carbonate & zinc ferro cyanides, Bentonites B. Organic adsorbent: Normal cellulose powder, Charcoal & activated carbon, Starch, Sucrose, Manitol, Dextran gel
  • 16.
     SILICA GELis granular porous form of silica  Made synthetically from sodium silicate  Silica gel is solid and used in chromatography as S.P  Due to silica gel polarity – non polar components tend to elute before polar ones hence named as NPC  Hydrophobic groups (C18) attached to silica gel then polar components elute first hence names as RPC.  Synthetic nature of silica gel enables careful control of pore size.
  • 17.
    CELLULOSE  Cellulose (C6H10O5)nis a long chain polymeric polysaccharide carbohydrate of β – glucose  Adsorbed water or alcohol can be retained by interaction with hydroxyl groups  Two types of cellulose are used in planar chromatography: 1.Polymerization b/w 400-500 glucopyranose units 2. 40 – 200 glucopyranose units
  • 18.
    ALUMINIUM OXIDE  Itis a chemical compound of aluminum and oxygen with chemical formula – Al2O3  Commonly referred to as alumina  Manufactured in 3 pH ranges – acidic, basic and neutral  Acidic compounds – phenols, sulphonic, carboxylic & Amino acids are separated on acidic alumina  Basic compounds – amines , dyes separated
  • 19.
    Reverse Phase ChromatographyReversePhase Chromatography  In this the S.P is Non-polar & M.P is polar & it is widelyIn this the S.P is Non-polar & M.P is polar & it is widely used in pharmaceutical analysis.used in pharmaceutical analysis. 1. Polar compounds get eluted first1. Polar compounds get eluted first 2. Non-polar compounds are retained for long time2. Non-polar compounds are retained for long time Comparison of Normal Phase & Reverse Phase :Comparison of Normal Phase & Reverse Phase : PARAMETER NORMAL PHASENORMAL PHASE REVERSE PHASEREVERSE PHASE Stationary phaseStationary phase PolarPolar Non-polarNon-polar Mobile phaseMobile phase Non-polarNon-polar PolarPolar Compound elutedCompound eluted firstfirst Non-polarNon-polar PolarPolar Compound elutedCompound eluted lastlast PolarPolar Non-polarNon-polar Example of stationaryExample of stationary phasephase Silica gelSilica gel CC44 ,c,c88 –bonded phase–bonded phase
  • 20.
    STATIONARY PHASE NAMENAME COMPOSITIONCOMPOSITION Silicagel HSilica gel H Silica gel without binderSilica gel without binder Silica gel GSilica gel G Silica gel + CaSOSilica gel + CaSO44 Silica gel GFSilica gel GF Silica gel + Binder + fluorescentSilica gel + Binder + fluorescent indicatorindicator AluminaAlumina AlAl220033 Without BinderWithout Binder AlAl220033 GG AlAl220033 + Binder+ Binder Cellulose powderCellulose powder Cellulose Without BinderCellulose Without Binder Cellulose powderCellulose powder Cellulose With BinderCellulose With Binder Kieselguhr GKieselguhr G Diatomaceous earth + binderDiatomaceous earth + binder Polyamide powderPolyamide powder PolyamidePolyamide Fuller’s earthFuller’s earth Hydrous magnesium aluminaHydrous magnesium alumina Magnesium SilicateMagnesium Silicate magnesolmagnesol
  • 21.
    MOBILE PHASE 1)1)Nature ofthe substance to be separated i.e whether it isNature of the substance to be separated i.e whether it is polar or non-polar.polar or non-polar. 2)2)Mode of ChromatographyMode of Chromatography 3)3)Nature of Stationary phaseNature of Stationary phase 4)4)Mode Separation i.e Analytical or Preparative techniqueMode Separation i.e Analytical or Preparative technique  Examples: 1) Petroleum ether 2) CyclohexaneExamples: 1) Petroleum ether 2) Cyclohexane 3) Acetone 4) Toluene3) Acetone 4) Toluene 5) Ethyl acetate 6) Benzene5) Ethyl acetate 6) Benzene 7) Alcohols 8) Water7) Alcohols 8) Water 9) Chloroform 10) Pyridine9) Chloroform 10) Pyridine
  • 22.
    CHOICE OF SOLVENT Selectionof M.P depends upon nature of substance to be separated Viscosity and polarity of S.P Solvent used may be single or double phase system e.g: n-hexane < cyclohexane< CCl4 < benzene < toluene < CHCl3 < diethyl ether < ethyl acetate < acetone < ethanol < Methanol < water
  • 23.
    GLASS PLATES  Threetypes :Three types : 1)1)Full plate : 20cm × 20 cm.Full plate : 20cm × 20 cm. 2)2)Half plate : 20cm × 10 cm.Half plate : 20cm × 10 cm. 3)3)Quarter plate : 20cm × 5 cm.Quarter plate : 20cm × 5 cm.  Microscopic slides can also be used forMicroscopic slides can also be used for monitoring the progress of a chemical reaction.monitoring the progress of a chemical reaction.
  • 24.
    DEVELOPING A PLATE TLC plate can be developed in beaker or closed jar. Draw the base line on TLC plate which is 1cm above from lower edge of plate and apply the spots on base line.  Place a small amount of solvent in container.  Solvent level below the starting line(Base line)of TLC because it its above the base line spots dissolve.  Low edge of plate dipped in solvent.  Solvent travels up the matrix or adsorbent(S.P) by capillarity action.  Moving components of samples at various rates because of their different degrees of interaction with matrix & solubility in the developing solvent (M.P).  Take the plate out and mark the solvent front immediately.  Do not run the solvent over edge of plate  Let solvent evaporate completely.
  • 25.
    PREPARATION AND ACTIVATIONOF PLATES  The T L C plates can be prepared by following techniques :The T L C plates can be prepared by following techniques : 1)1)PouringPouring 2)2)DippingDipping 3)3)SprayingSpraying 4)4)SpreadingSpreading  Activation :It is nothing but removing of water/ moisture & otherActivation :It is nothing but removing of water/ moisture & other adsorbed substance from the surface of any adsorbent by heating.adsorbed substance from the surface of any adsorbent by heating.
  • 26.
    METHOD FOR APPLICATIONOF ADSORBENT ON THE PLATE 1.POURING- adsorbent of homogeneous particle size made in slurry and pour on plate. 2.DIPPING- it used for small plate by dipping two plate back to back in slurry of adsorbent in chloroform or other volatile solvent. 3.SPRAYING- simply by spraying slurry on plate 4.SPREADING- slurry spread by using spatula or glass rod
  • 27.
    ACTIVATION OF PLATE TLC plates made by mixing adsorbent – silica gel + inert binder calcium sulphate (gypsum) + water  Mixer spread as thick slurry on un-reactive carrier sheet – glass, thick aluminum foil, plastic etc  Resultant plate dried and activated by heating in oven for 30 minutes at 110° C  Thickness of adsorbent layer: A. 0.1 – 0.25 mm for analytical purpose B. 1- 2 mm for preparative TLC
  • 28.
  • 29.
  • 30.
     TLC platesare placed vertically in rectangular chromatography tank or chamber .  Glass and stainless steel are suitable chambers.  If tank is not saturated, solvent will evaporate and affect the Rf value.  Development should be carried out at room temperature by covering chamber with glass
  • 31.
    The development tankThedevelopment tank should be lined Insideshould be lined Inside with filter paper moistenedwith filter paper moistened with mobile phase towith mobile phase to saturate the atmospheresaturate the atmosphere & also prevent the& also prevent the ““ EDGE EFFECT ” .EDGE EFFECT ” .
  • 32.
    Different development techniquesare :Different development techniques are : 1)1)One dimensional development.One dimensional development. 2)2)Two dimensional development.Two dimensional development. 3)3)Horizontal development.Horizontal development. 4)4)Multiple development.Multiple development. DEVELOPMENTDEVELOPMENT TECHNIQUETECHNIQUE
  • 33.
    DEVELOPMENT OF CHROMATOGRAMS Ascending development- plate after spotting placed in chamber flow of solvent from bottom to top.  Descending development- in this flow of solvent from reservoir to plate by means of filter paper strip. solvent move from top to bottom.  Place spotted plate in developing chamber  Developing solution is drawn up the plate by capillary action  Compounds in the original spots are pulled by silica gel.
  • 34.
    DEVELOPMENT OF TL CDEVELOPMENT OF T L C
  • 35.
    VISUALIZATION METHOD  Previousslide shows colored spots. Most of the time spots wont show unless visualized.  Visualization is a method used to render TLC spots visible  A visualization method can be:  UV light  iodine vapors to stain spots  colored reagents to stain spots  reagents that selectively stain spots leaving others unaffected
  • 36.
    Detecting agents aretwo types:Detecting agents are two types: (A)(A)Non-Specific methodNon-Specific method 1) Iodine chamber method.1) Iodine chamber method. 2) Sulphuric acid spray method.2) Sulphuric acid spray method. 3) UV chamber for fluorescent compounds.3) UV chamber for fluorescent compounds. 4) Using fluorescent stationary phase.4) Using fluorescent stationary phase. (B) Specific method(B) Specific method 1) Ferric chloride – for Phenolic compounds and Tannins.1) Ferric chloride – for Phenolic compounds and Tannins. 2) Ninhydrine in acetone – For Amino acids.2) Ninhydrine in acetone – For Amino acids. 3) Dregendroff reagent – For Alkaloids.3) Dregendroff reagent – For Alkaloids. 4) 3,5 – Dinitro benzoic acid – For Cardiac glycosides.4) 3,5 – Dinitro benzoic acid – For Cardiac glycosides. 5) 2,4 - Dinitro phenyl hydrazines – For Aldehyd and Ketones.5) 2,4 - Dinitro phenyl hydrazines – For Aldehyd and Ketones. DETECTING AGENTSDETECTING AGENTS
  • 37.
    VARIOUS TECHNIQUES TOVISUALIZE THE COMPOUNDS: 1.Sulfuric acid/ heat: destructive, leaves charred blots behind 2. ceric stain: destructive, leaves a dark blue blot behind polar compounds 3.Iodine: semi- destructive , iodine absorbs onto the spots , not permanent 4. UV light: non – destructive, long wavelength, (background plate green, spots dark) short wavelength (background plate dark, spots glow)
  • 38.
    The RThe Rffvalue is calculated forvalue is calculated for identification "Rfidentification "Rf value is thevalue is the ratio of distance travelled byratio of distance travelled by The solute to the distanceThe solute to the distance travelled by the solvent front”travelled by the solvent front” Distance travelled by soluteDistance travelled by solute RRff == Distance travelled by solvent frontDistance travelled by solvent front DETECTIONDETECTION
  • 39.
     Rf valueis constant for each component only under identical experimental condition. Polar compounds have low Rf value  It depend on following factors-  Nature of adsorbent  Mobile phase  Activity  Thickness of layer  The temperature  Equilibration  Loading  Dipping zone  Chromatographic technique
  • 40.
    PERFORMING THE TLCANALYSIS: CALCULATE THE RF VALUES  The Rf value is calculated by measuring the distance the sample zone travels divided by the distance the developing solvent travels  Values below 0.1 is considered poor: the spots are too close to origin  Values of 0.1 to 0.8 are good and any other spots (impurities) or other actives are resolved form each other  Above 0.8: poor: spots may be too broad or distorted
  • 41.
    1)1) Separation ofmixture of drug ofSeparation of mixture of drug of chemical,biological,plant origin.chemical,biological,plant origin. 2)2) Separation of Carbohydrates, vitamin, antibiotics,Separation of Carbohydrates, vitamin, antibiotics, proteins, etc.proteins, etc. 3)3) Identification of drug. Ex :Amoxicillin, LevodopaIdentification of drug. Ex :Amoxicillin, Levodopa 4)4) Detection of foreign substances.Detection of foreign substances. 5)5) To detect the decomposition products of drug.To detect the decomposition products of drug. APPLICATIONS / USESAPPLICATIONS / USES
  • 42.
    6). To determinehow many compounds are there in a mixture – is it real pure? 7). To determine the best solvent conditions for separation on column 8). To identify the substances being studied 9). To monitor the compositions & appropriate conditions of the fractions collected from Column Chromatography 10). To monitor the progress of the reaction 11). To determine identity of two substances 12). To determine effectiveness of purification
  • 43.
    TLC TROUBLESHOOTING 1. CAUSE:the compound runs as streak rather than a spot REASON:  the sample was overloaded  Run the TLC again after diluting your sample  Sample might contain many components  It creates many spots which run together & appear as streak 2. CAUSE: the sample runs as a smear or a upward crescent (moon) REASON: compounds which possess strongly acidic or basic groups (amines or carboxylic acids) show this behavior  Add few drops of ammonium hydroxide(amines) or acetic acid (carboxylic acids) to the eluting solvent to obtain clear plates.
  • 44.
    3. CAUSE: thesample runs as a downward crescent (moon) REASON: adsorbent was disturbed during spotting caused 4. CAUSE: plate solvent front runs crookedly (curved) REASON:  adsorbent flaked of the sides of plate  Adsorbent moved towards the side of the plate or touching the sides of the container or the paper used to saturate the container as plate develops.  Crookedly run plates makes it harder to measure the Rf value accurately. 5. CAUSE: many random spots are seen on the plate REASON:  accidently check not any organic compound on the plate or any new foreign substance touched
  • 45.
    6. CAUSE: nospots seen on plate REASON: you might have not spotted enough compound, perhaps because the solution of the compound is too dilute.  Try concentrating the solution or else spot it several times in one place allowing solvents to dry b/w capillaries  Some compounds do not show under UV light  Try another method of visualization of plate  Perhaps you don’t have any compounds because the experiment did not go as well planned  If solvent level in developing jar is deeper than the origin of the TLC plate  Solvent will dissolve the compounds into the solvent reservoir  It allows them to move up the plate by capillary actions.  Thus you will not see the spots after the plate is developed.
  • 46.