Downloaded 192 times
![Comparison of CT Calibration Methods PTR used as a QA tool Comparison of measured and CT-predicted integrated stopping power Sheep head used as model Stoichiometric calibration (A) better than tissue substitute calibrations (B & C) SP calc - Sp meas [%] No of PTR pixels [%]](https://image.slidesharecdn.com/the-use-of-highenergy-protons-1233610364226521-2/75/The-Use-Of-High-Energy-Protons-18-2048.jpg)
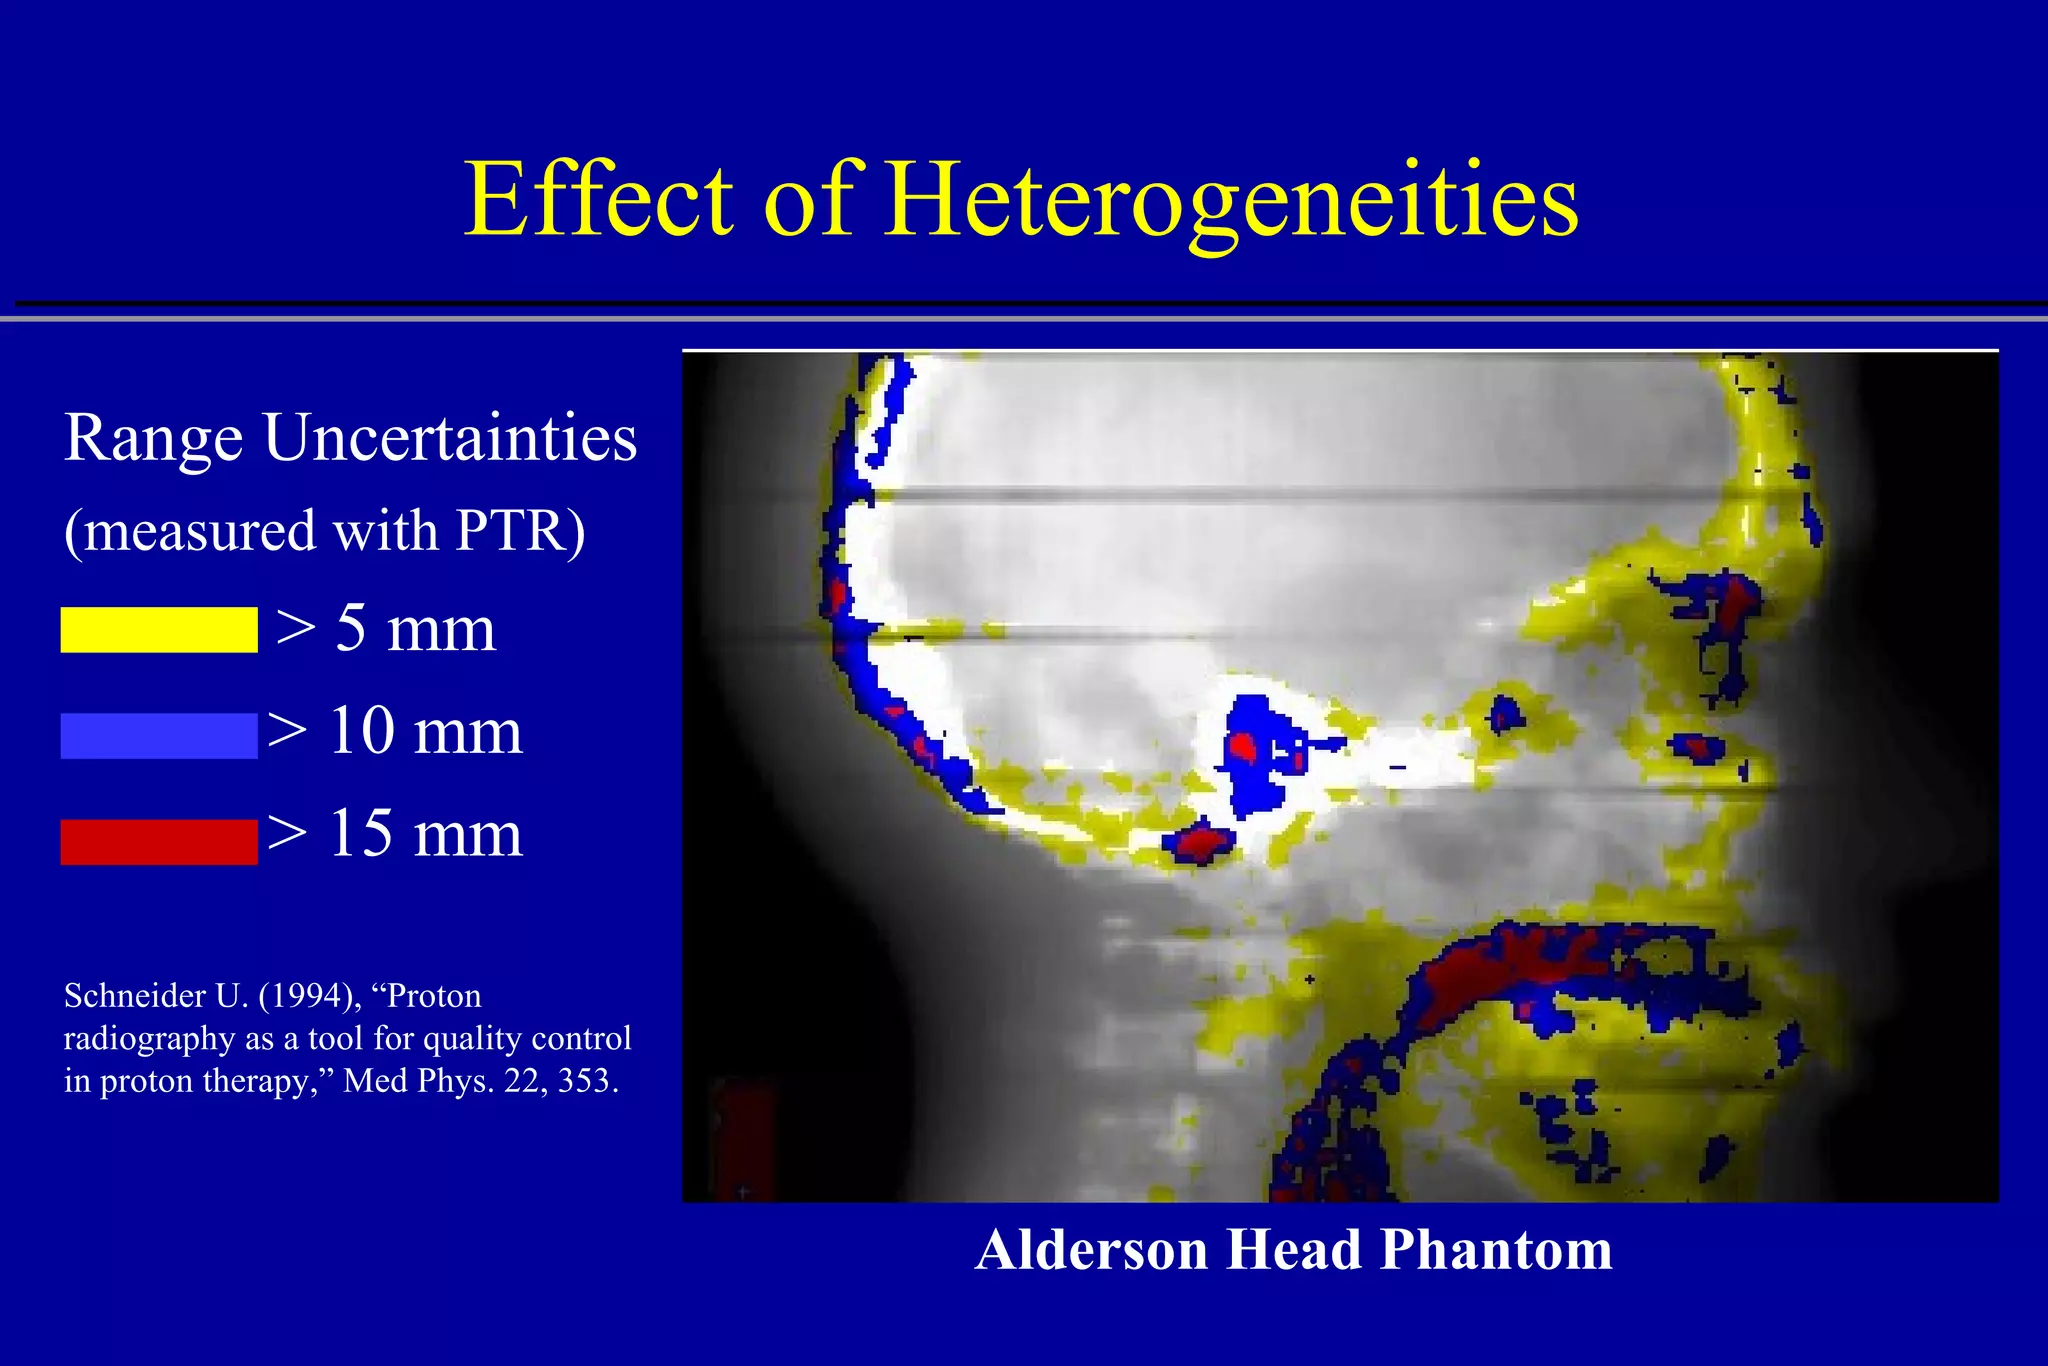
![Effect of Heterogeneities W = 10 mm W = 4 mm W = 2 mm W = 1 mm W = 1 mm No heterogeneity Bone Water Protons W Central axis Depth [cm] 15 5 10 Central axis dose](https://image.slidesharecdn.com/the-use-of-highenergy-protons-1233610364226521-2/75/The-Use-Of-High-Energy-Protons-24-2048.jpg)
![Lateral Penumbra Penumbra factors: Upstream devices scattering foils range shifter modulator wheel bolus Air gap Patient scatter Air gap 100 80 0 60 40 20 25 0 20 15 10 5 Distance [mm] % Dose B A A - no air gap B - 40 cm air gap 80%-20% 80%-20%](https://image.slidesharecdn.com/the-use-of-highenergy-protons-1233610364226521-2/75/The-Use-Of-High-Energy-Protons-31-2048.jpg)
![Lateral Penumbra Thickness of bolus , width of air gap lateral penumbra Dose algorithms can be inaccurate in predicting penumbra Russel K. P. et al (2000), “Implementation of pencil kernel and depth penetration algorithms for treatment planning of proton beams,” Phys Med Biol 45, 9. 10 8 0 6 4 2 16 0 12 8 4 no bolus Measurement 5 cm bolus 20-80% penumbra Air gap [cm] Pencil beam Ray tracing](https://image.slidesharecdn.com/the-use-of-highenergy-protons-1233610364226521-2/75/The-Use-Of-High-Energy-Protons-32-2048.jpg)

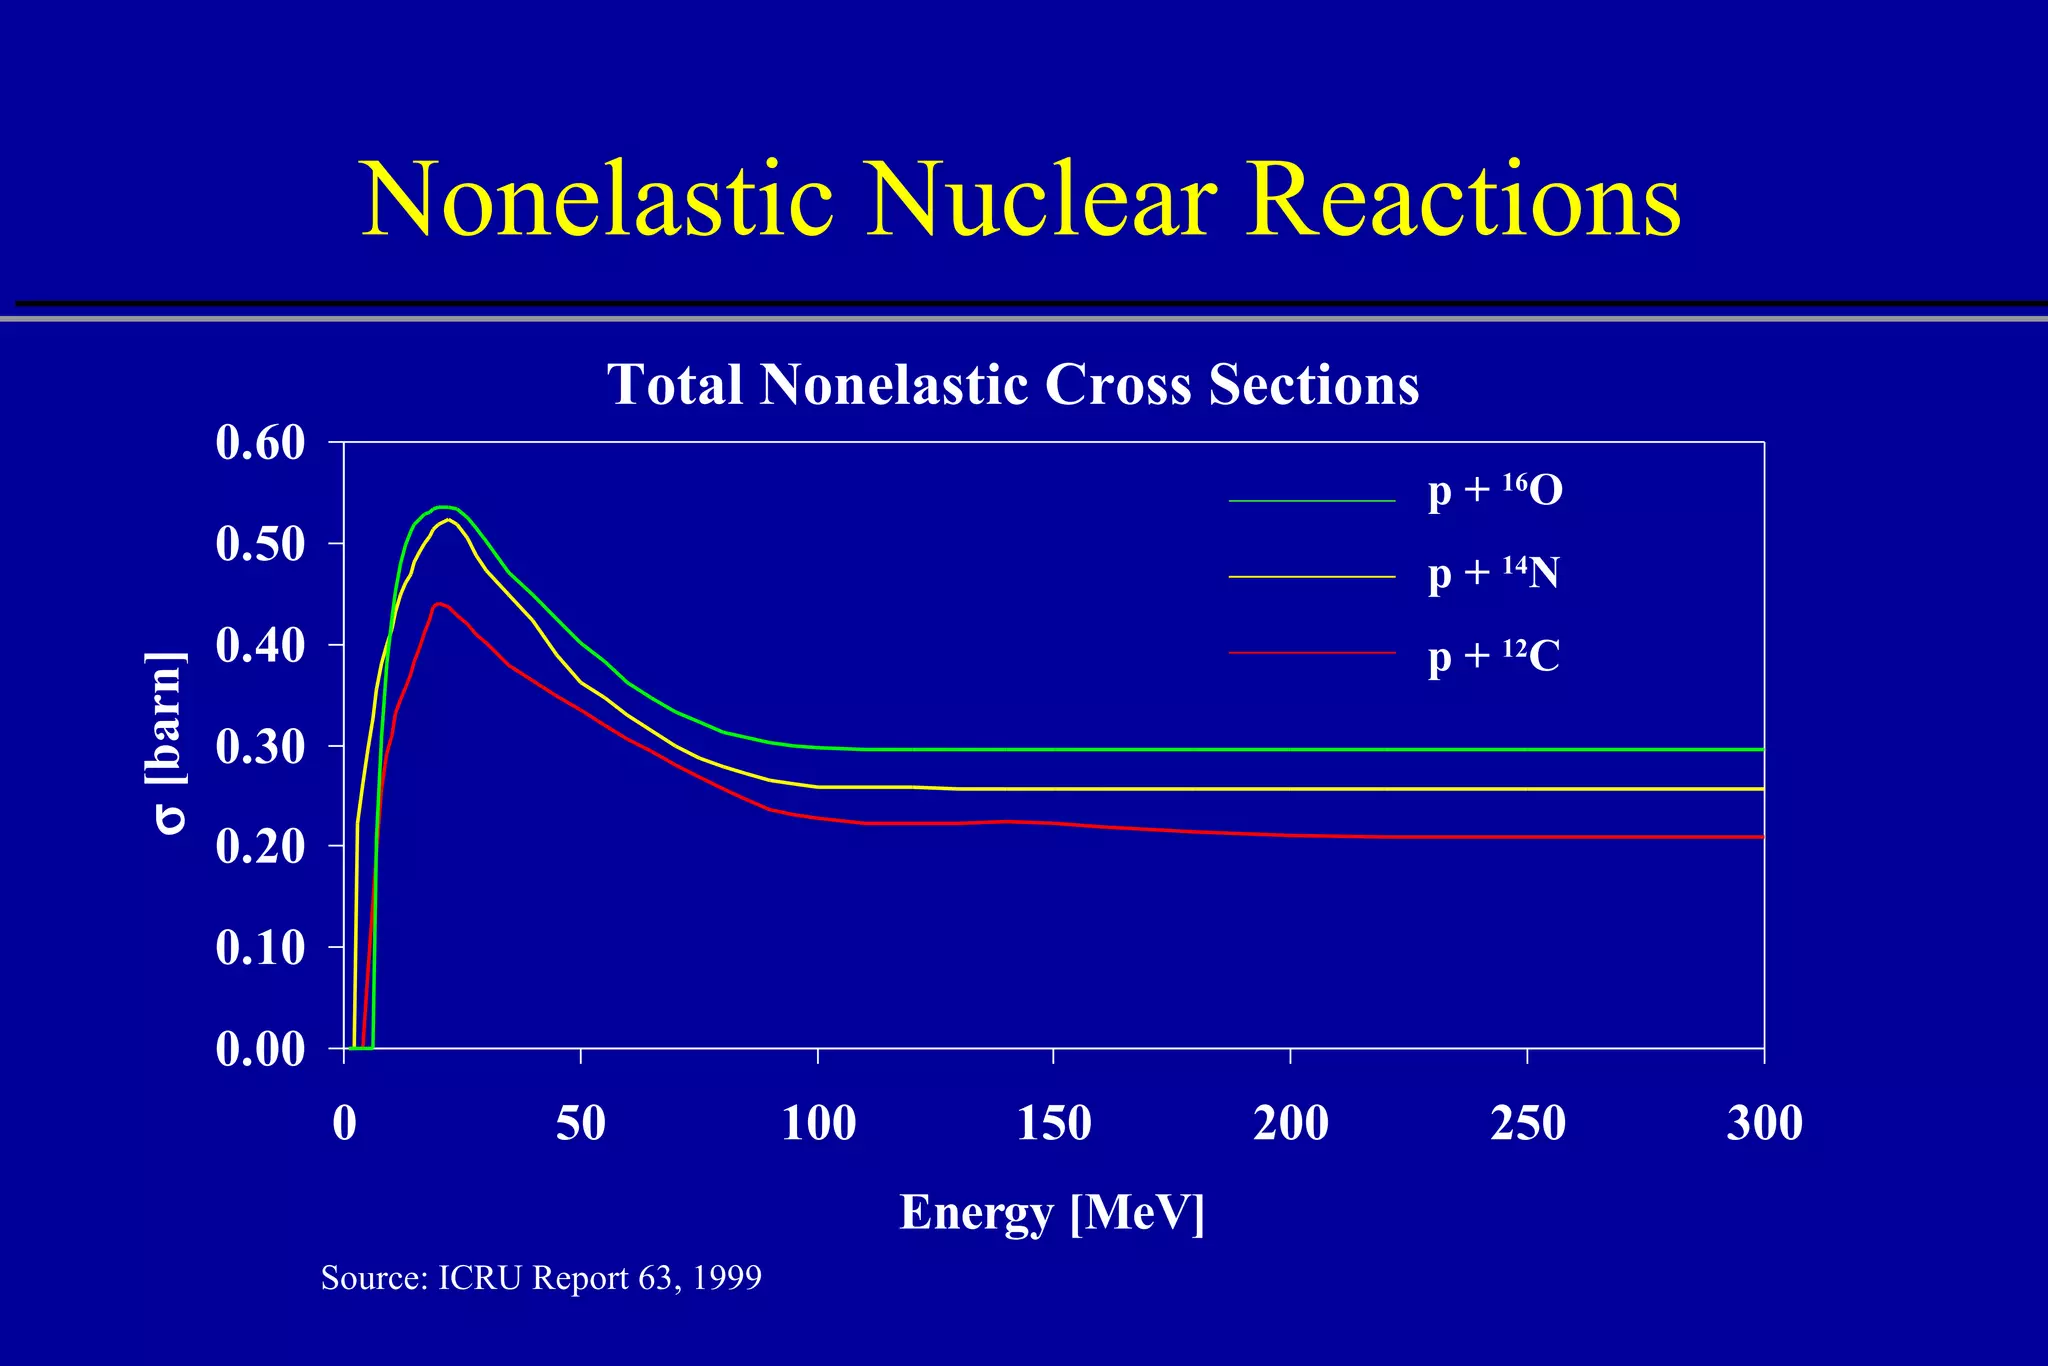
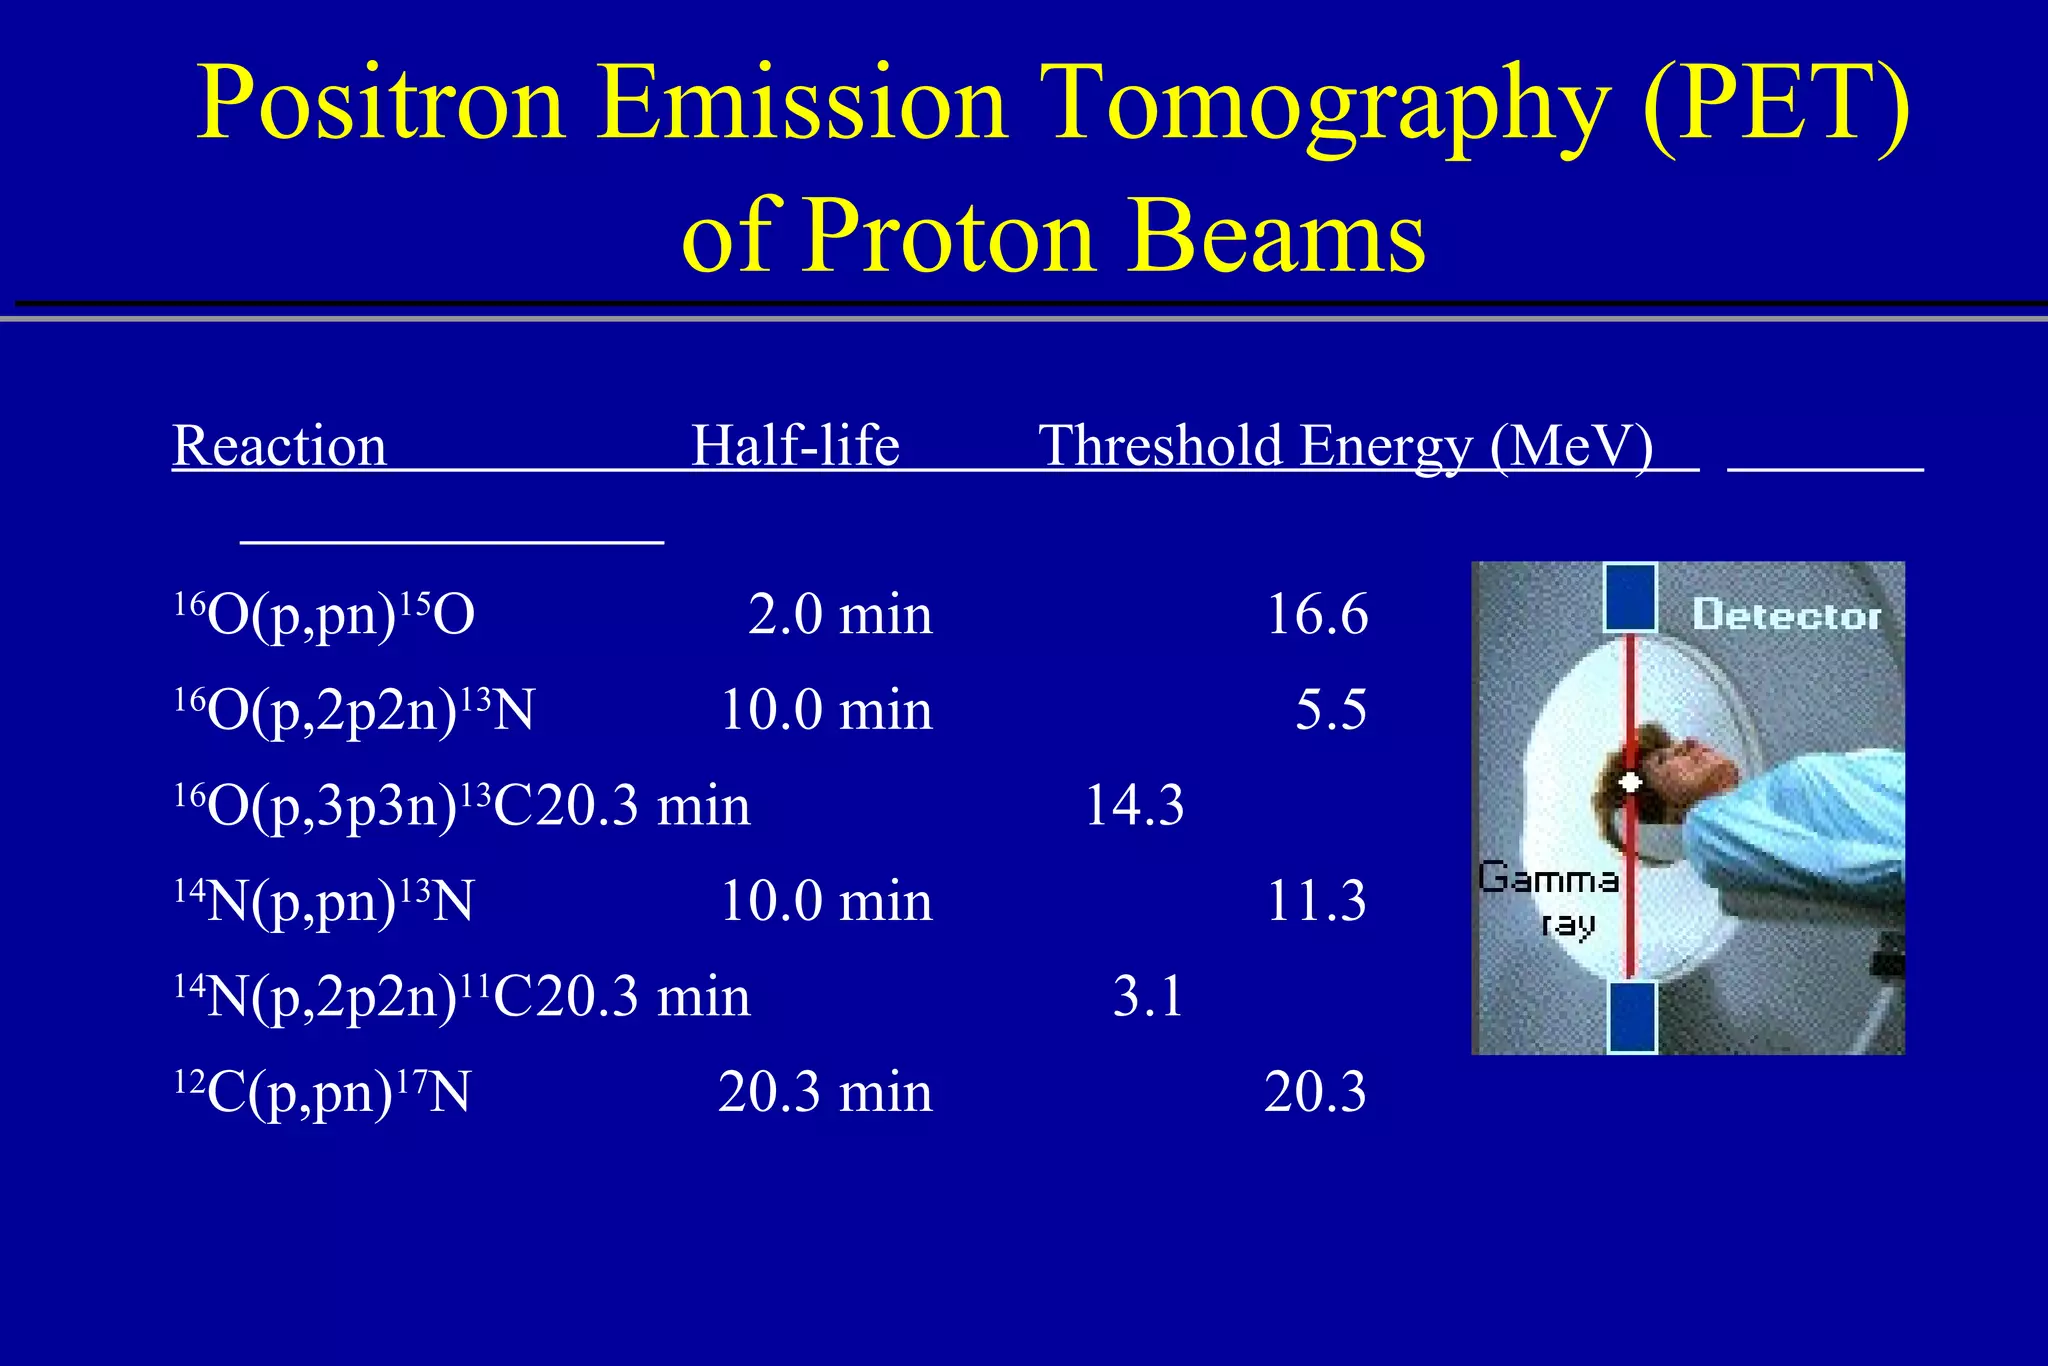
![Nonelastic Nuclear Reactions Remove primary protons Contribute to absorbed dose: 100 MeV, ~5% 150 MeV, ~10% 250 MeV, ~20% Generate secondary particles neutral (n, ) charged (p, d, t, 3 He, , recoils) 40 0 10 15 20 25 30 35 5 250 MeV Depth [cm] Energy Deposition (dE/dx) All interactions Electronic interactions Nuclear interactions](https://image.slidesharecdn.com/the-use-of-highenergy-protons-1233610364226521-2/75/The-Use-Of-High-Energy-Protons-37-2048.jpg)
![PET Dosimetry and Localization Experiment vs. simulation activity plateau (experiment) maximum activity (simulation) cross sections may be inaccurate activity fall-off 4-5 mm before Bragg peak Del Guerra A., et al. (1997) “PET Dosimetry in proton radiotherapy: a Monte Carlo Study,” Appl. Radiat. Isot. 10-12, 1617. 2 4 6 8 10 0 Depth [cm] Activity dE/dx PET experiment calculated activity calculated energy deposition 110 MeV p on Lucite, 24 min after irradiation](https://image.slidesharecdn.com/the-use-of-highenergy-protons-1233610364226521-2/75/The-Use-Of-High-Energy-Protons-41-2048.jpg)
![RBE vs. LET Source: S.M. Seltzer, NISTIIR 5221 10 0 10 2 10 3 10 4 10 1 0.0 2.0 3.0 4.0 5.0 6.0 LET [keV/ m] RBE 1.0 high low](https://image.slidesharecdn.com/the-use-of-highenergy-protons-1233610364226521-2/75/The-Use-Of-High-Energy-Protons-45-2048.jpg)
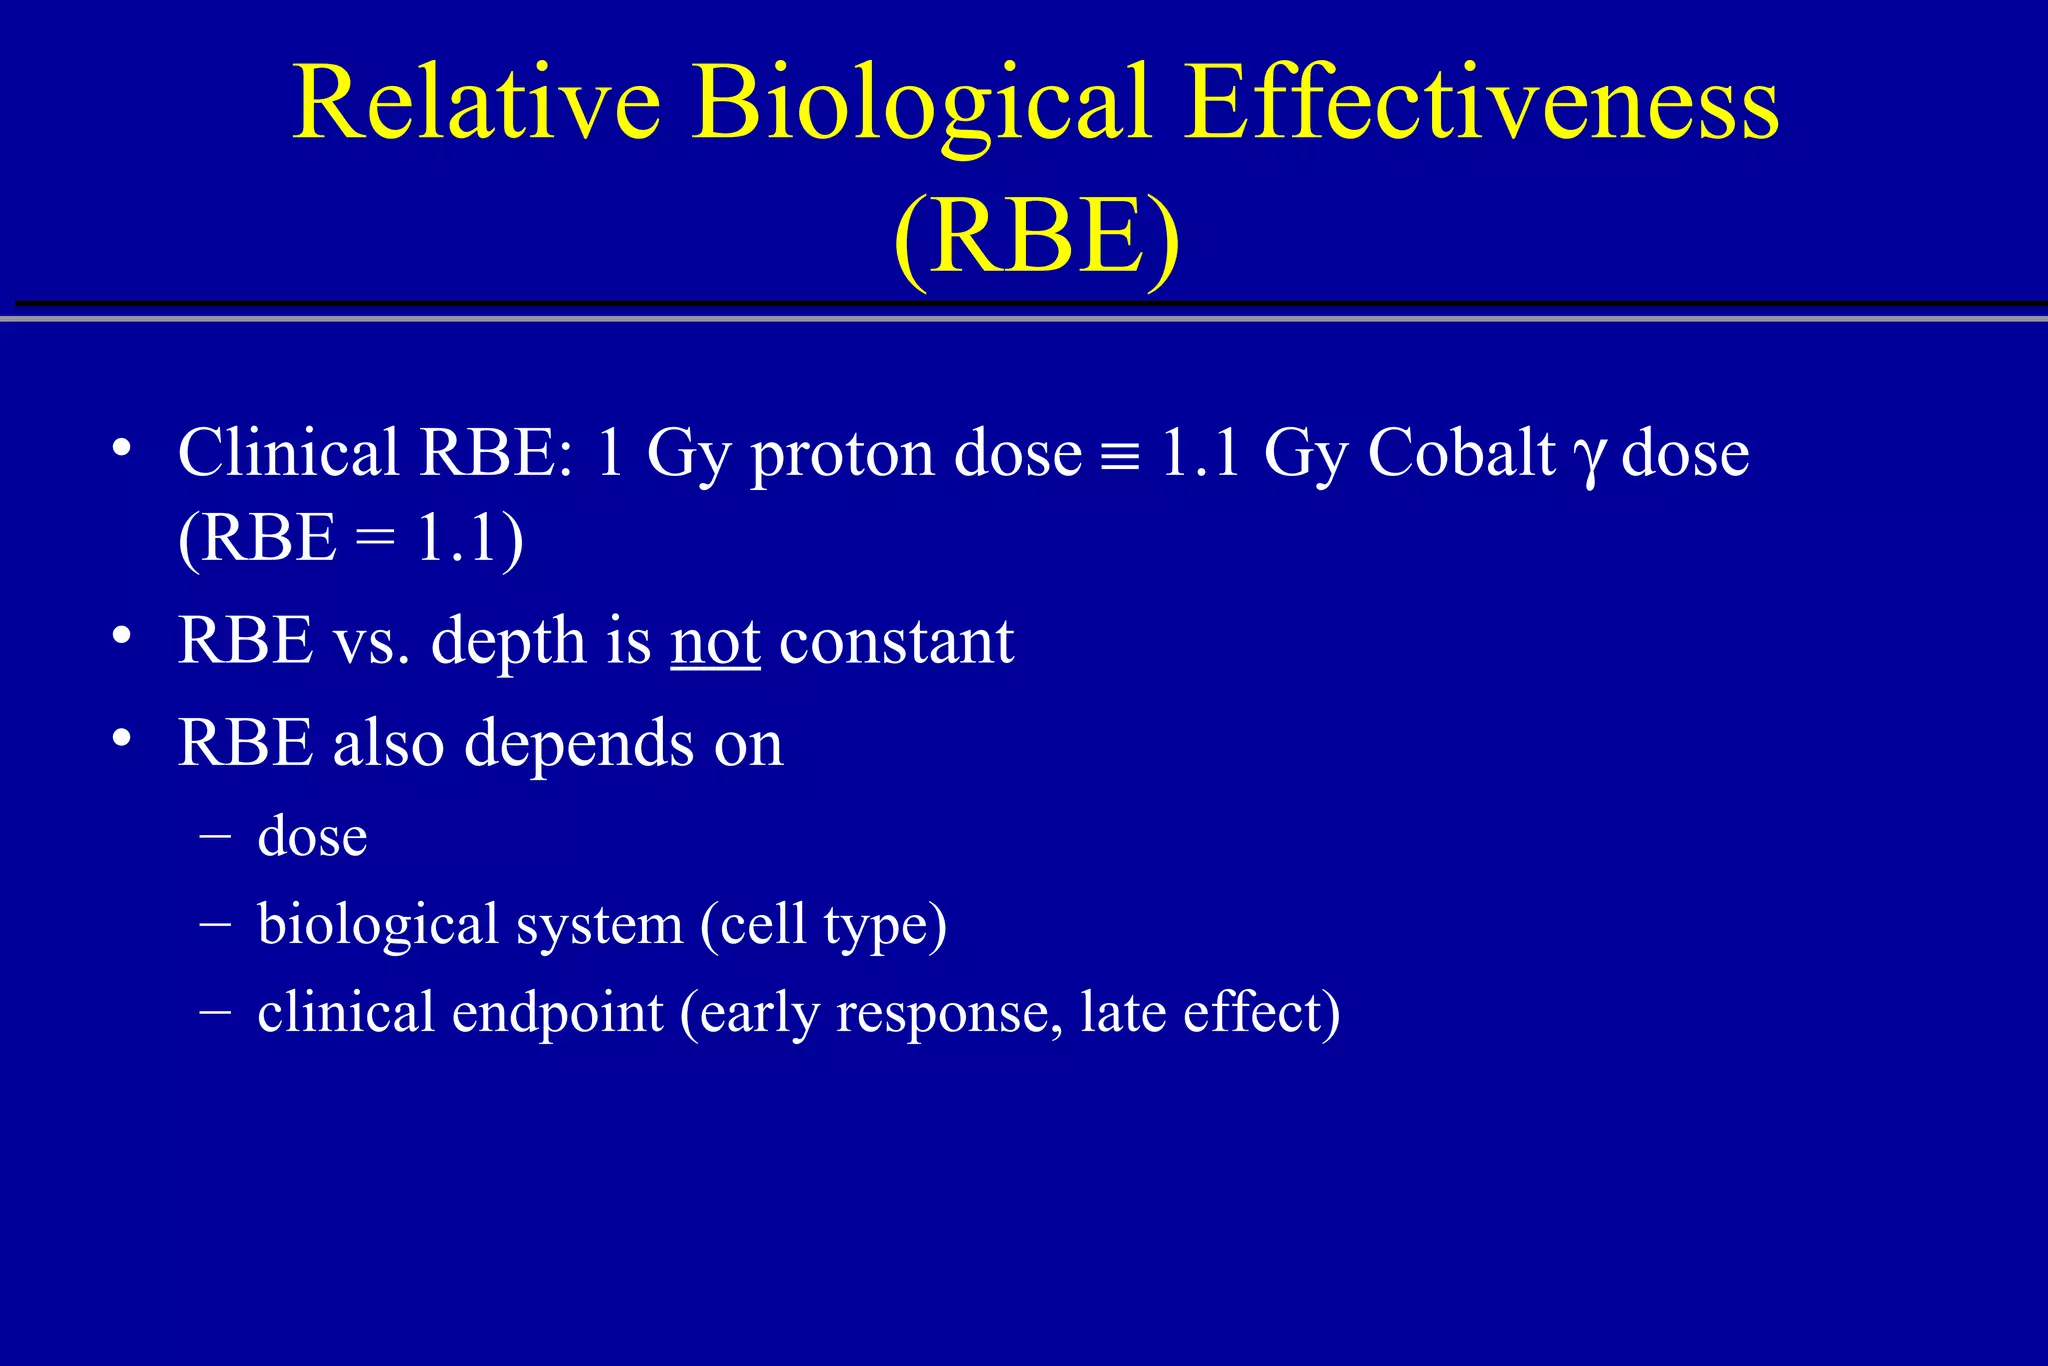
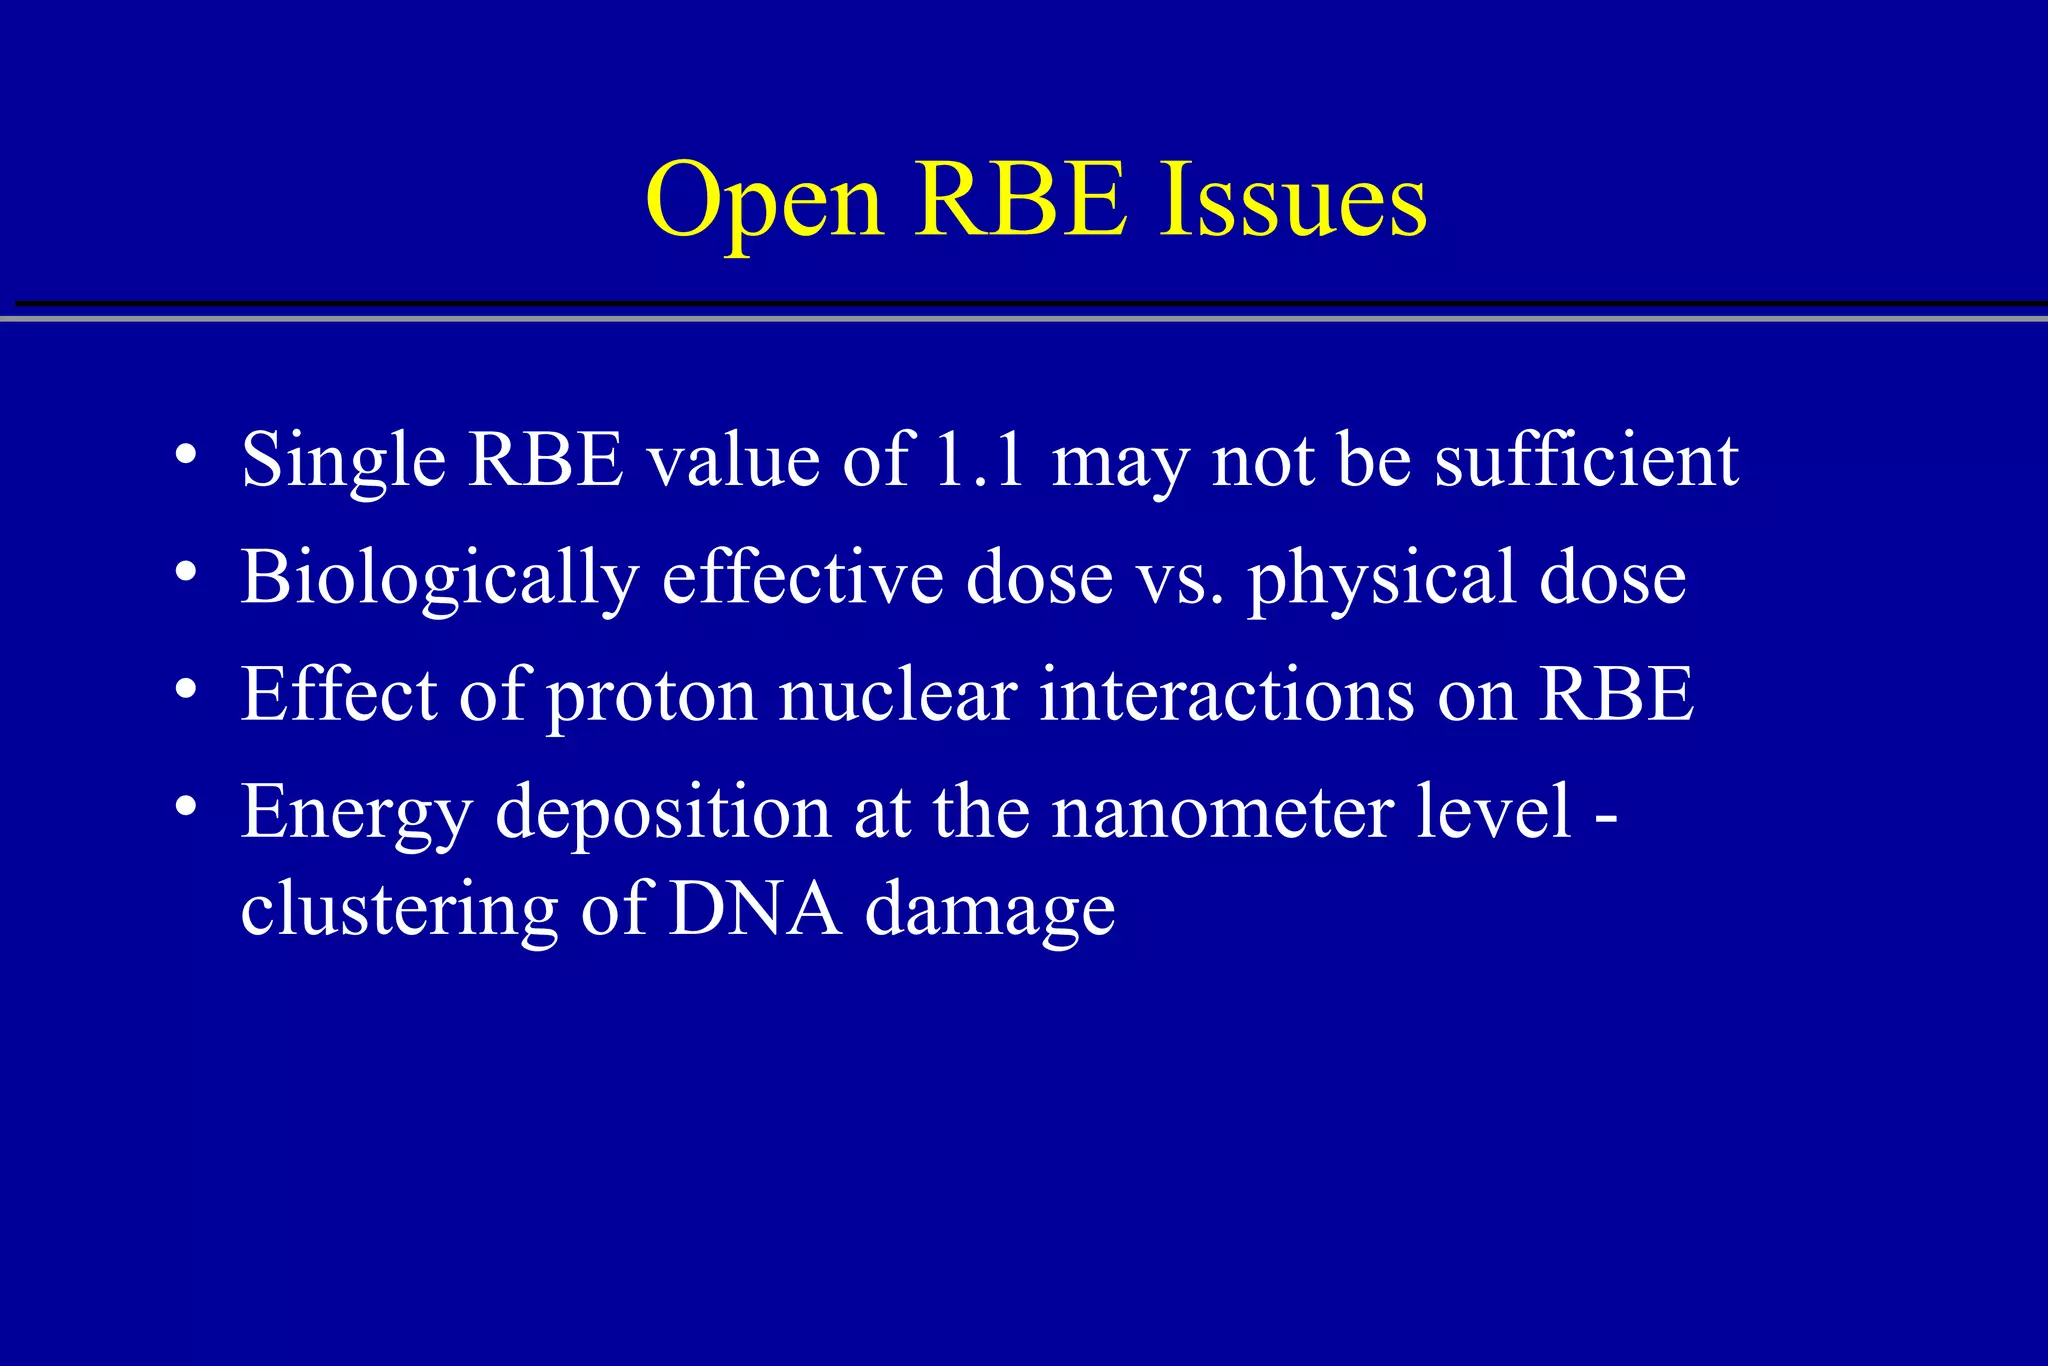
![RBE of a Modulated Proton Beam Source: S.M. Seltzer, NISTIIR 5221 1.7 4 6 8 12 14 16 18 20 0 10 2 0.8 0.6 0.2 0.4 0.9 0.0 1.1 1.2 1.3 1.4 1.5 1.6 1.0 Modulated beam 160 MeV Depth [cm] RBE low high Relative dose 1.0 Clinical RBE](https://image.slidesharecdn.com/the-use-of-highenergy-protons-1233610364226521-2/75/The-Use-Of-High-Energy-Protons-46-2048.jpg)

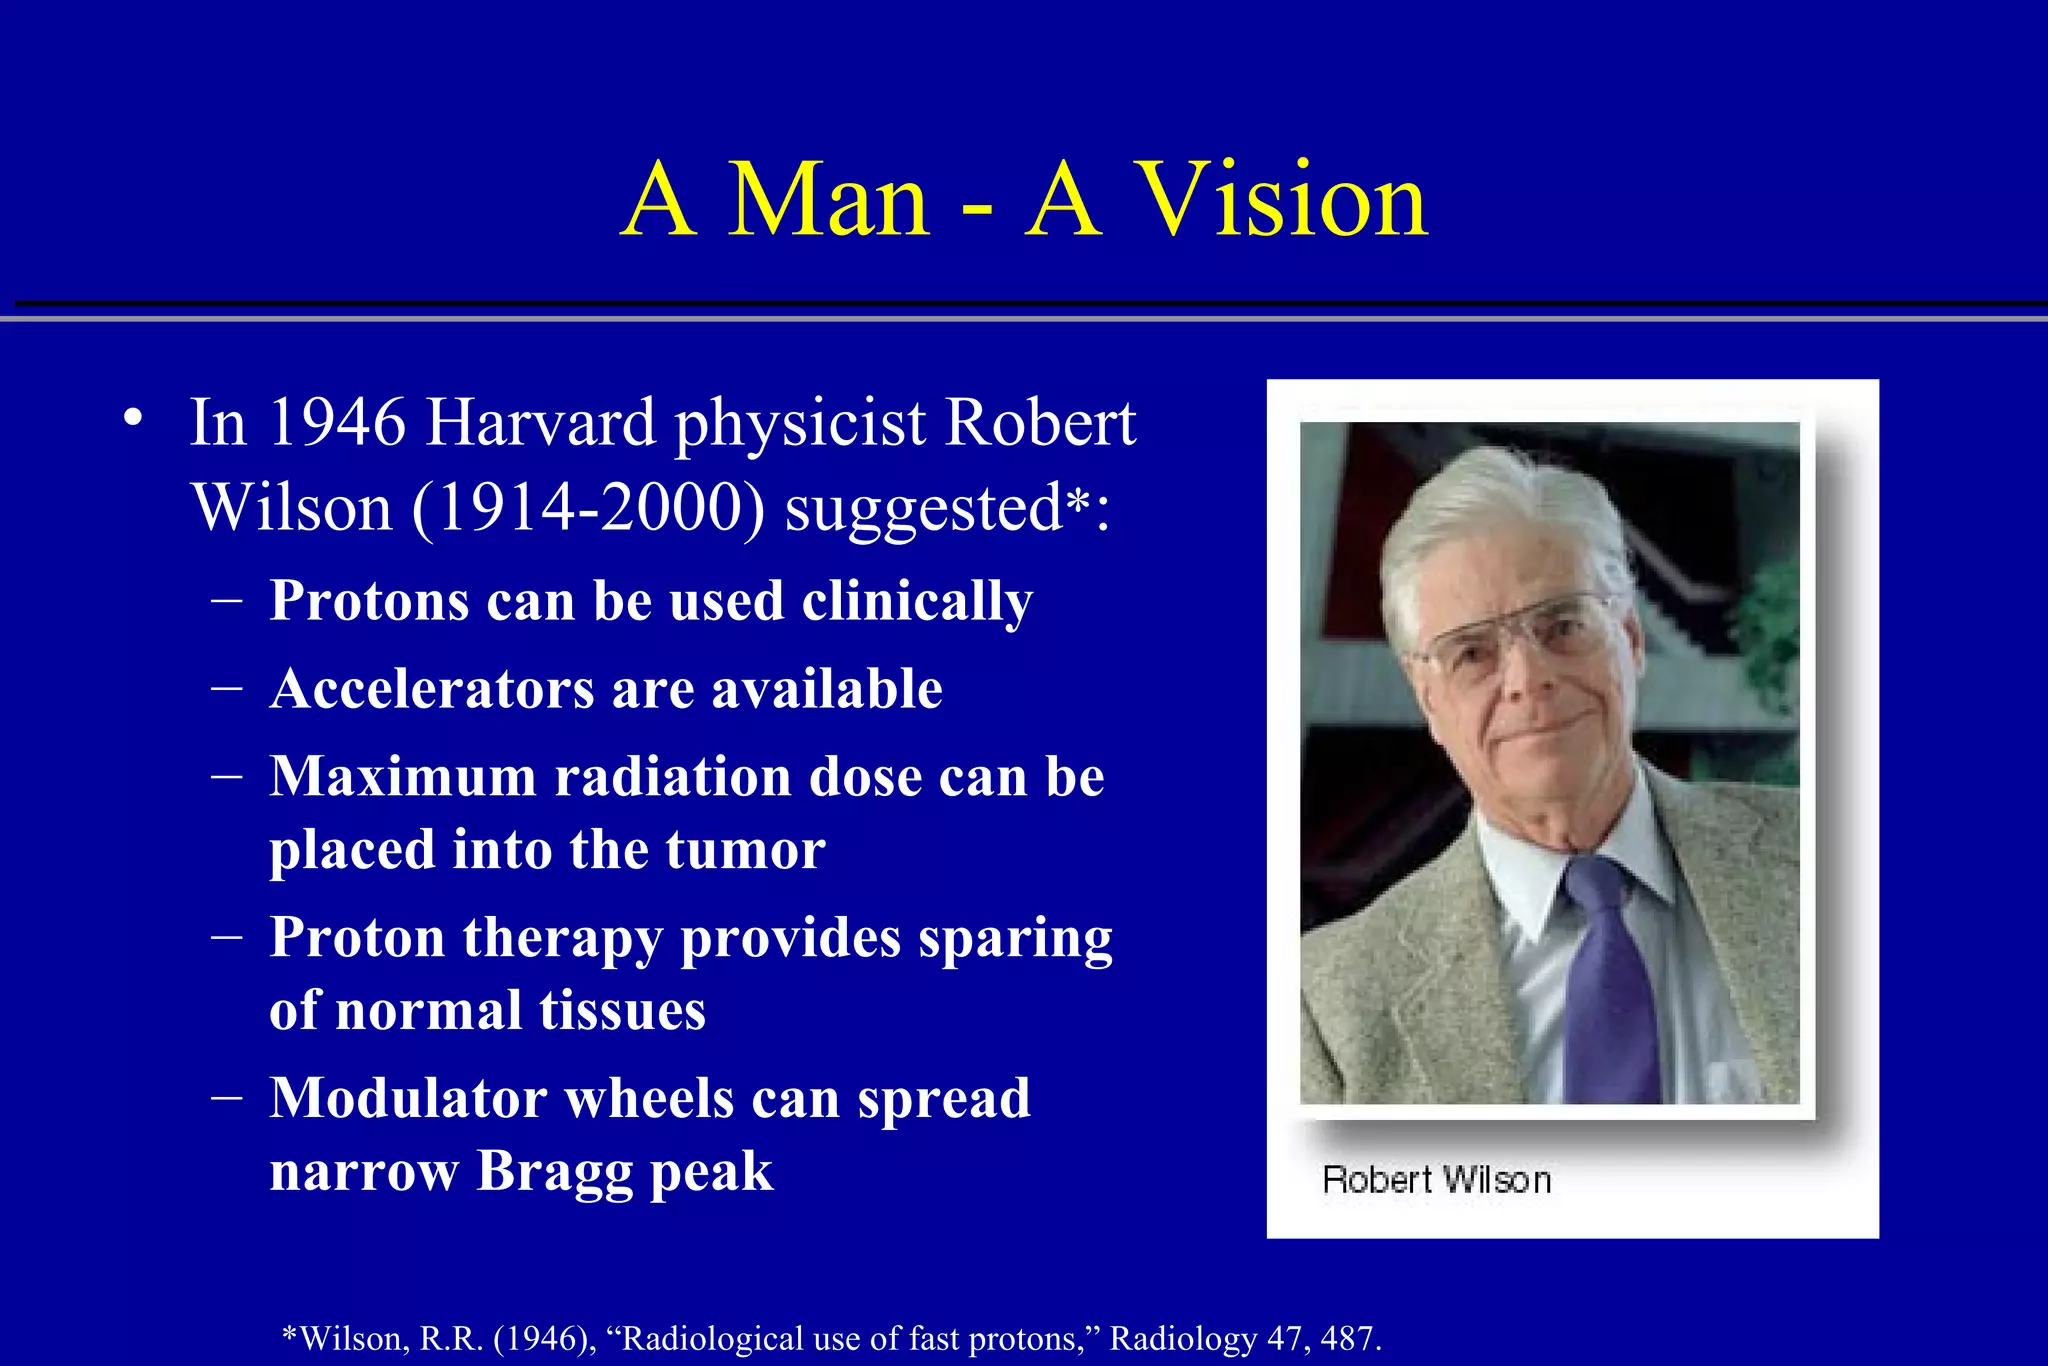
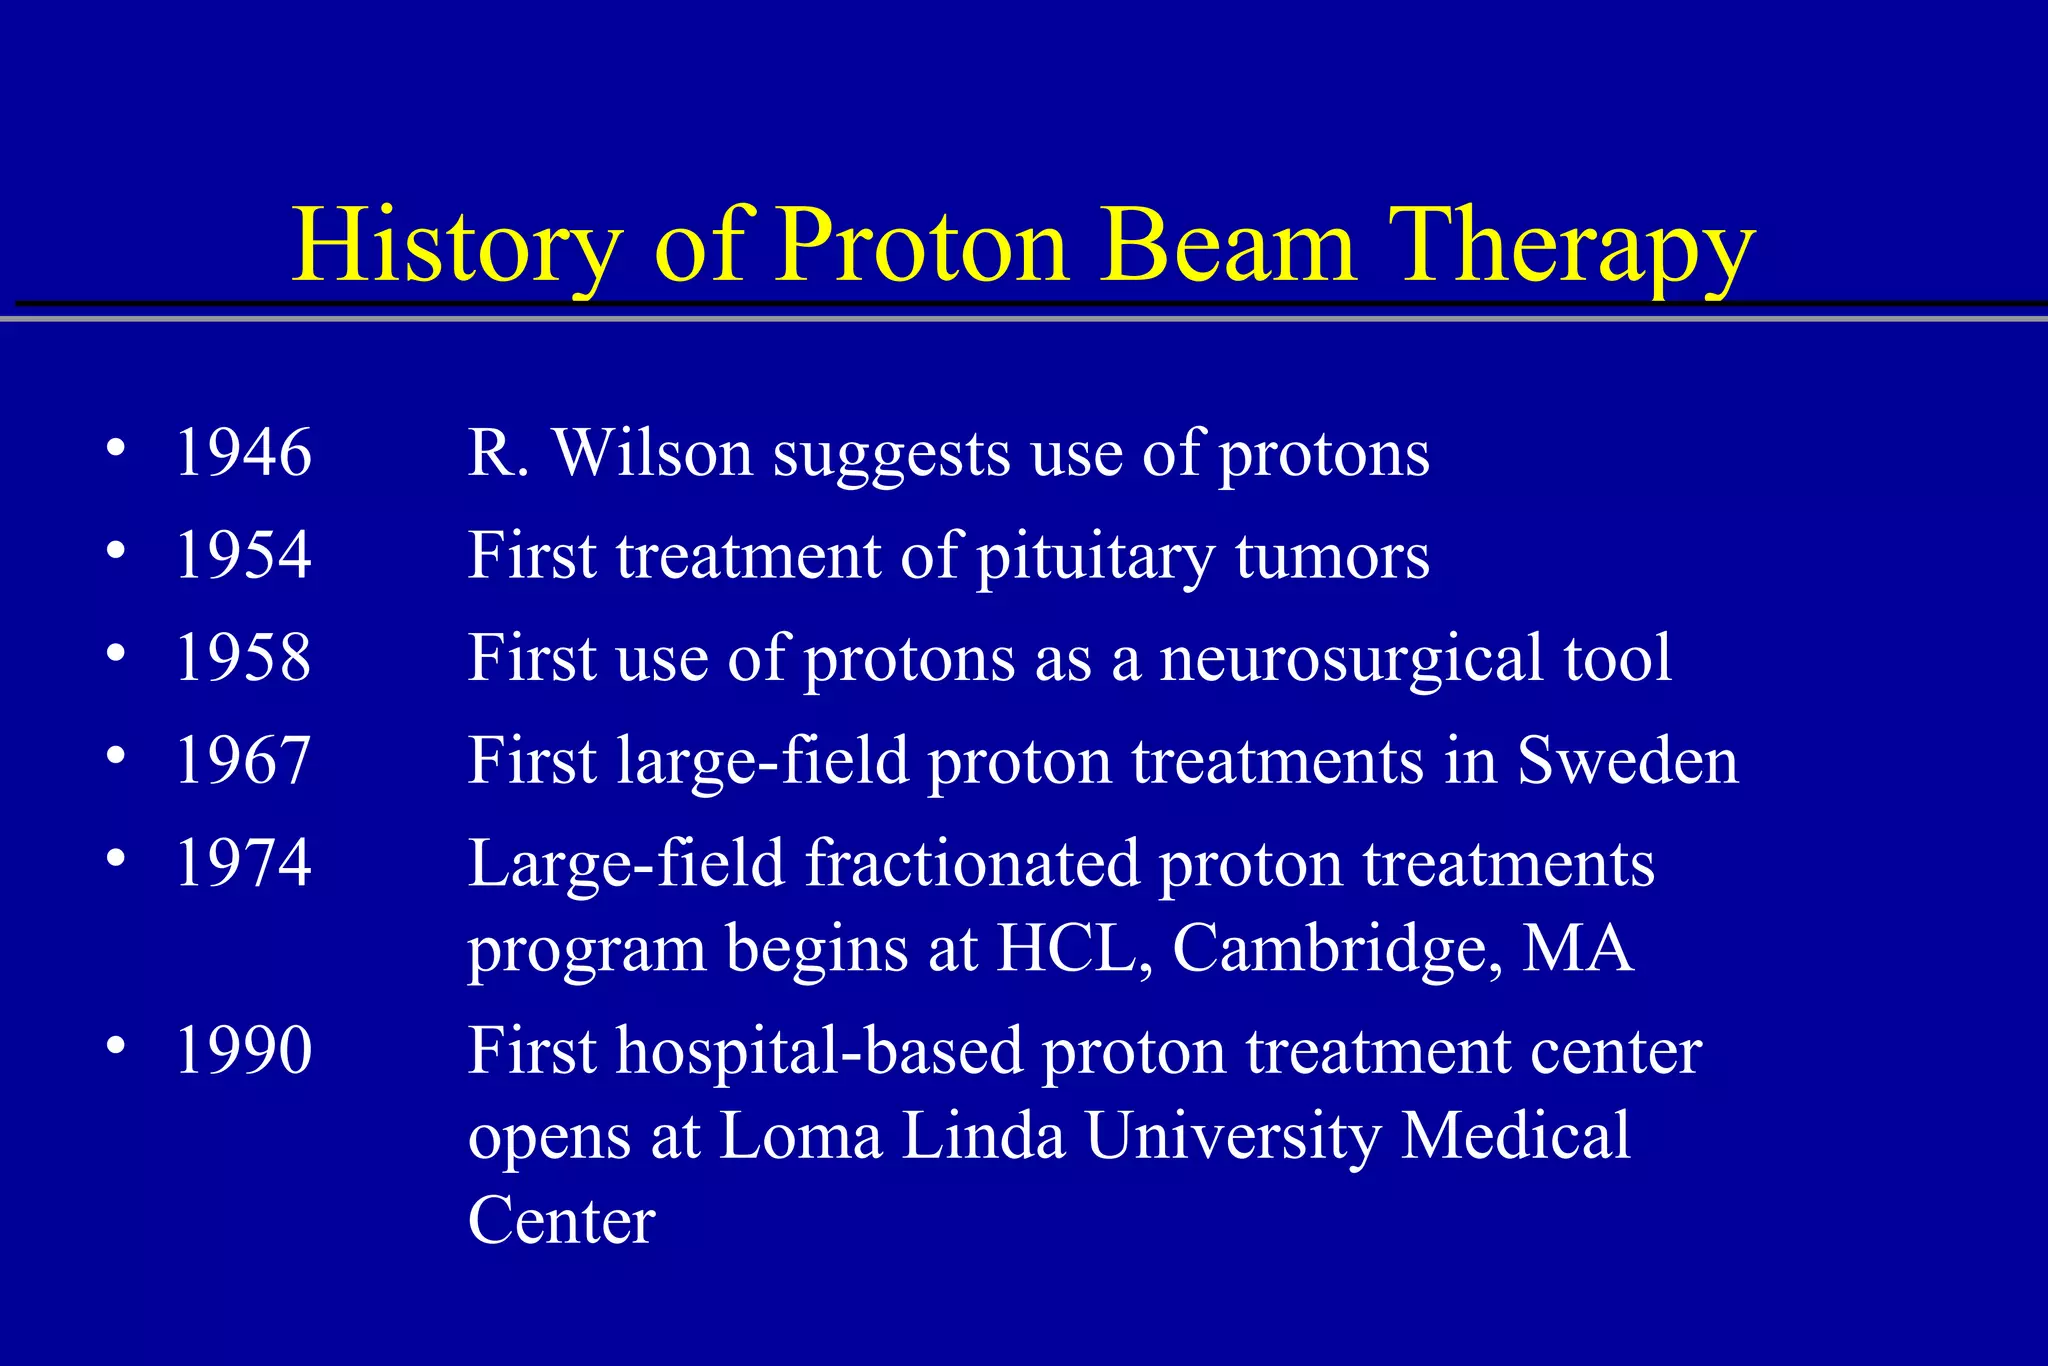
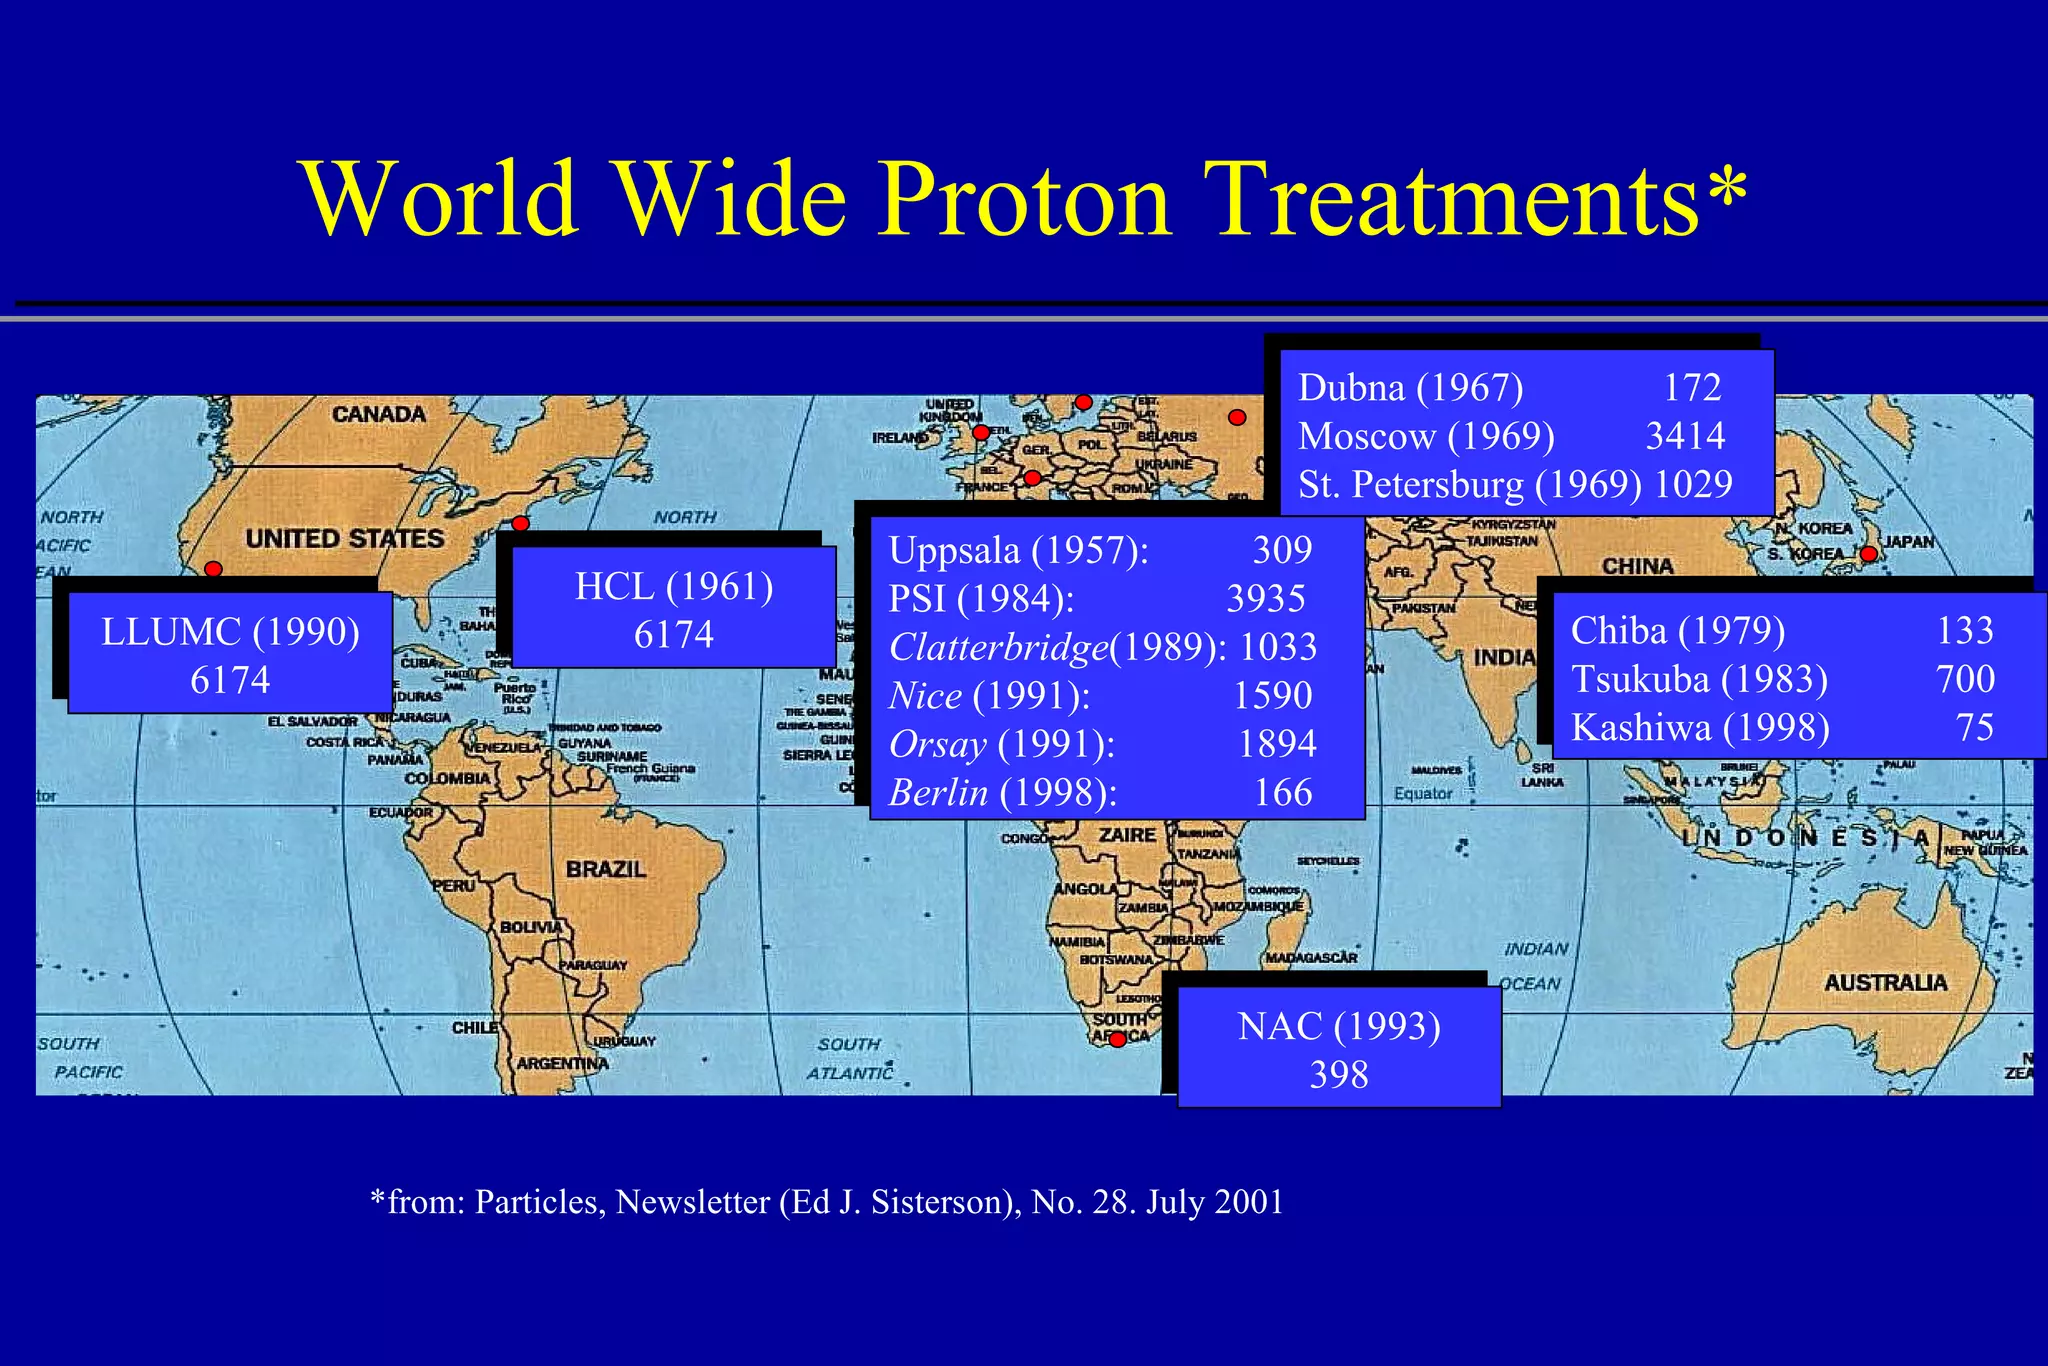
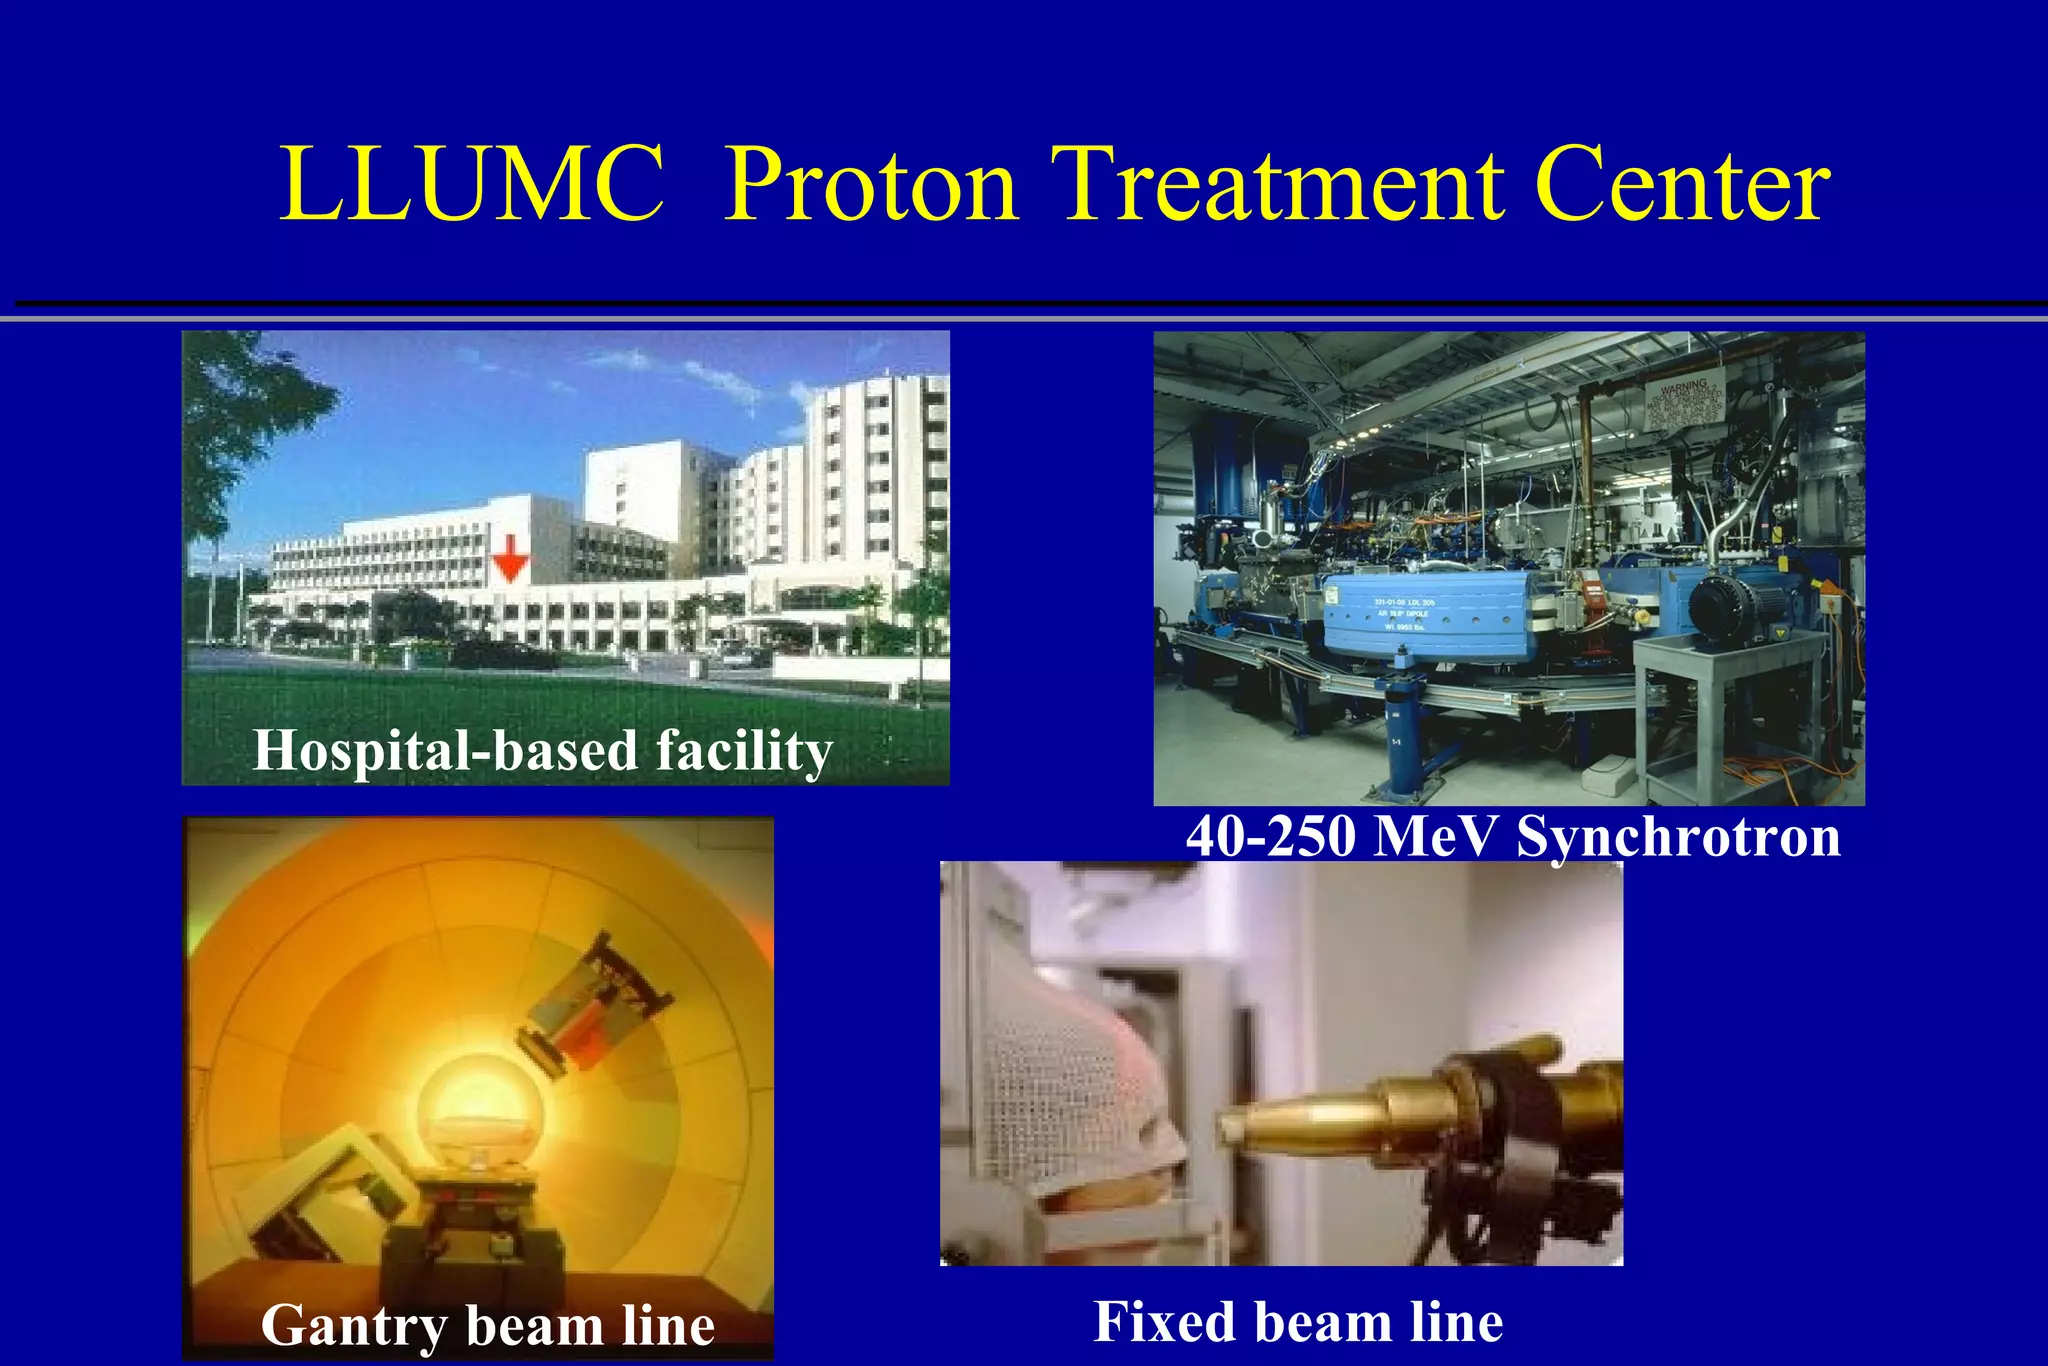
The document discusses the use of high-energy protons in cancer therapy. It provides a history of proton beam therapy beginning in 1946 when Robert Wilson first suggested its use. It describes the first proton treatment centers and worldwide growth of proton therapy facilities. Key advantages of protons over photons discussed include lower entrance dose and maximum dose at tumor depth. Challenges and uncertainties in proton therapy planning and delivery are also summarized.


