Download as PDF, PPTX
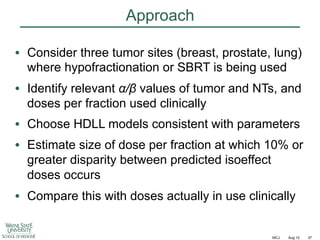
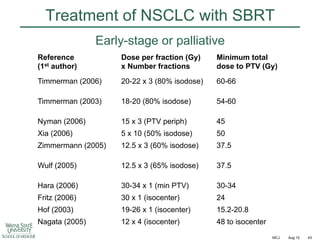
![Immunological effects at high doses
A549 Human NSCLC in lungs of nude mice
27 days after 12 Gy single dose
Hematoxylin-Eosin
Masson-Trichrome
IF
H
F
H
x20
Tumor
Small tumor nodules (arrows) with
degenerative changes in nuclei
and cytoplasm. Multiple large
vacuoles, hemorrhages [H] and
scattered inflammatory infiltrates
x40
Normal lung
Heavy infiltration of inflammatory
cells [IF] mostly lymphocytes and
neutrophils. Fibrous tissue [F] in
midst of inflammatory infiltrates
x40
C
Normal lung
Extensive fibrotic tissue [C] and
hemorrhages [H]
Hillman GG et al. Radiother Oncol 2011;101:329–36
MCJ
Aug 12
27](https://image.slidesharecdn.com/mot-2012-michaeljoiner-hypofractionation-131220073118-phpapp02/85/2012-michael-joiner-hypofractionation-27-320.jpg)
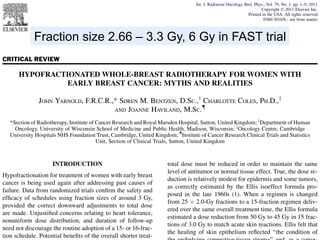
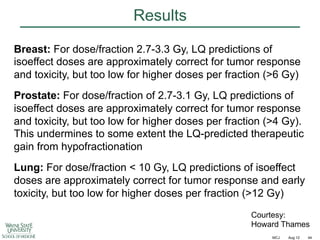
![Fractionation in breast cancer
Mean = 4.0 [CL 1.0 – 7.8]](https://image.slidesharecdn.com/mot-2012-michaeljoiner-hypofractionation-131220073118-phpapp02/85/2012-michael-joiner-hypofractionation-38-320.jpg)
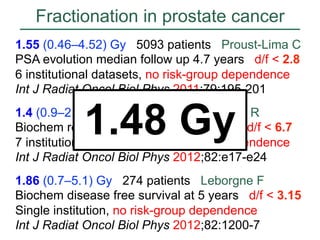
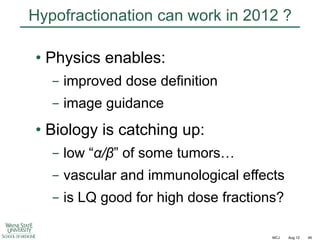
![Fractionation in prostate cancer
Int J Radiat Oncol Biol Phys
2011;79:195–201
Mean = 1.55 [CL 0.46 – 4.52]](https://image.slidesharecdn.com/mot-2012-michaeljoiner-hypofractionation-131220073118-phpapp02/85/2012-michael-joiner-hypofractionation-40-320.jpg)

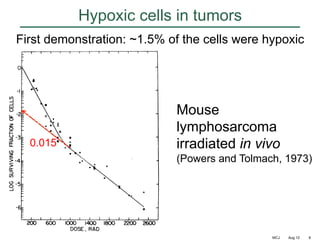
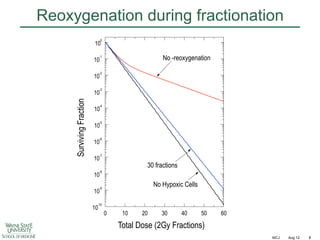
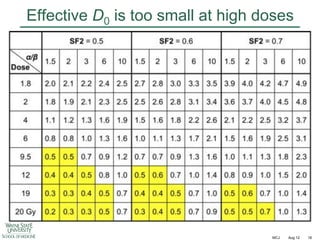
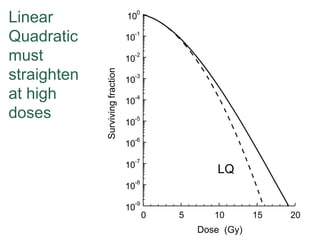
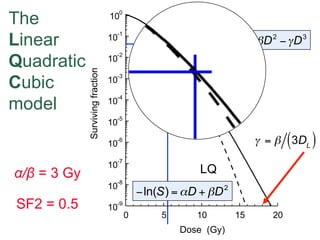
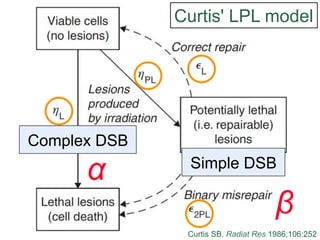
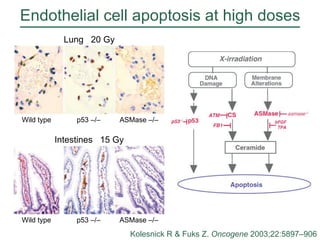
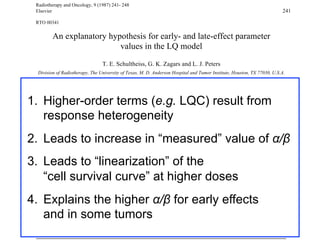
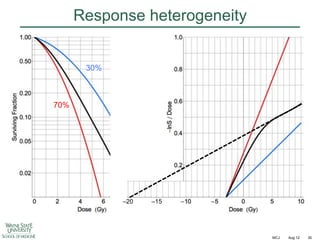
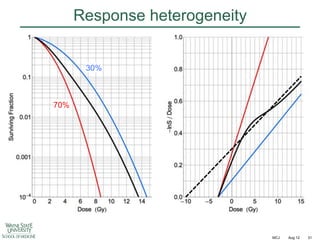
The document discusses how tumor radiobiology may impact the move toward hypofractionation in radiation therapy. It reviews evidence that the classic linear-quadratic model does not fully capture tumor response at high radiation doses, and that other factors like vascular damage and immune effects become more important. Response heterogeneity between different tumor cell populations may also help explain why survival curves appear more linear at higher doses per fraction.


